
Rapid through-container detection of fake spirits and methanol quantification with handheld Raman spectroscopy†
D. I.
Ellis
 *a,
H.
Muhamadali
ab,
Y.
Xu
ab,
R.
Eccles
c,
I.
Goodall
c and
R.
Goodacre
*ab
*a,
H.
Muhamadali
ab,
Y.
Xu
ab,
R.
Eccles
c,
I.
Goodall
c and
R.
Goodacre
*ab
aManchester Institute of Biotechnology, School of Chemistry, University of Manchester, M1 7DN, UK. E-mail: D.Ellis@manchester.ac.uk
bDepartment of Biochemistry, Institute of Integrative Biology, University of Liverpool, Biosciences Building, Crown Street, Liverpool L69 7ZB, UK. E-mail: roy.goodacre@liverpool.ac.uk
cScotch Whisky Research Institute, Research Avenue North, Riccarton, Edinburgh, EH14 4AP, UK
First published on 26th November 2018
Abstract
The spirits drinks industry is of significant global economic importance and a major employer worldwide, and the ability to ensure product authenticity and maintain consumer confidence in these high-value products is absolutely essential. Spirit drinks counterfeiting is a worldwide problem, with counterfeiting and adulteration of spirit drinks taking many forms, such as substitution, stretching with lower-grade products, or creation of counterfeits with industrial, surrogate, or locally produced alcohols. Methanol for example, which has been used as a substitute alcohol for ethanol, has a high toxicity in humans. The counterfeiting of spirit drinks is consequently one of the few leading reported types of food fraud which can be directly and unequivocally linked to food safety and health concerns. Here, for the first time, we use handheld Raman spectroscopy with excitation in the near IR (1064 nm) for the through-container differentiation of multiple spirit drinks, detection of multiple chemical markers of counterfeit alcohol, and for the quantification of methanol. We established the limits of detection (LOD) of methanol in the analysed samples from four different spirit types (between 0.23–0.39%), which were considerably lower than a quoted maximum tolerable concentration (MTC) of 2% (v/v) methanol for humans in a 40% alcohol by volume (ABV) spirit drink, and even lower than the general EU limit for naturally occurring methanol in fruit spirits of 0.5% v/v (10 g methanol per L ethanol). We believe that Raman spectroscopy has considerable practicable potential for the rapid in situ through-container detection of counterfeit spirits drinks, as well as for the analysis and protection of other beverages and liquid samples.
Introduction
The spirits drinks industry is of significant economic importance and a major employer worldwide. In Europe for example, spirit drinks generate EU governments’ revenues of at least €23 billion in excise duties and VAT, with approximately 1 million jobs linked to the production, distribution and sales of spirit drinks.1,2 Spirit drinks are also the EU's biggest agri-food export, with almost two-thirds of the spirits produced within the EU being exported. In the United States in 2017, spirit drinks supplier revenues represented 36.6% of the total beverage alcohol market, or US $26.2bn, with U.S. exports being worth a projected US $1.63bn in 2017.3The ability to ensure and maintain consumer confidence in this important industry, by providing assurance that its products are authentic, is absolutely essential. Well known forms of counterfeiting, as with other forms of beverages,4,5 can include: complete substitution of a popular brand with a cheaper product; stretching of genuine products with cheaper locally produced ones; or the creation of counterfeits using either cheap locally produced alcohols, or alcohols used for industrial purposes such as denatured alcohol or methanol, with the addition of flavourings and colourings to these in order to mimic the real product. In addition, some counterfeiting operations will ‘recycle’ bona fide bottles to convince the consumer that they are being sold a genuine high-value product.6
Whilst many laboratory-based techniques have been used to authenticate spirit drinks (e.g., ref. 7 and 8), these methods generally require transportation of samples to analytical facilities. The bottles are opened prior to direct analysis and are therefore destructive, and the results are thus provided retrospectively. To date these lab-based methods include gas chromatography, liquid chromatography, nuclear magnetic resonance (NMR) spectroscopy,9,10 capillary electrophoresis,11 trace element concentrations,12 electrospray ionization mass spectrometry,13,14 as well as paper spray mass spectrometry.15 These have been used for the measurement of indicators of authenticity such as alcohol strength,16 volatile components (i.e. congeners),17–19 sugars, colouring compounds and wood components,20,21 as well as stable isotope ratios for data to assist in determination of botanical or geographical origins.22–24
Mobile brand authentication has also been receiving increasing attention for some time.25 Spectroscopic approaches have been of particular interest, since they offer the potential for rapid and easily deployable analyses, capable of being taken out of the laboratory and into supply chains for use by non-experts.26,27 These have included UV-Vis,28,29 fluorescence,30 and the vibrational spectroscopies – mid-infrared (MIR),31 near-infrared (NIR)32,33 and Raman approaches – the latter including conventional33,34 as well as more recently spatially offset Raman spectroscopy (SORS),35 and optical chip, waveguide confined Raman spectroscopy (WCRS).32,36 These have had varying degrees of success for through-container or direct analyses of spirit drinks samples.
Indeed, multiple attempts have been undertaken to explore the potential of Raman spectroscopy for the analysis and authentication of spirit drinks. These included very early experiments using a combination of outside bottle and in bottle fibre-optics and spectral subtraction, using a 783 nm laser at 30 mW.37 This resulted in some rudimentary Raman spectra, and the ability to detect ethanol through the bottle via fibre-optic in-bottle validation, and showing that through-bottle analysis was possible, though not at that point very practicable or information rich.37 Following this different excitation wavelengths (including: 488, 514, 532, and 785 nm) were investigated for out of the bottle direct analysis of spirit samples for ethanol,38,39 or ethanol and methanol quantification,40 but these still destroy the sample as it is removed from its container prior to analysis.
Moreover, in addition to our work here, there have only been three through-bottle demonstrations of Raman spectroscopy and two of these have been in the last year. Nordon and co-workers first reported on the determination of ethanol in spirit drinks using 785 nm excitation but these experiments were limited to clear glass bottles due to strong absorption/fluorescence occurring with coloured glass bottles.33 Also last year, Kiefer and co-workers analysed single malt Scotch whiskies through bottle with Raman spectroscopy at 785 nm, discriminating different brands, and detecting the presence/absence of artificial colourants but, yet again, with severe fluorescence from green glass.34 More recently, our group demonstrated the first use of handheld SORS (at 830 nm) on a food or beverage product with through-container detection of multiple chemical markers of counterfeit spirits,35 with methanol adulteration further validated through a range of commercial coloured bottles. In this study as SORS was used any fluorescence contribution from the bottle was minimal and could be removed by the use of spatially offset subtractions.
In the present study, we employ handheld Raman spectroscopy, with an excitation laser emitting at 1064 nm, to analyse a large range of spirit drinks samples provided by the Scotch Whisky Research Institute (SWRI). These samples were provided to us without identifications (i.e. blind encoded) and included genuine spirit drinks, as well as multiple counterfeits (n = 40) encompassing common additives and flavourings that signify the presence of illicit alcohol. We demonstrate the efficacy and potential of handheld Raman spectroscopy in conjunction with chemometrics for the detection of multiple chemical markers of fake spirit drinks within these complex chemical matrices, to extremely low concentrations. We also concentrate on the rapid quantification of methanol, including its detection through commercial spirit bottles, as this denaturant has a high toxicity in humans.
Materials and methods
Sample preparation
A comprehensive set of 144 samples were provided by the SWRI in Edinburgh. Of these there were representatives of brand profiles: (i) 60 different production rotations of a single genuine Scotch whisky brand; (ii) 10 different production rotations of a different genuine Scotch whisky; (iii) 10 different rotations of a third genuine Scotch whisky; (iv) 10 different rotations of a genuine Irish whiskey; and (v) 10 different rotations of a genuine vodka. All of these genuine products were supplied by their producers to the SWRI. The samples were subsampled directly into 2 mL threaded glass vials for analysis. More in-depth information regarding preparation of samples can be found in the ESI.†Raman analysis
All Raman spectra were collected using a handheld CBEx Raman spectrometer (Snowy Range, Laramie, USA) which operates using a 400 mW (300 mW at sample) 1064 nm laser with detection on a 2048 element CCD array, resulting in a 12–14 cm−1 spectral resolution. The instrument is equipped with orbital raster scanning (ORS) and we used this to increase sample volume interrogation while in the vial mode. In addition, we used the point-and-shoot function as well to measure directly through glass spirit bottle walls. All spectra were collected in the spectral range 400–2300 cm−1 with an acquisition time of 15 s. All experiments were undertaken in triplicate with a total of 1521 spectra manually collected for the adulteration experiments (n = 1296) and generation of methanol quantification curves (n = 225). Information on through-bottle analysis using commercial bottles can be found in ESI.†Methanol quantification, standard curve
Partial least squares regression (PLSR) was employed to establish multivariate quantitative models in order to quantify the concentrations of methanol using Raman spectra collected from the handheld device. The limit of detections (LODs) of methanol in four types of spirits were established based on the PLSR models using the method described in ref. 41. The reason we chose to quantify methanol was that is a potent toxicant in humans.45 Whilst it also occurs naturally at a low to trace levels in most alcoholic beverages (and other beverages such as fruit juices42), this is at concentrations which normally would not cause harm. However, counterfeit spirits, especially the ones made from denaturants such as industrial alcohols, may have very high levels of methanol and can lead to serious illness and fatalities in consumers. Considering the fact that very low to trace level methanol commonly exist in spirits drinks, the estimates for the LOD from spirits samples should be higher than the actual LOD. Thus ‘Blank’ samples were also provided to estimate the genuine LOD of methanol using the handheld device.Pure unadulterated spirits (whisky, rum, vodka and gin) and LC-MS grade methanol (Rathburn Chemicals, UK) were used to generate additional samples (2 mL in clear vials) spiked with methanol ranging from 0–3% in 0.2% increments. The Raman spectral data generated from these samples were used to generate PLSR models for methanol quantification. Additional test samples (2 mL) which were blind coded to the investigators, with varying concentrations of methanol were also prepared following the same protocol, and used to test the generalization performances of the trained chemometric models.
As the Raman spectral data suggested the presence of a natural background concentration of methanol in the examined spirit samples, which may affect the accuracy of the PLSR models, a second set of samples were prepared, using 40% ethanol/water solution spiked with methanol ranging from 0–3% with 0.2% increments, to establish the natural concentration of methanol in the examined spirits.
Details of standard chemometric methods such as PCA for exploratory analysis, Multiblock-PCA (MB-PCA) for discriminating different simulated counterfeit spirits, and PLSR for methanol quantification and determination of limit of detections used in this study can be found in ESI.† The code for these calculations is available on GitHub (https://github.com/Biospec/).
Results and discussion
Detection of denaturants and flavourings in spirits
A range of multivariate statistical approaches were employed to differentiate the Raman spectral data, as the mean Raman spectra of these samples (Fig. S1†) were dominated by the ethanol characteristic vibrations, and therefore were visibly very similar. Fig. S2† shows a spectral comparison between pure ethanol and methanol. The PCA scores plot (Fig. S3a†) shows Raman spectral data of genuine and adulterated spirits (whisky, vodka, rum and gin) collected using the handheld CBEx instrument, with separation according to the PC1 axis with a total explained variance (TEV) of 76%, and very distinct differentiation between rum and all other samples. The rum samples were a homogenised mix of two expressions of one brand, one was rum as defined by the EU definition and the second a spiced rum, which is defined as a rum-based spirit drink within the EU. The very obvious difference between the rum samples and all other spirits would probably be due to the production methods for rum, as well as certain flavourings, colourings and/or sugars that are very different from whisky, vodka, and gin. Fig. S3b† shows the same samples after the rum spectral data have been removed.In addition, Raman spectral data of whisky samples containing various adulterants, in the form of denaturants or flavourings identified in counterfeit spirit drinks worldwide (Table S1†), were readily differentiated using MB-PCA. The super scores plot in Fig. S4† shows clear separation of the whisky samples containing 2% methanol from all other samples according to PC1 (TEV = 23.34%), while PC2 allowed for the differentiation of the remaining samples. As PC1 was dominated by the samples containing 2% methanol, these samples (2% methanol) were removed and the MB-PCA were repeated (Fig. S5†). Results then showed the separation of 100 ppm sucrose, 10 ppm vanillin, 4 ppm ethyl sec-amyl ketone and 190 ppm MEK from the remaining samples, according to PC1 with TEV of 7.51%.
Quantification of methanol in spirits
Next, additional spirit samples containing various concentrations (0–3%) of methanol were also prepared, analysed by Raman spectroscopy and the spectra used to generate PLSR models for predicting the level of methanol spikes into these samples. The generated PLSR models displayed a strong linear correlation with increasing methanol concentration (Fig. 1); also shown in these plots are the linear fit equations and Q2 which gives an estimate of model linearity (the closer to 1 the better). According to the PLSR loadings plot (Fig. 2c) the peak at 1030 cm−1 assigned to the methanol C–O stretching vibration (Fig. S2†) was the most significant peak contributing to this model. The Raman spectra of whisky samples containing different concentrations of methanol (Fig. 2a and b) also shows the appearance of this peak with increasing concentrations of methanol from 0 to 3% (blue to red spectra). According to the PLSR models (Fig. 1), the limit of detection (LOD) of methanol in the spirits were between 0.23–0.39% (Table 1). It is also worth noting that the LOD in vodka and gin were both lower compared to whisky and rum, which could be a result of these two types of spirit drink being colourless and thereby exhibiting less interference with the Raman signal. In addition, the LOD of methanol calculated from “Blank” samples (see above) was 0.15%, which was lower than those obtained from all four types of spirits analysed. This is likely to be a more accurate representation of the genuine LOD for methanol using this specific 1064 nm handheld Raman device, without the contributions from naturally occurring low levels of methanol already present within these four types of spirit drink samples, and found within many other foods and beverages.42 In the three branded Scotch whisky and one Irish whiskey samples tested here, the naturally occurring levels were as follows: W1, 0.00632%; W2, 0.0058%; W3, 0.0034%; W4, 0.00372%, with an estimate of accuracy for these measurements of 0.00036% (±3.6 mg L−1). All measurements were undertaken using GC-FID on-site at the SWRI. The naturally occurring background methanol levels in these spirits are far lower (ca. 60×) than our LODs of methanol from Raman-based measurements and so we do not need to adjust for these in the PLSR predictions.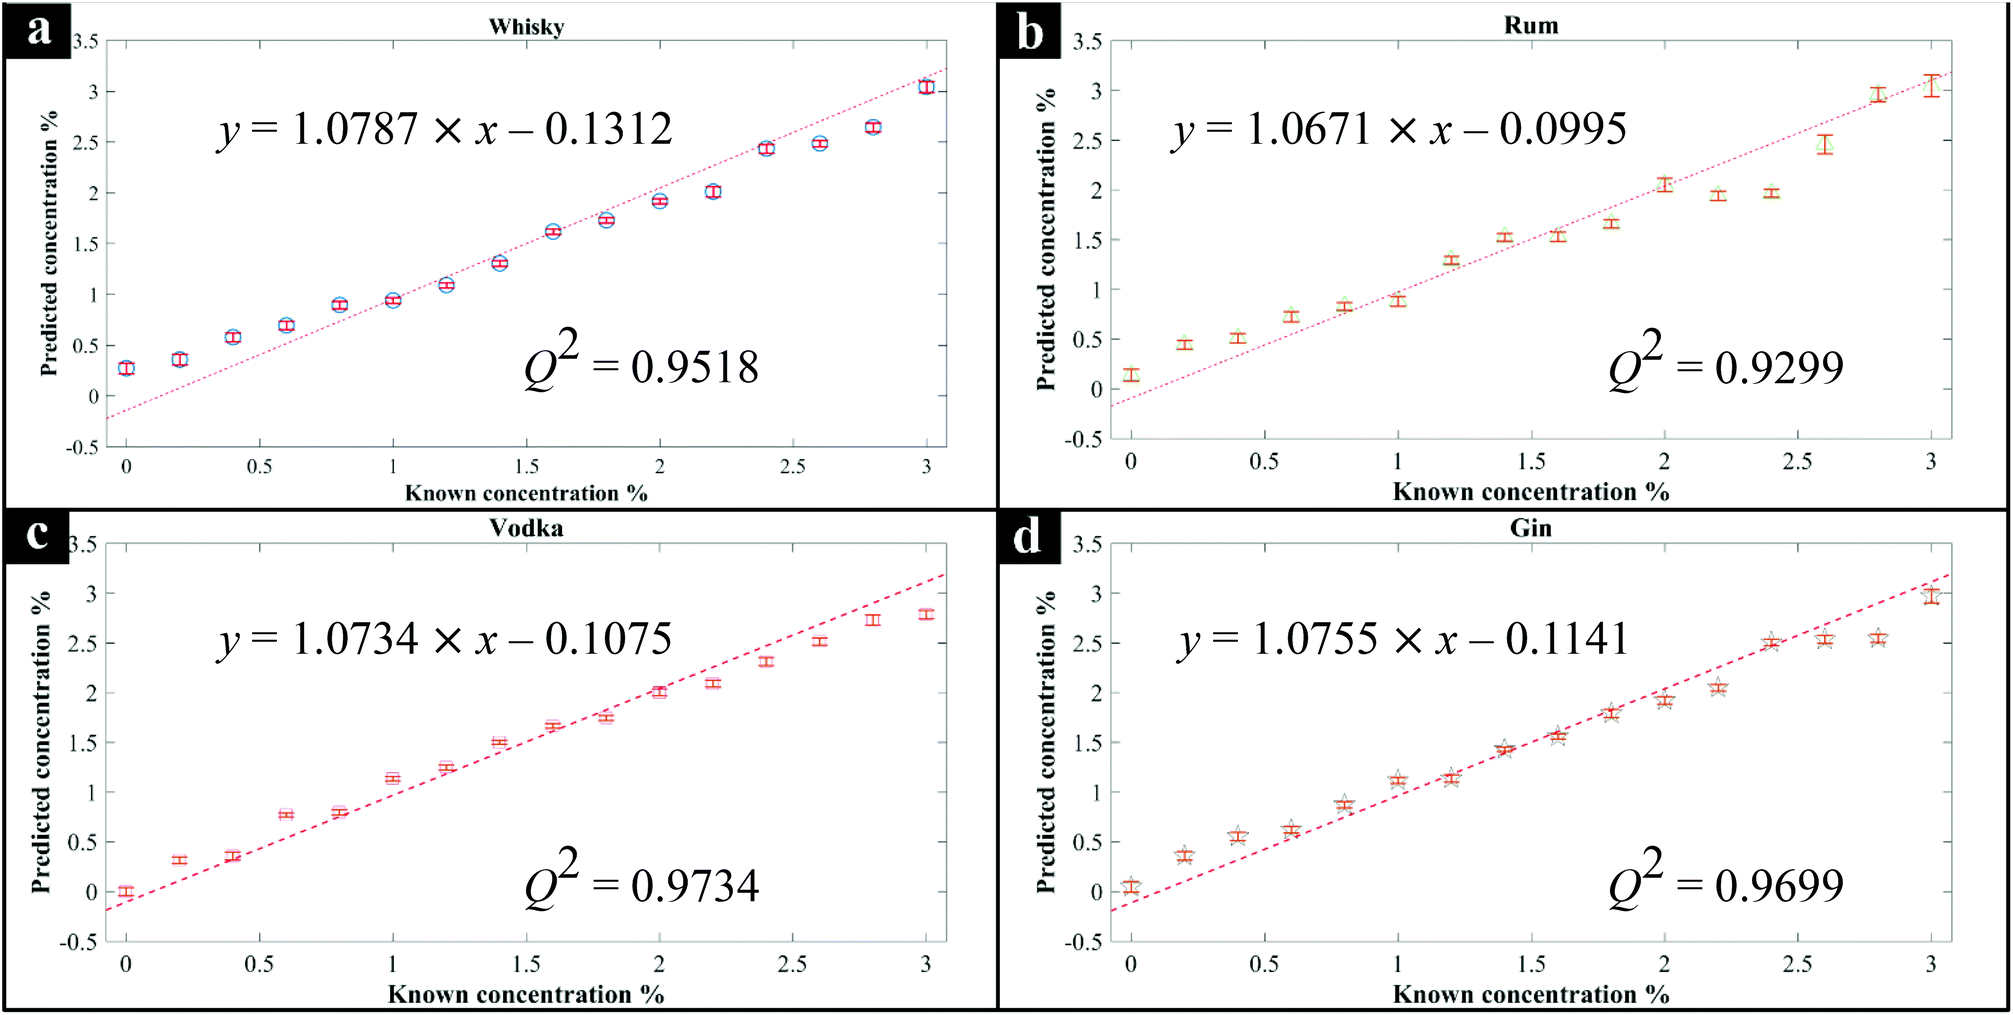 | ||
| Fig. 1 PLSR predictions generated using the Raman spectral data of the four spirits containing 0–3% methanol: (a) whisky, (b) rum, (c) vodka, (d) gin. The error bars denote standard deviation of the mean of three measurements. | ||
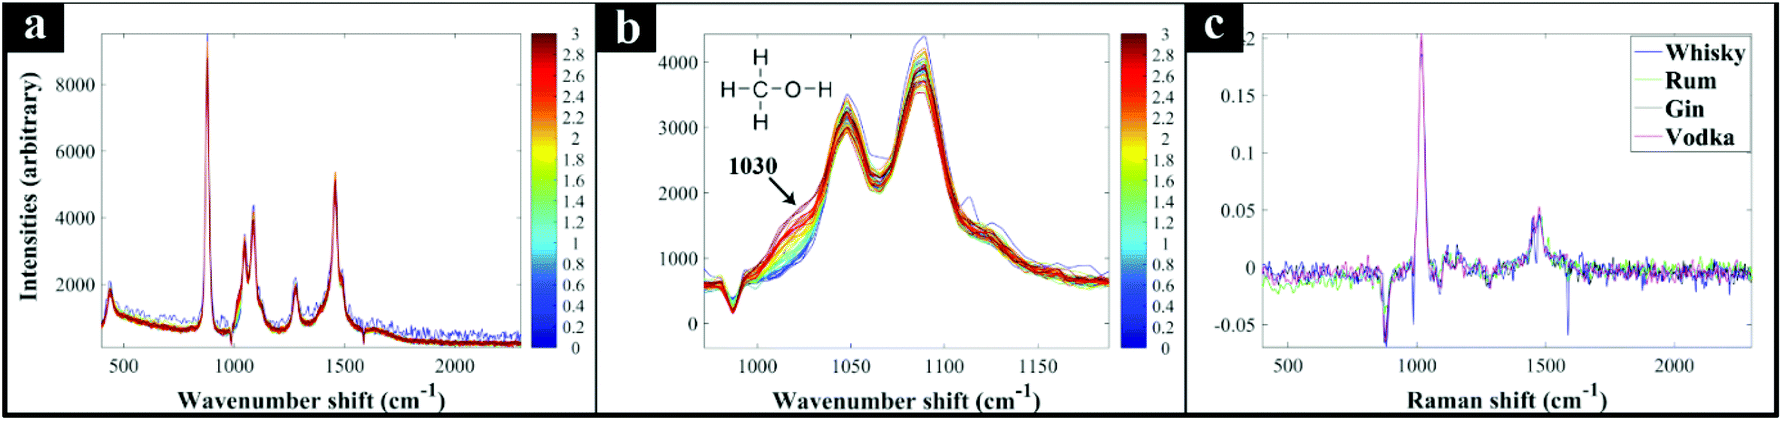 | ||
| Fig. 2 Raman spectra of (a) whisky samples containing methanol (0–3%), and (b) a close-up view of the methanol C–O stretching vibration detected at 1030 cm−1. (c) The PLSR loadings plots of all four spirits (whisky, rum, gin and vodka), suggested the methanol vibration at 1030 cm−1 as the most significant variable contributing to the model. | ||
| Known, % | Predicted, % | |||
|---|---|---|---|---|
| Whisky | Rum | Gin | Vodka | |
| The limit of detection (LOD) for methanol in each of the spirits and root-mean-squared error of prediction (RMSEP) of the model is also reported.a External test samples not used in model construction. | ||||
| 0.2a | 0.41 | 0.19 | 0.31 | 0.04 |
| 1 | 0.92 | 1.22 | 0.85 | 0.84 |
| 1.8a | 1.44 | 1.69 | 1.81 | 1.42 |
| 2.6 | 2.08 | 2.47 | 2.39 | 2.19 |
| RMSEP | 0.34 | 0.14 | 0.14 | 0.30 |
| LOD | 0.28 | 0.39 | 0.24 | 0.23 |
| Q 2 | 0.8592 | 0.9758 | 0.9754 | 0.8863 |
To test the prediction accuracy of the generated PLSR models, a set of test samples with different concentrations of methanol in these spirits were also made up and analysed with the same instrument (Table 1). The model proved to be highly accurate (Fig. 3) with overall root-mean-square error of predictions (RMSEP) between 0.16–0.35% (in terms of percentage of methanol in the sample) (Table 1).
 | ||
| Fig. 3 Quantification of methanol in external blind test samples using the generated PLSR models, demonstrating the predicted concentration versus known concentrations. | ||
Through-bottle analysis
In addition to the set of 144 samples provided by the SWRI in glass vials, a further subset of samples were analysed using the Snowy Range 1064 nm handheld spectrometer (Snowy Range, Laramie, USA). The analysis was undertaken to explore the potential of this approach with multiple types of spirit drinks in a range of genuine spirit bottles purchased from local retailers in various colours of glass. Seven bottles were analysed in total, which were made from clear (flint) or coloured (blue/green/brown) glass, and contained vodka, Irish and American whiskey, brandy, rum and two brands of gin. Spectra were collected directly through the unopened bottles with the 1064 nm handheld device in point-and-shoot mode,26 with the samples being draped with a black cover to minimise light interference. These handheld spectrometers are able to measure in vial mode, by placing a vial into a chamber in the device, or in point-and-shoot mode, via an adjustable tip accessory which allows the user to point the laser directly at a sample, and through containers or packaging. The commercial glass bottles were then opened and adulterated with various levels of methanol (0, 0.5, 1, 2, and 5%), before being closed and spectra again collected through the bottle in the point-and-shoot mode as described above.The PCA scores plots for each of these Raman data (Fig. 4) displayed a clear concentration-dependent trend for all tested samples according to PC1 axis, except for those data collected from the brown bottled gin (Fig. 4g) for which there was no clear pattern. This one outlier in the subset of seven commercial bottles analysed (Fig. 4g), was highly likely due to the dark brown coloured glass interfering significantly with the laser light transmitted through the glass, and of course, any Raman signal subsequently generated. With brown glass being well known for its light filtering/absorption properties, it was perhaps not surprising that accurate detection of adulterants through this form of glass with 1064 nm excitation was unsuccessful using conventional Raman spectroscopy.43,44 An image of the empty commercial glass bottles and the averaged Raman spectra from three measurements of each of these empty glass bottles are shown in Fig. S6 and S7† respectively.
 | ||
| Fig. 4 PCA scores plots of the Raman spectral data collected through seven different commercial glass bottled spirits, containing various concentrations (0–5%) of methanol. Different colours indicate the level of added methanol in each of the samples: (a) gin, (b) vodka, (c) Irish whiskey, (d) American whiskey, (e) rum, (f) brandy, (g) gin. | ||
Conclusion
Here, for the first time using a conventional handheld Raman spectrometer with 1064 nm excitation, we have successfully demonstrated the potential of Raman spectroscopy, especially in its handheld form, for through-container applications in the area of spirit drink analysis. In addition, we have demonstrated the ability for through-container differentiation of several types of spirit drinks, detecting multiple adulterants in the form of denaturants and flavourings at extremely low concentrations, as well as quantifying levels of methanol. The LODs of methanol were between 0.23–0.39% and were not only considerably lower than the maximum tolerable concentration (MTC) of 2% (v/v) methanol for humans in a 40% alcohol by volume (ABV) spirit drink, but they were also lower than the EU general limit of 0.5% v/v (10 g methanol per L ethanol)45 for naturally occurring methanol in fruit spirits. Counterfeit alcohol and its detection is an important area economically, and with many socio-economic and health consequences it is a growing problem globally. This has been demonstrated and reinforced by the most recent global operation of Europol and Interpol targeting fake food and beverages where yet again, the largest reported seizures were of counterfeit alcohol (1.6 million litres), including product tainted with industrial alcohols such as methanol.46 Methanol is one of the most pernicious adulterants used by individuals or groups involved in the counterfeiting of food or drink.We believe that Raman spectroscopy has considerable practicable potential for the rapid through-container detection of counterfeit spirits drinks as well as other liquid samples. The use of 1064 nm has the advantage over other excitation wavelengths in that it is in the near infrared and so fluorescence contributions from glass containers is considerably reduced or eliminated. Moreover, these point-and-shoot methods26 also have inherently broader scope, not only when used as handheld and highly mobile devices. They could just as readily be applied to the authentication of other forms of food and drink,47,48 the measurement and monitoring of food/drink quality indicators, or the rapid detection of food waste or microbial spoilage (for shelf-life indication). In addition to applications such as on/at/in-line process control monitoring in busy and highly complex industrial settings, including those outside of food, feed or drink manufacture/processing.49
Conflicts of interest
There are no conflicts of interest to declare.Acknowledgements
RG and DIE thank the UK ESRC and UK FSA for funding (Food fraud: a supply network integrated systems analysis (grant number ES/M003183/1)). The SWRI contribution to this work has received funding from the European Union's Seventh Framework Programme for research, technological development and demonstration under grant agreement no. 613688.References
- spiritsEUROPE, A Spirit of Growth: Trade, http://spirits.eu/spirits/a-spirit-of-growth/premiumisation-of-spirits-sales, (accessed November 11, 2016).
- spiritsEUROPE, A Spirit of Growth: Jobs, http://spirits.eu/external-trade/key-data, (accessed November 11, 2016).
- D. S. Council, Distilled Spirits Council Reports Record Spirits Sales, https://www.distilledspirits.org/news/distilled-spirits-council-reports-record-spirits-sales/.
- D. I. Ellis, J. Ellis, H. Muhamadali, Y. Xu, A. B. Horn and R. Goodacre, Anal. Methods, 2016, 8, 5581–5586 RSC.
- N. Liu, H. Parra, A. Pustjens, K. Hettinga, P. Mongondry and S. van Ruth, Talanta, 2018, 184, 128–135 CrossRef CAS PubMed.
- R. I. Aylott, Analytical Strategies Supporting Protected Designations of Origin for Alcoholic Beverages, Elsevier B.V., 2013 Search PubMed.
- R. I. Aylott, J. Assoc. Public Anal., 1995, 31, 179–192 Search PubMed.
- R. I. Aylott and W. M. MacKenzie, J. Inst. Brew., 2010, 116, 215–229 CrossRef CAS.
- C. Fotakis and M. Zervou, Food Chem., 2016, 196, 760–768 CrossRef CAS.
- Y. B. Monakhova, T. Kuballa and D. W. Lachenmeier, Appl. Magn. Reson., 2012, 42, 343–352 CrossRef CAS.
- M. Heller, L. Vitali, M. A. L. Oliveira, A. C. O. Costa and G. A. Micke, J. Agric. Food Chem., 2011, 59, 6882–6888 CrossRef CAS PubMed.
- S. G. Ceballos-Magana, J. M. Jurado, R. Muniz-Valencia, A. Alcazar, F. de Pablos and M. J. Martin, Food Anal. Methods, 2012, 5, 260–265 CrossRef.
- J. S. Garcia, B. G. Vaz, Y. E. Corilo, C. F. Ramires, S. A. Saraiva, G. B. Sanvido, E. M. Schmidt, D. R. J. Maia, R. G. Cosso, J. J. Zacca and M. N. Eberlin, Food Res. Int., 2013, 51, 98–106 CrossRef CAS.
- J. K. S. Moller, R. R. Catharino and M. N. Eberlin, Analyst, 2005, 130, 890–897 RSC.
- J. A. R. Teodoro, H. V. Pereira, M. M. Sena, E. Piccin, J. J. Zacca and R. Augusti, Food Chem., 2017, 237, 1058–1064 CrossRef CAS PubMed.
- M. Stupak, V. Kocourek, I. Kolouchova and J. Hajslova, Food Control, 2017, 80, 307–313 CrossRef CAS.
- D. Gonzalez-Arjona, G. Lopez-Perez, V. Gonzalez-Gallero and A. G. Gonzalez, J. Agric. Food Chem., 2006, 54, 1982–1989 CrossRef CAS PubMed.
- R. Hogben and M. Mular, J. Sci. Food Agric., 1976, 27, 1108–1114 CrossRef CAS.
- P. Wisniewska, T. Dymerski, W. Wardencki and J. Namiesnik, J. Sci. Food Agric., 2015, 95, 2159–2166 CrossRef CAS PubMed.
- P. C. Ashok, G. P. Singh, K. M. Tan and K. Dholakia, Opt. Express, 2010, 18, 7642–7649 CrossRef CAS PubMed.
- J. Jaganathan and S. M. Dugar, J. AOAC Int., 1999, 82, 997–1001 CAS.
- C. Bauer-Christoph, N. Christoph, B. O. Aguilar-Cisneros, M. G. Lopez, E. Richling, A. Rossmann and P. Schreier, Eur. Food Res. Technol., 2003, 217, 438–443 CrossRef CAS.
- W. Meier-Augenstein, H. F. Kemp and S. M. L. Hardie, Food Chem., 2012, 133, 1070–1074 CrossRef CAS.
- F. Thomas, C. Randet, A. Gilbert, V. Silvestre, E. Jamin, S. Akoka, G. Remaud, N. Segebarth and C. Guillou, J. Agric. Food Chem., 2010, 58, 11580–11585 CrossRef CAS PubMed.
- W. M. MacKenzie and R. I. Aylott, Analyst, 2004, 129, 607–612 RSC.
- D. I. Ellis, H. Muhamadali, S. A. Haughey, C. T. Elliott and R. Goodacre, Anal. Methods, 2015, 7, 9401–9414 RSC.
- L. Rodriguez-Saona, M. M. Giusti and M. Shotts, in Advances in Food Authenticity Testing, ed. G. Downey, Woodhead, Duxford, UK, 2016 Search PubMed.
- M. A. Cantarelli, S. M. Azcarate, M. Savio, E. J. Marchevsky and J. M. Camia, Food Anal. Methods, 2015, 8, 790–798 CrossRef.
- U. Contreras, O. Barbosa-Garcia, J. L. Pichardo-Molina, G. Ramos-Ortiz, J. L. Maldonado, M. A. Meneses-Nava, N. E. Ornelas-Soto and P. L. Lopez-de-Alba, Food Res. Int., 2010, 43, 2356–2362 CrossRef CAS.
- S. S. Bozkurt, E. Merdivan and Y. Benibol, Microchim. Acta, 2010, 168, 141–145 CrossRef CAS.
- A. C. McIntyre, M. L. Bilyk, A. Nordon, G. Colquhoun and D. Littlejohn, Anal. Chim. Acta, 2011, 690, 228–233 CrossRef CAS PubMed.
- P. C. Ashok, G. P. Singh, H. A. Rendall, T. F. Krauss and K. Dholakia, Lab Chip, 2011, 11, 1262–1270 RSC.
- A. Nordon, A. Mills, R. T. Burn, F. M. Cusick and D. Littlejohn, Anal. Chim. Acta, 2005, 548, 148–158 CrossRef CAS.
- J. Kiefer and A. L. Cromwell, Anal. Methods, 2017, 9, 511–518 RSC.
- D. I. Ellis, R. Eccles, Y. Xu, J. Griffen, H. Muhamadali, P. Matousek, I. Goodall and R. Goodacre, Sci. Rep., 2017, 7, 12082 CrossRef.
- P. C. Ashok, B. B. Praveen and K. Dholakia, J. Raman Spectrosc., 2013, 44, 795–797 CrossRef CAS.
- C. D. Newman, G. G. Bret and R. L. McCreery, Appl. Spectrosc., 1992, 46, 262–265 CrossRef CAS.
- D. Cleveland, M. Carlson, E. D. Hudspeth, L. E. Quattrochi, K. L. Batchler, S. A. Balram, S. Hong and R. G. Michel, Spectrosc. Lett., 2007, 40, 903–924 CrossRef CAS.
- C. L. Sanford, B. A. Mantooth and B. T. Jones, J. Chem. Educ., 2001, 78, 1221–1225 CrossRef CAS.
- I. H. Boyaci, H. E. Genis, B. Guven, U. Tamer and N. Alper, J. Raman Spectrosc., 2012, 43, 1171–1176 CrossRef CAS.
- M. Blanco, M. Castillo, A. Peinado and R. Beneyto, Anal. Chim. Acta, 2007, 581, 318–323 CrossRef CAS PubMed.
- E. D. Lund, C. L. Kirkland and P. E. Shaw, J. Agric. Food Chem., 1981, 29, 361–366 CrossRef CAS.
- F. R. Bacon and C. J. Billian, J. Am. Ceram. Soc., 1954, 37, 60–66 CrossRef CAS.
- M. M. Morsi, S. I. El-sherbiny and K. M. Mohamed, Spectrochim. Acta, Part A, 2015, 145, 376–383 CrossRef CAS PubMed.
- A. J. Paine and A. D. Dayan, Hum. Exp. Toxicol., 2001, 20, 563–568 CrossRef CAS PubMed.
- Interpol, Deadly and dangerous fake food and drink seized in global operation, https://www.interpol.int/en/News-and-media/News/2018/N2018-033.
- L. Mandrile, G. Zeppa, A. M. Giovannozzi and A. M. Rossi, Food Chem., 2016, 211, 260–267 CrossRef CAS PubMed.
- P. I. C. Richardson, H. Muhamadali, D. I. Ellis and R. Goodacre, Food Chem., 2019, 272, 157–164 CrossRef CAS PubMed.
- Z. Li, M. J. Deen, S. Kumar and P. R. Selvaganapathy, Sensors, 2014, 14, 17275–17303 CrossRef PubMed.
Footnote |
| † Electronic supplementary information (ESI) available. See DOI: 10.1039/c8an01702f |
| This journal is © The Royal Society of Chemistry 2019 |