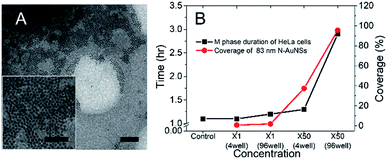
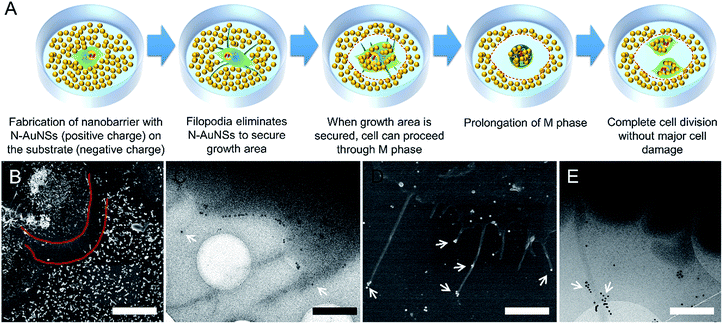
 Open Access Article
Biophysical restriction of growth area using a monodispersed gold sphere nanobarrier prolongs the mitotic phase in HeLa cells†
Dae-Woong Jung‡
ad,
Hyun-Joo Ro‡abc,
Junmin Kimad,
Seung Il Kimabc,
Gi-Ra Yi d,
Gaehang Lee
 *a and
Sangmi Jun*abc
aKorea Basic Science Institute, Daejeon, 34133, Republic of Korea. E-mail: ghlee@kbsi.re.kr; smjun@kbsi.re.kr
bConvergent Research Center for Emerging Virus Infection, Korea Research Institute of Chemical Technology, Daejeon, 34114, Republic of Korea
cBio-Analytical Science, University of Science & Technology, Daejeon, 34113, Republic of Korea
dDepartment of Chemical Engineering, Sungkyunkwan University, Suwon, 16419, Republic of Korea
First published on 18th November 2019
Abstract
Gold nanoparticles are widely exploited for biological and biotechnical applications owing to their stability, biocompatibility, and known effects on cellular behaviors. Many studies have focused on nanoparticles that are internalized into cells, but extracellular nanoparticles also can regulate cell behavior, a practice known as in-plane surface nanotopography. We demonstrated that nanobarriers composed of morphologically homogeneous gold nanospheres prolonged the mitotic (M) phase in the cervical cancer cell line HeLa without inducing apoptosis. The nanobarrier was formed by electrostatic deposition of nanospheres on a negatively charged, fibronectin-coated substrate. We tested the effects of differently sized nanospheres. Gold nanospheres 42 nm in diameter were found to be non-toxic, while 111 nm nanospheres induced the production of reactive oxygen species, resulting in apoptotic cell death and arrest of cytokinesis. When exposed to sufficient 83 nm gold nanospheres to fabricate a surface nanobarrier, the M phase was delayed but cells proceeded to cytokinesis and the G1 phase. Live-cell imaging showed that the M phase increased by 2.9 h, 2.4 times longer than in control cells. Biophysical analyses indicated that this could be attributed to the specific size of the nanobarrier that physically limited the growth area around the cell.
Introduction
The use of gold nanoparticles (AuNPs) in biomedical and biotechnical applications1–3 has been a subject of increasing attention, given their unique biocompatibility,4 low cytotoxic effects,5 stability, easy functionalization as platforms for molecular conjugation,6 and efficiency as drug delivery agents.7 Several in vivo and in vitro studies have elucidated numerous AuNP parameters, including size,8 shape,1 concentration,9 and surface chemistry,10 that affect cellular uptake and cytotoxicity. Their biological effects include regulation of cell proliferation by cell-cycle arrest and apoptosis induction mediated by nanotoxicity.11,12Most nanoparticle-based studies focus primarily on cellular cues induced by their internalization, with considerably less emphasis on extracellular cues.13,14 Intercellular AuNPs are used in biomedical applications including drug delivery15 and sensing of target molecules16 by actively interacting with cellular components. The consequences of these interactions then change the regulation of cell behavior. Nanomaterials surrounding cells constitute an artificial extracellular matrix, providing a combination of external chemical, physical, mechanical, and biological factors that can influence cell behavior.17 AuNPs are the most commonly used components for in-plane nanotopography;17–19 the characteristics of cell surface nanotopography result in multiple cellular responses including locomotion,20 spreading,21 differentiation,22 adhesion,23 and cell-cycle progression.24
The cell cycle is universally critical for the development, survival, and reproduction of all organisms. Specifically, the M phase involves dramatic changes in multiple cellular structures, leading to nuclear (mitosis) and cytoplasmic (cytokinesis) division.25 Therefore, M-phase control is the focus of intense interest in cancer26 and longevity27 research. Conventionally, delays in the cell cycle caused by a chemical treatment could be interpreted as a response to the modulation of a cell-cycle regulator or delaying the assembly of the mitotic spindle, resulting in an incomplete cell cycle process, such as DNA replication or chromosome alignment.28,29 However, this also causes unintended damage, such as apoptosis,28 which interrupts the goal of the study. Advanced methods or new technological platforms are required to modulate cell-cycle progression without causing such damage.
Herein, we demonstrate a novel strategy to prolong the M phase in the cervical cancer cell line HeLa, without nuclear DNA damage. The procedure was realized using a nanobarrier with highly spherical and monodispersed gold nanospheres electrostatically attached to a fibronectin-coated substrate. Cells were imaged for 24 h to determine their biological responses to the external physical stimuli produced by in-plane nanotopography, as well as to nanoparticle internalization of spheres with 42, 83, and 111 nm diameters. The effects of the nanobarriers on cells were particle size dependent. External nanobarriers made with 83 nm spheres physically retarded cell movement, preventing cells from securing a sufficient growth area, inducing an increase in the mean duration of the M phase and delaying the cell cycle.
Materials and methods
Materials
Ethylene glycol (EG, anhydrous, 99.8%), gold(III) chloride trihydrate (49.0% metals basis), poly(dimethyldiallylammonium chloride) (polyDADMAC, molecular weight 400–500 kDa, 20 wt% in H2O), phosphoric acid (H3PO4, 85 wt% in H2O), poly-L-lysine (0.1% in H2O), and fibronectin (Bioreagent, 0.1% in H2O) were purchased from Sigma-Aldrich (USA). Amine–polyethylene glycol–thiol (NH2–PEG–SH, 10k) was prepared by Creative PEGworks (USA). HeLa cells (human adenocarcinoma cells originating from the cervix, #CCL-2) were purchased from the American Type Culture Collection (USA).Preparation of N-AuNSs
We modified the synthesis process outlined in a previous report to better control AuNS size.30 PolyDADMAC (8.0, 9.1, and 10.0 g), H3PO4 solution (16 mL, 1 M), and EG (400 mL) were mixed in a 1 L glass bottle at room temperature. HAuCl4 solution (0.4 mL, 0.5 M) was added to the mixture. The bottle was incubated at 190 °C without stirring for 3 h. To etch octahedral Au particles into nanospheres, HAuCl4 solution (0.1 mL, 0.5 M) was added to the cooled suspension, followed by vigorous stirring at 25 °C for 24 h. Centrifugation at 50![[thin space (1/6-em)]](https://www.rsc.org/images/entities/char_2009.gif) 000 g (Supra 30k, Hanil, Republic of Korea) for 2 h and repeated washing with ethanol yielded spherical AuNSs. For surface modifications on the AuNSs, NH2–PEG–SH solution (3 mL, 1 mM) was added to 1 mL of 1.0 × 10¹⁰ NSs per mL aqueous suspension. The mixture was stored at 30 °C for 6 days. N-AuNSs were separated from the resultant suspension by centrifugation and purified by washing with water.
000 g (Supra 30k, Hanil, Republic of Korea) for 2 h and repeated washing with ethanol yielded spherical AuNSs. For surface modifications on the AuNSs, NH2–PEG–SH solution (3 mL, 1 mM) was added to 1 mL of 1.0 × 10¹⁰ NSs per mL aqueous suspension. The mixture was stored at 30 °C for 6 days. N-AuNSs were separated from the resultant suspension by centrifugation and purified by washing with water.
Measurement of the number of NH2 groups on the N-AuNS surface
The UV/visible absorbance of the amine-reactive fluorescein isothiocyanate (FITC) fluorescent dye was measured at concentrations of 100, 50, 10, 5, 1, and 0.5 μM in ethanol. Each maximum absorbance was fitted to a GaussAmp curve using Origin 8.0 software (Fig. S1A†) (1) and plotted using eqn (1):
 | (1) |
Primary characterization of N-AuNSs by TEM
Nanoparticles dispersed in water were placed on a copper 200-mesh grid (Electron Microscopy Sciences, USA) and examined by ultra-corrected energy filtering transmission electron microscopy (UC-EF-TEM), ZEISS Libra with 200 kV (ZEISS, Germany). The microscope was equipped with a high-tilted goniometer, a monochromator (CEOS, Germany), an image Cs-corrector (CEOS, Germany), and a side CCD camera (ORIUS SC200D, Gatan, USA).Cell culture
HeLa cells were cultured in Dulbecco's modified Eagle's medium supplemented with 10% fetal bovine serum and 1% 100× antibiotic–antimycotic solution (Gibco-BRL, USA). Cells were seeded in 4-chamber glass-bottom dishes and 96-well cell culture plates (Matek Corporation, USA) pre-coated with human fibronectin solution or poly-L-lysine solution (Sigma-Aldrich, USA). Cells were incubated in a humidified incubator at 37 °C with 5% CO2 and passaged at 80–90% confluence. For each experiment, cells cultured in medium without N-AuNSs were used as controls. The cells were seeded 24 h prior to AuNS exposure at a density of 5.0 × 10³ per well in the 96-well plates and 2.0 × 10⁴ per chamber in the 4-chamber dish, aiming to reach 70% confluence.Cell proliferation assay
Cell proliferation was assessed using a cholecystokinin (CCK)-8 assay (Dojindo Molecular Technologies, USA), according to the manufacturer's instructions. Cells were seeded in transparent 96-well plates and exposed to the 42, 83, and 111 nm N-AuNS dispersions at 4.2 × 10⁷, 2.1 × 10⁹, 4.2 × 10⁹, and 8.4 × 10⁹ NSs per mL for 24 h. Next, CCK-8 (10 μL) reagent was added to each well and incubated for 3 h at 37 °C with 5% CO2. After incubation, absorbance at 450 nm was measured using a Synergy H1 Hybrid Multi-Mode Reader (BioTek, USA).Flow cytometry for cell cycle analysis
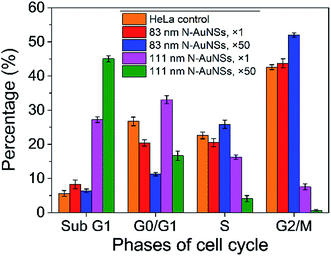
The distribution of cells in each phase of the cell cycle was studied using a propidium iodide flow cytometry kit (Abcam, USA). Approximately 3.0 × 10⁵ cells per well were seeded in 96-well plates and exposed to 83 nm and 111 nm N-AuNSs at 4.2 × 10⁷ and 2.1 × 10⁹ NSs per mL for 24 h. Cells were harvested and centrifuged at 120 g for 3 min. According to the manufacturer's instructions, the pellet was fixed in 66% ethanol and stored at 4 °C for 2 h. The fixed cells were rehydrated in PBS, then stained with propidium iodide and RNase for 30 min. The stained cells were then analyzed using a flow cytometer with the propidium iodide fluorescence intensity set to FL2 and 488 nm laser excitation with maxima for excitation 493 nm and emission 636 nm. Total 5 trials of cell cycle analysis were conducted and their average value with standard deviation represented in Fig. 5.Cell morphology, live-cell imaging, and measurement of mitochondrial ROS
HeLa cells in 96-well culture plates (200 μL of aqueous mixture of N-AuNSs and cell culture media) exposed to 4.2 × 10⁷ and 2.1 × 10⁹ NSs per mL of 42, 83, and 111 nm N-AuNSs and the equivalent ratio of nanoparticles per cells were applied in a 4-chamber dish (800 μL of aqueous mixture of N-AuNSs and cell culture media). Cells were imaged on an Olympus IX71 inverted microscope (40× magnification) equipped with a fully automated 96-well plate Chamlide stage-top incubator (Live Cell Instrument, Republic of Korea) for 24 h. Cells were maintained at 37 °C in a humidified atmosphere of 5% CO2 throughout the experiment. Time-lapse images were acquired as 20–25 z-sections at 1 h intervals for each position. Stage displacement and image acquisition were controlled through MetaMorph (Universal Imaging, USA). For measurement of M phase duration, approximately 10 cells were picked per 1 h time-lapse image series, so the average value is represented in 1 h units. The videos were made from 1 h interval time-lapse images captured over a 22 h period.Mitochondrial reactive oxygen species (ROS) were detected using the MitoSOX™ Red mitochondrial superoxide indicator (Life Technologies, USA). Cells were seeded in 96-well plates and exposed to 4.2 × 10⁷ and 2.1 × 10⁹ NSs per mL of 83 and 111 nm N-AuNSs for 24 h. Cells treated with a common ROS inducer, tert-butyl hydroperoxide (TBHP), were used as a positive control (Fig. S2†). Cells were stained with NucBlue Live ReadyProbes Reagent (Invitrogen, Eugene, OR) and MitoSOX Red, according to the manufacturer's instructions, to detect nuclei and mitochondrial ROS, respectively. An Olympus IX71 inverted microscope (40× magnification) was used to image fluorescence with excitation and emission wavelengths of 405 and 460 nm for NucBlue, and 510 and 580 nm for MitoSOX Red.
Cellular uptake of N-AuNSs visualized by cryo-EM and TEM
Cells were ready to be examined by cryo-electron microscopy (cryo-EM) and TEM after 24 h of incubation with N-AuNSs. Plunge-freezing of HeLa cells cultured on fibronectin-coated R 2/2 Quantifoil gold EM finder grids (Electron Microscopy Sciences, USA) for cryo-EM was performed as described.31,32 Frozen grids were viewed under the FEI Tecnai G2 Spirit twin (FEI) at 120 kV in cryo-conditions.Pelleted cells were prepared for TEM as described.33,34 Ultrathin sections were cut using a Leica ultramicrotome (Leica, Austria) and post-stained with uranyl acetate and lead citrate. The grid was viewed under a Zeiss LEO912AB TEM (Carl Zeiss, Germany) at an accelerating voltage of 120 kV.
Results and discussion
Synthesis and characterization of gold nanospheres
A previous study reported a 35 nm depth threshold for nanotopographic patterns to influence cell behavior.35 It has been shown that the optimum size for AuNPs to enable accumulation on tumor tissues is 50–100 nm.36 Therefore, we chose 42, 83, and 111 nm-wide, highly spherical, and monodispersed AuNSs to investigate the dependence of size on their biological effects. Often, AuNPs coated with stabilizers, including cetyl trimethyl ammonium bromide,37 tiopronin,38 fetal bovine serum,39 poly(methacrylic acid),40 or polystyrene sulfonase,41 are toxic to cells because of free molecules detaching from the AuNPs. Hence, we modified the initial AuNS surfaces with NH2–PEG–SH; the PEG chain improves the dispersion of the AuNSs in buffer solution, and the NH2 group gives it a positive charge by ionization,42 enhancing interactions between the AuNSs and cells.As shown by TEM of the NH2–PEG-modified AuNSs (N-AuNSs) in Fig. 1A–C, all were ultra-smooth, highly spherical, and size-monodispersed. In several images, 100 particles were measured with ImageJ software. In Fig. 1D, the size distributions of N-AuNSs with 42 ± 1.4, 83 ± 2.1, and 111 ± 2.4 nm diameters are shown. The highly monodispersed shape and size assist in measurement of size-dependent cellular responses without the interference caused by heterogeneous shapes. To calculate the concentration of the N-AuNSs stock solution, the absorbance in Fig. 1E was substituted into the Beer–Lambert equation with the extinction coefficient corresponding to the size indicated in a previous report.43 Each AuNS solution for the experiment was prepared to concentrations of 4.2 × 10⁷ (×1), 2.1 × 10⁹ (×50), 4.2 × 10⁹ (×100), and 8.4 × 10⁹ (×200) NSs per mL by adding the necessary volume of cell culture medium into the stock solution (Table S2†).
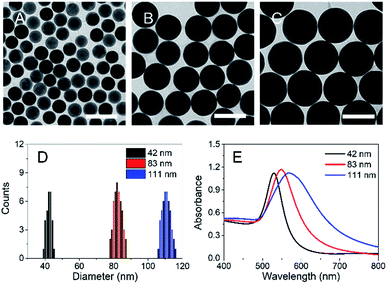 | ||
| Fig. 1 Characterization of N-AuNSs. TEM images of N-AuNSs at (A) 42, (B) 83, and (C) 111 nm. Scale bars, 100 nm. (D) Size distribution and (E) UV/Vis absorption spectra of N-AuNSs. | ||
Effect of coating substrates on the in vitro cellular behavior of N-AuNSs
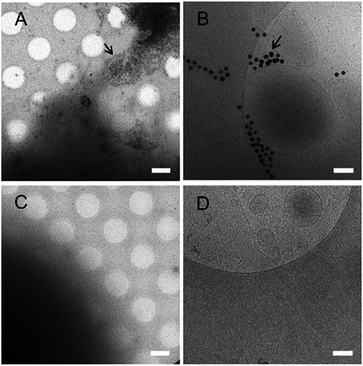
We examined the in vitro behavior of N-AuNSs through electrostatic interactions with two oppositely charged cell culture coating substrates, fibronectin44 and poly-L-lysine,45 commonly used to promote cell attachment. Cells were plated onto fibronectin- and poly-L-lysine-coated EM gold grids and exposed to N-AuNSs. As observed in cryo-EM images (Fig. 2A and B), the N-AuNSs adhered to the fibronectin-coated surface and cultured cells concurrently, with active cellular interaction. In contrast, the N-AuNSs were hardly seen on the poly-L-lysine-coated surface or cells (Fig. 2C and D).The fibronectin-coated EM grid facilitates N-AuNS interactions with cells because the positively charged AuNSs generally have a high affinity to the cells on the negatively charged fibronectin, inducing higher cellular uptake of N-AuNSs. In addition, N-AuNSs attached to the fibronectin-coated substrate produced heterogeneous colloidal nanotopographic features such as barriers within the extracellular space surrounding the HeLa cells. Thus, the surface charge of the coating substrates affects the cellular uptake of N-AuNSs and fibronectin can be utilized as an adequate coating reagent with N-AuNSs to produce in-plane nanobarriers for investigating HeLa cell behavior in response to the extracellular biophysical cues and physicochemical properties of N-AuNSs. In further experiments, we used HeLa cells cultured in fibronectin-coated 96-well culture plates.
Effect of N-AuNSs on cell proliferation
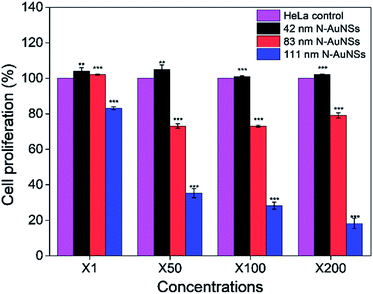
The size- and concentration-dependent cytotoxicity of N-AuNSs was evaluated using a CCK-8 cell proliferation assay. HeLa cells were cultured on fibronectin-coated 96-well culture plates and exposed to 42, 83, and 111 nm N-AuNSs in increasing concentrations of ×1, ×50, ×100, and ×200 for 24 h, since the cell-cycle duration of HeLa cells is approximately 22 h.46 In this assay, 42 nm N-AuNSs showed no significant influence on cell proliferation, independent of concentration (Fig. 3, black bar). The proliferation rate of cells exposed to 83 nm N-AuNSs seemed to be unaffected at concentrations of ×1. However, at 50-fold higher concentrations cell proliferation decreased slightly, ranging from 73% to 79% (Fig. 3, red bar). The presence of 111 nm N-AuNSs, dramatically decreased cell proliferation in a concentration-dependent manner (Fig. 3, blue bar).Cell proliferation is determined by the cycling behavior of cells, such as the speed of the cell cycle and the growth fraction (the population of actively cycling cells).47 Therefore, decreased cell proliferation may indicate delayed cell cycles or increased apoptosis. Overall, the cell proliferation rate seemed to be reduced in a size- and concentration-dependent manner only by 111 nm N-AuNSs (Fig. 3). Notably, a concentration of ×50 was the inflection point at which significant changes in cell proliferation were detected for both 83 and 111 nm N-AuNSs (Table S3†). Therefore, for closer investigation into the causes of this decreased cell proliferation, cells exposed to 42, 83, and 111 nm N-AuNSs at concentrations of ×1 and ×50, were examined.
Cellular uptake of N-AuNSs in HeLa cells
Bright-field optical microscopy images revealed the morphology of HeLa cells after 24 h of incubation with N-AuNSs. There were no differences in the number of cells among the control (untreated), 42, 83, or 111 nm spheres at a concentration of ×1 (Fig. S3A–D†). In contrast, similar to the cell proliferation results (Fig. 3), at a concentration of ×50, decreases in cell numbers were observed for the 83 and 111 nm N-AuNSs (Fig. S3G and H†), relative to the control and 42 nm N-AuNSs-treated cells (Fig. S3E and F†). As described above, N-AuNSs assemble on the fibronectin-coated substrate due to electrostatic attraction, forming a colloidal nanobarrier in the extracellular space. At a concentration of ×1, the nanobarriers composed of 42 and 83 nm N-AuNSs were not observed (Fig. S3B and C†), and few 111 nm N-AuNS clusters visible extracellularly (Fig. S3D†). At a concentration of ×50, a clear colloidal nanobarrier was seen, although the nanotopographical density was very low for the 42 nm N-AuNSs (Fig. S3F†). A denser nanobarrier was formed by 111 nm than 83 nm N-AuNSs (Fig. S3G and H†). As the ×50 concentration 83 nm and 111 nm N-AuNSs-treated HeLa cells showed decreased proliferation rates, the nanobarrier might participate in the regulation of cell proliferation.Cellular uptake and the precise localization of N-AuNSs were investigated by TEM. In previous reports, the cellular uptake of ∼50 nm AuNSs was noted as the most efficient.8,48,49 However, in our case, all three sizes were internalized and localized in cytoplasmic vesicles (most likely endosomes or lysosomes) within 24 h, showing that the particle size does not affect the cellular uptake of N-AuNSs under our experimental conditions (Fig. S4†). Penetration of N-AuNSs into nuclei was not observed; therefore, DNA damage induced by nuclear internalization of nanoparticles is unlikely to contribute to decreased cell proliferation. Moreover, the sizes of the particle-loaded vesicles seemed to increase with increasing N-AuNS size. Fig. S4H† shows endosomes up to 1 μm in diameter. Increases in endosomal size enhance endosomal escape;50 therefore, it might be important to know that endosomes are generated according to nanoparticle size for efficient drug delivery systems.
Cell cycle regulation by N-AuNSs
As shown in Fig. 3, the cell proliferation assay results for HeLa cells exposed to N-AuNSs at a concentration of ×50 and ×1 showed no difference for the 42 nm N-AuNSs, but displayed approximately 73% and 35% less proliferation at ×50 for the 83 nm and 111 nm N-AuNSs, respectively. To evaluate cell cycle arrest, which influences the rate of cell proliferation, live-cell imaging of HeLa cells exposed to 42, 83, and 111 nm N-AuNSs at concentrations of ×1 and ×50 was performed for 24 h. The first six images, taken at 1 h intervals, of the ×50 concentration treatments are displayed in Fig. 4 (Video S1–S4†). This imaging revealed that the fabrication of the nanobarrier with N-AuNSs occurs very quickly; N-AuNSs sedimentation reached its saturation point within the first hour of exposure (Fig. 4; Video S2–S4†).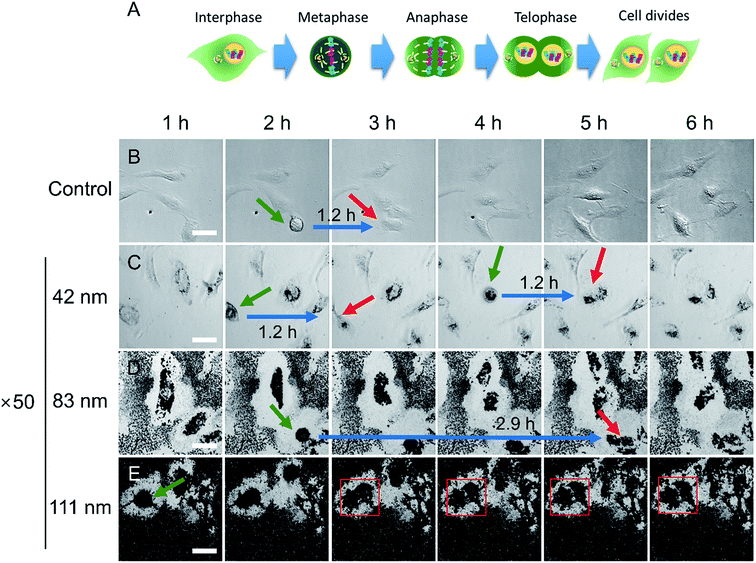 | ||
| Fig. 4 (A) Schematic illustration of the M phase of the cell cycle. Time-lapse snapshots of (B) control and cells exposed to (C) 42, (D) 83, and (E) 111 nm N-AuNSs at ×50 (refer to Videos S1–S4,† respectively). The time points corresponding to each snapshot are indicated in the first row. Green arrows indicate the start point of metaphase and red arrows indicate the end point of telophase. The red square indicates cytokinesis arrest. Blue arrows indicate the times taken for M phase. Scale bar, 50 μm. | ||
A typical cell cycle consists of G1, S, G2, and M phases.25 Here, we focused on M phase, in which dynamic changes in cell morphology, such as cell rounding, and the final physical cell division (cytokinesis) are observed.51 M phase is divided into a series of shorter phases including metaphase and telophase (Fig. 4A). In metaphase, the cells undergo mitotic cell rounding and in telophase, the cleavage furrow begins to form.51 In this study, by setting metaphase (green arrow) as a start-point and telophase (red arrow) as an endpoint, the duration of the M phase was measured to assess cell-cycle transit time (Fig. 4B–E).
The M-phase durations of control cells and cells treated with 42 nm N-AuNSs at ×50 concentration were identical at 1.2 h. However, the M-phase duration of cells incubated with 83 nm N-AuNSs was 2.4 times more than that of control and the 42 nm N-AuNS-treated cells. Despite a prolonged M phase, mitosis and cytokinesis were completed (Video S3†); the cells-initiated cytokinesis with mitotic cell rounding, followed by contractile ring constriction, concomitant cleavage furrow ingression, the extension of a cytoplasmic bridge linking the two daughter cells, and finally, complete abscission. In contrast, cytokinesis arrest was observed in cells incubated with 111 nm N-AuNSs (Fig. 4E); cytokinesis began with mitotic cell rounding, but the extension of the cytoplasmic bridge did not occur (red square), and daughter cells did not separate over 24 h. At a concentration of ×50, it is likely that 83 nm N-AuNSs slowed the M phase of the cell cycle, while 111 nm N-AuNSs inhibited cells from completing cell division.
To further investigate the arrest of cytokinesis, cell-cycle analyses on cells exposed to 83 nm and 111 nm N-AuNSs at ×1 and ×50 were performed using flow cytometry (Fig. 5). The cell-cycle stage distribution of control cells was comparable to that of cells exposed to 83 nm N-AuNSs at a concentration of ×1. At a concentration of ×50, 83 nm N-AuNSs increased the percentage of cells in G2/M phase. G2/M-phase arrest induced by AuNPs has been observed in conjunction with high cytotoxicity, suggested by high levels of ROS.40,52 Moreover, cell-cycle arrest can occur temporarily for maintenance purposes to dissipate an exogenous cellular stress signal, to repair cellular damage, or to provide essential growth factors.53 In the presence of 83 nm N-AuNSs at ×50, a low sub-G1 cell population (apoptotic cells) was observed, suggesting that the process of cell division had been slowed, but did not lead to apoptosis (Fig. 5).
Cytokinesis arrest could result in apoptosis.54,55 Flow cytometry showed that the sub-G1-phase population increased with increasing concentration in the presence of 111 nm N-AuNSs (Fig. 5). These size- and concentration-dependent characteristics of 111 nm N-AuNS-induced apoptosis were similar to the decreasing proliferation rates of cells treated with 111 nm N-AuNSs (Fig. 3). At concentrations of ×50, it is obvious that 111 nm N-AuNSs caused cytokinesis arrest in HeLa cells (Fig. 4E), leading to apoptotic cell death (Video S5†) and decreasing cell proliferation.
Mitochondrial ROS generation induced by N-AuNSs
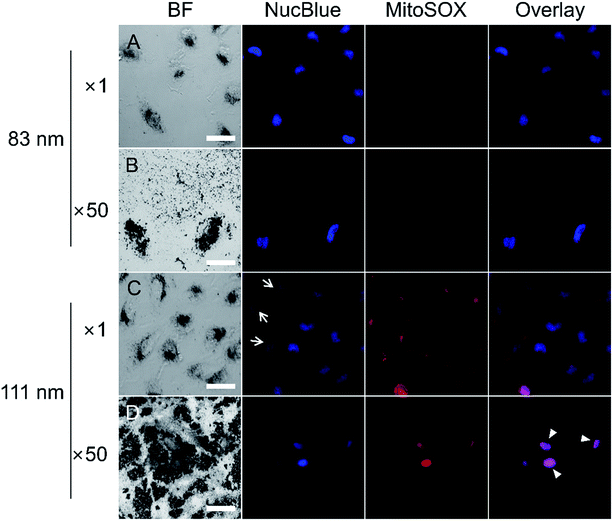
Most cell damage in AuNPs studies has been attributed to induced ROS modulating cellular processes including cell proliferation, cell cycle progression, cell death, cell cycle arrest, and alterations in apoptosis.12,40 The AuNSs used in our experiment were surface-modified with NH2–PEG, whose amine group had been previously shown to damage mitochondria.56 As mitochondria are the major source of cellular ROS,57 evaluation of cytotoxicity caused by the amine group was focused on mitochondrial ROS production. To determine whether ROS generation and DNA damage were caused by the functional group of the N-AuNSs, fluorescence assays with NucBlue and MitoSOX reagents were performed on cells treated with 83 and 111 nm N-AuNSs at concentrations of ×1 and ×50. As shown in the optical images in Fig. 6A and B, cells exposed to 83 nm N-AuNSs exhibited intact and homogenous cell nuclei stained by NucBlue, indicating no nuclear DNA damage. Among cells exposed to 111 nm N-AuNSs, a few showed lower signal intensities than others (arrows in Fig. 6C) or no NucBlue signal (Fig. 6D). This suggests that DNA degradation might be in progress, inducing apoptosis.58 The nuclei exhibited a purple color in the overlay image (arrowheads in Fig. 6D) due to nuclear staining by MitoSOX, indicating a loss of mitochondrial structure or membrane potential in dying cells.59 In accordance with the NucBlue results, the MitoSOX signal, which is induced by mitochondrial ROS, was detected only in cells exposed to the 111 nm N-AuNSs at both concentrations. Moreover, in the TEM image shown in Fig. S5,† enlarged lysosomes and accumulation of autophagosomes were seen with 111 nm N-AuNSs; these are cellular defense mechanisms against oxidative stress.34 Finally, to evaluate the inductive relationship between the functional amine group and ROS generation, the number of amine groups on the 83 and 111 nm N-AuNS surfaces were calculated from a GaussAmp curve of fluorescein isothiocyanate (FITC) solution. As shown in Table S1,† the numbers of PEG molecules on the 83 and 111 nm N-AuNS surfaces were measured to 2.62 × 10³ and 4.73 × 10³ PEG/AuNS, respectively, similar to the reported number of PEG molecules on similar-sized AuNPs.60Despite the fact that the number of amine groups on the 83 nm N-AuNSs at ×50 was 2.3 × 10⁸ times higher than that on the 111 nm N-AuNSs at ×1 (Table S1†), mitochondrial ROS was not detected with 83 nm N-AuNSs at ×50. Based on the association between the amine number and dye signal, we could conclude that the amine group is irrelevant to ROS production, but that 111 nm N-AuNSs play a significant role in ROS production, consequently inducing apoptosis.
Biophysical effects of N-AuNS nanobarriers on HeLa cells
Because 83 nm N-AuNSs were irrelevant to ROS generation, it was necessary to further investigate what factors influenced cell-cycle prolongation. Some studies have reported that physical restriction of cell movement, such as a hydrogel 3D cell culture or nanotopography, can influence the cell cycle.24,61–63 Therefore, we focused on physical interactions between the cells and the nanobarriers. We repeated the live cell imaging of HeLa cells with 42 and 83 nm N-AuNSs under the same conditions as above, but in 4-chamber dishes. As the 298 mm2 bottom surface area of a chamber in a 4-chamber dish is approximately 10 times larger than that of a well in a 96-well plate, it results in a more sparse nanobarrier (Fig. S6†). The M-phase duration of the cells cultured in the 4-chamber dishes with 42 nm N-AuNSs at ×1 and ×50 and 83 nm N-AuNSs at ×1 was 1.1 h, similar to the time in the 96-well plate. However, the mean duration of the M phase with 83 nm N-AuNSs at ×50 was 1.3 h, much shorter than the 2.9 h observed under the same conditions in the 96-well plate, but slightly longer than that of the other conditions in the chamber. In this experiment, the only difference in the environment was the surface area of the cell-culture wells. Therefore, we calculated the coverage of N-AuNSs on the plates to elucidate the role of N-AuNSs in the external space around the cells.In calculating N-AuNSs coverage, we confirmed two factors from the TEM image in Fig. 7; (1) the N-AuNSs are randomly distributed and (2) they form a monolayer. The coverage of N-AuNSs on the bottom of the cell culture plate was calculated (eqn (2)) (2) by dividing the total cross-sectional area of the N-AuNSs by the bottom area of the cell culture plate and the random packing fraction:
 | (2) |
When using 42 nm N-AuNSs, cell proliferation was similarly maintained even at ×200 in the 96-well plates (Fig. S7C†), although the coverage was 98%, larger than that of the 83 nm N-AuNSs at ×50 (95%). Despite the higher coverage, the constant length of the M phase indicates that a specific nanoparticle size causes to phase arrest. Nanostructured surfaces have been reported to regulate multiple cell responses including cell locomotion,20 spreading,21 differentiation,22 adhesion,23 and cell cycle progression.24 Interestingly, this study revealed a novel effect of AuNSs through electrostatic deposition of positively charged N-AuNSs on a oppositely charged substrate; 42 nm N-AuNSs had no effect on the cell cycle at any concentration, 83 nm N-AuNSs increased the duration of M phase to 2.4 times higher than that of control cells, and 111 nm N-AuNSs drove HeLa cells to apoptosis even at ×1 concentrations.
Conclusions
We have demonstrated particle size- and concentration-dependent effects of an engineered nanobarrier on the proliferation of HeLa cells cultured on a fibronectin-coated substrate. The nanobarrier was made up of AuNSs, which allowed the experimental results to be interpreted with respect to only particle size and concentration. The NH2–PEG–SH on the AuNSs led to electrostatic deposition on the fibronectin-coated substrate and active interaction with cells. During cellular uptake, the size of the N-AuNSs-loaded endocytic vesicles increased with both increasing particle concentration and size. The cytotoxicity assessment showed changes in the proliferation of HeLa cells caused by N-AuNSs. The physicochemical and biophysical assays indicated that 111 nm N-AuNSs induced ROS generation, cytokinesis arrest, and apoptosis in HeLa cells. Meanwhile, a dense nanobarrier composed of 83 nm N-AuNSs on the substrate physically restricted the growth area around the cell and induced a prolonged M phase without inducing apoptosis or ROS production. This indicates that the specific nanoparticle size served as a suitable nanobarrier leading to cell-cycle phase arrest. Our results suggest that using N-AuNSs and fibronectin-coated substrates is an easy and inexpensive way to fabricate colloidal nanobarriers for biological investigations, and this could be a novel biotechnical platform to adjust cell cycle progression without causing unintended damage, such as apoptosis, which may interrupt the goal of the study. Furthermore, despite our results were limited in in vitro experiment, future experiment on in vivo application of N-AuNSs to test their efficiency in cancer study could expect interesting effect of gold nanoparticles including NanoEL effect.69–71Conflicts of interest
There are no conflicts to declare.Acknowledgements
This work was supported by the Korea Basic Science Institute Fund (D39614) and a National Research Council of Science & Technology grant from the Korean government (CRC-16-01-KRICT) and the National Research Foundation of Korea (NRF-2014M3A9B8023471).Notes and references
- R. Toy, P. M. Peiris, K. B. Ghaghada and E. Karathanasis, Nanomedicine, 2014, 9, 121–134 CrossRef CAS PubMed.
- A. J. Cobley, T. J. Mason, M. Alarjah, R. Ashayer and S. H. Mannan, Ultrason. Sonochem., 2011, 18, 37–41 CrossRef CAS PubMed.
- D. Astruc, E. Boisselier and C. Ornelas, Chem. Rev., 2010, 110, 1857–1959 CrossRef CAS PubMed.
- D. Movia, V. Gerard, C. M. Maguire, N. Jain, A. P. Bell, V. Nicolosi, T. O'Neill, D. Scholz, Y. Gun'ko, Y. Volkov and A. Prina-Mello, Biomaterials, 2014, 35, 2543–2557 CrossRef CAS PubMed.
- I. Fratoddi, I. Venditti, C. Cametti and M. V. Russo, Toxicol. Res., 2015, 4, 796–800 RSC.
- M. Hu, L. Qian, R. P. Brinas, E. S. Lymar, L. Kuznetsova and J. F. Hainfeld, J. Struct. Biol., 2008, 161, 83–91 CrossRef CAS PubMed.
- S. Ruan, M. Yuan, L. Zhang, G. Hu, J. Chen, X. Cun, Q. Zhang, Y. Yang, Q. He and H. Gao, Biomaterials, 2015, 37, 425–435 CrossRef CAS PubMed.
- B. D. Chithrani, A. A. Ghazani and W. C. Chan, Nano Lett., 2006, 6, 662–668 CrossRef CAS PubMed.
- E. C. Cho, Q. Zhang and Y. Xia, Nat. Nanotechnol., 2011, 6, 385–391 CrossRef CAS PubMed.
- N. M. Schaeublin, L. K. Braydich-Stolle, A. M. Schrand, J. M. Miller, J. Hutchison, J. J. Schlager and S. M. Hussain, Nanoscale, 2011, 3, 410–420 RSC.
- D. Choudhury, P. L. Xavier, K. Chaudhari, R. John, A. K. Dasgupta, T. Pradeep and G. Chakrabarti, Nanoscale, 2013, 5, 4476–4489 RSC.
- V. Ramalingam, S. Revathidevi, T. Shanmuganayagam, L. Muthulakshmi and R. Rajaram, RSC Adv., 2016, 6, 20598–20608 RSC.
- X. Huang, X. Teng, D. Chen, F. Tang and J. He, Biomaterials, 2010, 31, 438–448 CrossRef CAS PubMed.
- F. Etoc, D. Lisse, Y. Bellaiche, J. Piehler, M. Coppey and M. Dahan, Nat. Nanotechnol., 2013, 8, 193–198 CrossRef CAS PubMed.
- B. Kim, G. Han, B. J. Toley, C. K. Kim, V. M. Rotello and N. S. Forbes, Nat. Nanotechnol., 2010, 5, 465–472 CrossRef CAS PubMed.
- K. Saha, S. S. Agasti, C. Kim, X. Li and V. M. Rotello, Chem. Rev., 2012, 112, 2739–2779 CrossRef CAS PubMed.
- X. Q. Liu and R. Z. Tang, Drug Delivery, 2017, 24, 1–15 CAS.
- X. Shi, Y. Wang, D. Li, L. Yuan, F. Zhou, Y. Wang, B. Song, Z. Wu, H. Chen and J. L. Brash, Langmuir, 2012, 28, 17011–17018 CrossRef CAS PubMed.
- V. L. Lapointe, A. T. Fernandes, N. C. Bell, F. Stellacci and M. M. Stevens, Adv. Healthcare Mater., 2013, 2, 1644–1650 CrossRef CAS PubMed.
- D. C. Miller, A. Thapa, K. M. Haberstroh and T. J. Webster, Biomaterials, 2004, 25, 53–61 CrossRef CAS PubMed.
- K. Amschler, L. Erpenbeck, S. Kruss and M. P. Schon, ACS Nano, 2014, 8, 9113–9125 CrossRef CAS PubMed.
- Q. Huang, T. A. Elkhooly, X. Liu, R. Zhang, X. Yang, Z. Shen and Q. Feng, Colloids Surf., B, 2016, 145, 37–45 CrossRef CAS PubMed.
- J. Fiedler, B. Ozdemir, J. Bartholoma, A. Plettl, R. E. Brenner and P. Ziemann, Biomaterials, 2013, 34, 8851–8859 CrossRef CAS PubMed.
- L. C. Lee, N. Gadegaard, M. C. de Andres, L. A. Turner, K. V. Burgess, S. J. Yarwood, J. Wells, M. Salmeron-Sanchez, D. Meek, R. O. Oreffo and M. J. Dalby, Biomaterials, 2017, 116, 10–20 CrossRef CAS PubMed.
- B. Alberts, A. Johnson, J. Lewis, M. Raff and a. P. W. Keith Roberts, An overview of M phase, Garland Science, New York, 4th edn., 2002 Search PubMed.
- K. S. Chan, C. G. Koh and H. Y. Li, Cell Death Discovery, 2012, 3, e411 CrossRef PubMed.
- Y. Stroikin, H. Dalen, U. T. Brunk and A. Terman, Biogerontology, 2005, 6, 39–47 CrossRef CAS PubMed.
- E. Manchado, M. Guillamot and M. Malumbres, Cell Death Differ., 2012, 19, 369–377 CrossRef CAS PubMed.
- S. Senese, Y. C. Lo, D. Huang, T. A. Zangle, A. A. Gholkar, L. Robert, B. Homet, A. Ribas, M. K. Summers, M. A. Teitell, R. Damoiseaux and J. Z. Torres, Cell Death Discovery, 2014, 5, e1462 CrossRef CAS PubMed.
- Y. J. Lee, N. B. Schade, L. Sun, J. A. Fan, D. R. Bae, M. M. Mariscal, G. Lee, F. Capasso, S. Sacanna, V. N. Manoharan and G. R. Yi, ACS Nano, 2013, 7, 11064–11070 CrossRef CAS PubMed.
- S. Jun, D. Ke, K. Debiec, G. Zhao, X. Meng, Z. Ambrose, G. A. Gibson, S. C. Watkins and P. Zhang, Structure, 2011, 19, 1573–1581 CrossRef CAS PubMed.
- S. Jun, G. Zhao, J. Ning, G. A. Gibson, S. C. Watkins and P. Zhang, J. Visualized Exp., 2013, 76, e50386 Search PubMed.
- H. J. Ro, H. Lee, E. C. Park, C. S. Lee, S. Il Kim and S. Jun, Sci. Rep., 2018, 8, 17373 CrossRef PubMed.
- S. H. Yun, S. Y. Lee, C. W. Choi, H. Lee, H. J. Ro, S. Jun, Y. M. Kwon, K. K. Kwon, S. J. Kim, G. H. Kim and S. I. Kim, J. Microbiol., 2017, 55, 56–62 CrossRef CAS PubMed.
- W. A. Loesberg, J. te Riet, F. C. van Delft, P. Schon, C. G. Figdor, S. Speller, J. J. van Loon, X. F. Walboomers and J. A. Jansen, Biomaterials, 2007, 28, 3944–3951 CrossRef CAS PubMed.
- K. Greish, J. Drug Targeting, 2007, 15, 457–464 CrossRef CAS PubMed.
- H. Takahashi, Y. Niidome, T. Niidome, K. Kaneko, H. Kawasaki and S. Yamada, Langmuir, 2006, 22, 2–5 CrossRef CAS PubMed.
- L. Cui, P. Zahedi, J. Saraceno, R. Bristow, D. Jaffray and C. Allen, Nanomedicine, 2013, 9, 264–273 CrossRef CAS PubMed.
- J. J. Li, D. Hartono, C. N. Ong, B. H. Bay and L. Y. Yung, Biomaterials, 2010, 31, 5996–6003 CrossRef CAS PubMed.
- S. J. Soenen, B. Manshian, J. M. Montenegro, F. Amin, B. Meermann, T. Thiron, M. Cornelissen, F. Vanhaecke, S. Doak, W. J. Parak, S. De Smedt and K. Braeckmans, ACS Nano, 2012, 6, 5767–5783 CrossRef CAS PubMed.
- Z. Fan, X. Yang, Y. Li, S. Li, S. Niu, X. Wu, J. Wei and G. Nie, Biointerphases, 2012, 7, 10 CrossRef CAS PubMed.
- X. Gao, G. Xu, Y. Zhao, S. Li, F. Shi and Y. Chen, RSC Adv., 2015, 5, 88045–88051 RSC.
- D. K. Kim, Y. J. Hwang, C. Yoon, H. O. Yoon, K. S. Chang, G. Lee, S. Lee and G. R. Yi, Phys. Chem. Chem. Phys., 2015, 17, 20786–20794 RSC.
- C. R. Wittmer, J. A. Phelps, W. M. Saltzman and P. R. Van Tassel, Biomaterials, 2007, 28, 851–860 CrossRef CAS PubMed.
- W. L. McKeehan and R. G. Ham, J. Cell Biol., 1976, 71, 727–734 CrossRef CAS PubMed.
- J. W. Posakony, J. M. England and G. Attardi, J. Cell Biol., 1977, 74, 468–491 CrossRef CAS PubMed.
- R. Eidukevicius, D. Characiejus, R. Janavicius, N. Kazlauskaite, V. Pasukoniene, M. Mauricas and W. Den Otter, BMC Cancer, 2005, 5, 122 CrossRef PubMed.
- X. Liu, N. Huang, H. Li, Q. Jin and J. Ji, Langmuir, 2013, 29, 9138–9148 CrossRef CAS PubMed.
- K. Niikura, T. Matsunaga, T. Suzuki, S. Kobayashi, H. Yamaguchi, Y. Orba, A. Kawaguchi, H. Hasegawa, K. Kajino, T. Ninomiya, K. Ijiro and H. Sawa, ACS Nano, 2013, 7, 3926–3938 CrossRef CAS PubMed.
- L. M. P. Vermeulen, T. Brans, S. K. Samal, P. Dubruel, J. Demeester, S. C. De Smedt, K. Remaut and K. Braeckmans, ACS Nano, 2018, 12, 2332–2345 CrossRef CAS PubMed.
- C. J. Cattin, M. Duggelin, D. Martinez-Martin, C. Gerber, D. J. Muller and M. P. Stewart, Proc. Natl. Acad. Sci. U. S. A., 2015, 112, 11258–11263 CrossRef CAS PubMed.
- J. J. Li, L. Zou, D. Hartono, C. N. Ong, B. H. Bay and L. Y. Lanry Yung, Adv. Mater., 2008, 20, 138–142 CrossRef CAS.
- M. Uz, V. Bulmus and S. Alsoy Altinkaya, Langmuir, 2016, 32, 5997–6009 CrossRef CAS PubMed.
- B. Kang, M. A. Mackey and M. A. El-Sayed, J. Am. Chem. Soc., 2010, 132, 1517–1519 CrossRef CAS PubMed.
- J. D. Orth, A. Loewer, G. Lahav and T. J. Mitchison, Mol. Biol. Cell, 2012, 23, 567–576 CrossRef CAS PubMed.
- D. Edmondson, Curr. Pharm. Des., 2014, 20, 155–160 CrossRef CAS PubMed.
- C. Richter, Int. J. Biochem. Cell Biol., 1995, 27, 647–653 CrossRef CAS PubMed.
- R. Mandelkow, D. Gumbel, H. Ahrend, A. Kaul, U. Zimmermann, M. Burchardt and M. B. Stope, Anticancer Res., 2017, 37, 2239–2244 CrossRef CAS PubMed.
- P. Mukhopadhyay, M. Rajesh, G. Hasko, B. J. Hawkins, M. Madesh and P. Pacher, Nat. Protoc., 2007, 2, 2295–2301 CrossRef CAS PubMed.
- S. J. Hurst, A. K. Lytton-Jean and C. A. Mirkin, Anal. Chem., 2006, 78, 8313–8318 CrossRef CAS PubMed.
- J. Z. Gasiorowski, S. J. Liliensiek, P. Russell, D. A. Stephan, P. F. Nealey and C. J. Murphy, Biomaterials, 2010, 31, 8882–8888 CrossRef CAS PubMed.
- S. J. Liliensiek, J. A. Wood, J. Yong, R. Auerbach, P. F. Nealey and C. J. Murphy, Biomaterials, 2010, 31, 5418–5426 CrossRef CAS PubMed.
- M. Aragona, T. Panciera, A. Manfrin, S. Giulitti, F. Michielin, N. Elvassore, S. Dupont and S. Piccolo, Cell, 2013, 154, 1047–1059 CrossRef CAS PubMed.
- J. G. Berryman, Phys. Rev. A, 1983, 27, 1053–1061 CrossRef CAS.
- A. I. Goranov, M. Cook, M. Ricicova, G. Ben-Ari, C. Gonzalez, C. Hansen, M. Tyers and A. Amon, Genes Dev., 2009, 23, 1408–1422 CrossRef CAS PubMed.
- L. Pauksch, M. Rohnke, R. Schnettler and K. S. Lips, Toxicol. Rep., 2014, 1, 900–908 CrossRef CAS PubMed.
- K. Tzelepi, C. Espinosa Garcia, P. Williams and J. Golding, Nanoscale Adv., 2019, 1, 807–816 RSC.
- Y. Qin, K. Chen, W. Gu, X. Dong, R. Lei, Y. Chang, X. Bai, S. Xia, L. Zeng, J. Zhang, S. Ma, J. Li, S. Li and G. Xing, J. Nanobiotechnol., 2018, 16, 54 CrossRef PubMed.
- J. K. Tee, L. X. Yip, E. S. Tan, S. Santitewagun, A. Prasath, P. C. Ke, H. K. Ho and D. T. Leong, Chem. Soc. Rev., 2019, 48, 5381 RSC.
- F. Peng, M. I. Setyawati, J. K. Tee, X. Ding, J. Wang, M. E. Nga, H. K. Ho and D. T. Leong, Nat. Nanotechnol., 2019, 14, 279–286 CrossRef CAS PubMed.
- J. Wang, L. Zhang, F. Peng, X. Shi and D. T. Leong, Chem. Mater., 2018, 30, 3759–3767 CrossRef CAS.
Footnotes |
| † Electronic supplementary information (ESI) available. See DOI: 10.1039/c9ra08410j |
| ‡ Equal contribution. |
| This journal is © The Royal Society of Chemistry 2019 |

