 Open Access Article
Development and application of novel bio-magnetic membrane capsules for the removal of the cationic dye malachite green in wastewater treatment†
Imran Aliab,
Changsheng Peng *abc,
Iffat Naz
 *de,
Dichu Linab,
Devendra P. Saroj
 *e and
Mohsin Alif
aThe Key Lab of Marine Environmental Science and Ecology, Ministry of Education, Ocean University of China, Qingdao 266100, China. E-mail: pcs005@ouc.edu.cn; Tel: +86 532 66782011
bDepartment of Environmental Engineering, College of Environmental Science and Engineering, Ocean University of China, Qingdao 266100, China
cSchool of Environmental and Chemical Engineering, Zhaoqing University, Zhaoqing 526061, China
dDepartment of Biology, Qassim University, Buraidah 51452, Kingdom of Saudi Arabia. E-mail: iffatkhattak@yahoo.com; I.Majid@qu.edu.sa; Tel: +96 653 3897891
eDepartment of Civil and Environmental Engineering, Faculty of Engineering and Physical Sciences, University of Surrey, Surrey GU2 7XH, UK. E-mail: d.saroj@surrey.ac.uk; Tel: +44 (0)1483-686634
fDepartment of Environmental Engineering, Middle East Technical University, Ankara 0600, Turkey
First published on 28th January 2019
Abstract
Novel bio-magnetic membrane capsules (BMMCs) were prepared by a simple two-step titration-gel cross-linking method using a polyvinyl alcohol (PVA) and sodium alginate (SA) matrix to control the disintegration of phytogenic magnetic nanoparticles (PMNPs) in an aqueous environment, and their performance was investigated for adsorbing cationic malachite green (MG) dye from water. The prepared BMMCs were characterized by FTIR, powder XRD, SEM, EDX, XPS, VSM and TGA techniques. The findings revealed that the hysteresis loops had an excellent superparamagnetic nature with saturation magnetization values of 11.02 emu g−1. The prepared BMMCs not only controlled the oxidation of PMNPs but also improved the adsorptive performance with respect to MG dye (500 mg g−1 at 298.15 K and pH 6.5) due to the presence of a large amount of hydrophilic functional groups (hydroxyl/–OH and carboxyl/–COOH) on/in the BMMCs. The smooth encapsulation of PMNPs into the PVA–SA matrix established additional hydrogen bonding among polymer molecular chains, with improved stability, and adsorptive performance was maintained over a wide range of pH values (3–12). Importantly, the prepared BMMCs were easily regenerated just by washing with water, and they could be re-utilized for up to four (4) consecutive treatment cycles without observing any apparent dissolution of iron/Fe0 or damage to the morphology. According to the mass balance approach, an estimated amount of 100 mL of treated effluent can be obtained from 160 mL of MG dye solution (25 mg L−1) just by employing a 0.02 g L−1 adsorbent dosage. Finally, a model of BMMCs based on zero-effluent discharge was also proposed for commercial or industrial applications. The prepared BMMCs are greatly needed for improving the water/wastewater treatment process and they can be utilized as an excellent adsorbent to remove cationic pollutants for various environmental applications.
1. Introduction
Toxic dyes in wastewater are considered to be the most primitive pollutants due to their acute toxicity, carcinogenicity, visible color, complex molecular structure and synthetic origin. Toxic dyes create alarming threats to aquatic environments, destroying the ecological balance and are released from different industries: i.e. paper coloring, cosmetics, dyes fabrication, textiles, mining, electroplating, pharmaceuticals and leather tanning.1–5 Among these, textile industries are largely using toxic dyes for coloring their products and about 0.7 million tonnes of toxic dyes are being produced annually, which contain highly hazardous chemicals and byproducts. Approximately 200 L of water is being used for the production of one kg of textile product.6–10 Furthermore, various types of diseases (i.e. heart defects, allergies, skin irritation, jaundice and tumors) are spreading in residential communities by the discharge of toxic dyes into aquatic environments.11,12 Hence, the treatment of these hazardous dyes is an imperative area of research for water/wastewater treatment experts to maintain a green and healthy environment.Currently, multifarious methods (i.e., coagulation, ion-exchange, chemical precipitation, flocculation, bioreactors, photo-catalytic degradation, trickling filters, electrochemical oxidation, activated sludge, adsorption and membrane filtration) have been developed and somehow optimized to treat toxic dyes from water/wastewater.13,14 Despite this dedication, there is still a demand to remove these hazardous dyes, because most of the tested technologies are not environmentally friendly and are expensive.15,16 Among them, adsorption is considered comparatively superior in terms of high efficiency, low cost, easy installation and easy operation over other technologies.17–20 In the past, a variety of adsorbents have been utilized to remove different kinds of toxic dyes, including agricultural waste material (rice husk, pinewood, orange peel, peanut hull, banana pith and jute fiber), red mud, cellulose, zeolite, ion-exchange resins, activated carbon, clay, chitosan, graphene oxide (GO) and its composites/derivatives, and so forth.21 However, some specific issues (low kinetics, poor stability, low removal performance, non-environmental friendliness and lack of reusability) are hampering its employment for commercial applications.22
Currently nanotechnology is gaining much attention for the preparation of nanoparticles (NPs) for overcoming these issues. A variety of fabrication protocols (sol–gel, chemical co-precipitation, electrochemical, ball milling, hydrothermal, micro-emulsion, green/bio-reduction, etc.) have been developed and implemented. Among them, bio-reduction is comparatively better for the fabrication of NPs from various kinds of bio-materials for the removal of toxic dyes and the recovery of metal ions from wastewater. Mostly green magnetic nanoparticles (MNPs) have been utilized at lab-scale to remove toxic dyes and metal ions from wastewater.17–20 However, MNPs are showing low removal performance, low adsorptive capacity and poor stability for long-term applications due to their oxidation in water treatment. Thus, these disadvantages have hampered the transfer of green nanotechnology from the lab-scale to the commercial scale and various kinds of coating technologies have been used to improve the stability, but they could not enhance the adsorptive capacity.23 To overcome these problems, some techniques like encapsulation, loading, embedding and assembling of NPs into different materials have been reported by various investigators. In most of the reported studies, MNPs have been loaded or inserted into different kinds of materials (graphene oxide (GO), chitosan, β-cyclodextrin/poly(acrylic acid), sodium alginate (SA), poly(vinyl alcohol) (PVA), etc.) to enhance their stability and removal performance.16 However, as yet there is no report available to address the encapsulation of green MNPs into these materials.
Therefore, the aim of the present research is the introduction of a novel approach to fabricate bio-magnetic membrane capsules (BMMCs) after the encapsulation of green MNPs into a PVA–SA matrix by using primary and secondary cross-linking agents via a simple titration gel cross-linking method. The following core objectives were designed in order to achieve the aim of the research: (i) fabrication of novel BMMCs to control the disintegration of PMNPs for the possible adsorptive removal of a cationic toxic dye, i.e. malachite green (MG); (ii) confirmation of the smooth encapsulation of PMNPs and characterization of BMMCs by employing different techniques, i.e. FTIR, powder XRD, SEM, EDX, XPS, TGA and VSM; (iii) assessment of the influence of various operational parameters, including the amount of PMNP encapsulation, adsorbent/BMMC dosages, solution pH, temperature, contact time, initial concentration of MG dye and co-existing ions, on the adsorptive performance of BMMCs; (iv) observation of the adsorptive performance of BMMCs in terms of sorption capacity and sorption kinetics; (v) engagement of various isotherms, kinetics and thermodynamic equations for scrutinizing probable removal mechanisms; and (vi) finally, the development of an appropriate regeneration scheme and consequent determination of the potential for reusability of BMMCs for consecutive treatment cycles.
2. Materials and methods
2.1. Materials/chemicals and instrumentation
The details of the chemicals and instrumentations used in the present study are documented in the ESI (Text-SI†). In addition, the molecular structure and chemical properties of the malachite green (MG) dye are also provided in Table SI.†2.2. Preparation of bio-magnetic membrane capsules (BMMCs)
BMMCs were prepared via a two-step titration-gel cross-linking method by the cross-linking of PVA and SA solutions using GA, boracic acid (H3BO3) and anhydrous calcium chloride (CaCl2) in the presence of PMNPs. PVA powder (10.0 wt%) was dissolved in 100 mL of distilled water and kept at 95 °C under vigorous stirring at a speed of 150 rpm for at least 24 h, until it was ensured that the mixture was homogenously dissolved. SA–PMNPs solution (3.0 wt%) was prepared by adding 3.0 g of SA powder into 97 mL of PMNP solution and heating at 95 °C under vigorous stirring at a speed of 100 rpm for at least 24 h, so a homogenous suspension was obtained. Meanwhile, a primary cross-linking solution of an oversaturated solution of CaCl2 (5 wt%) and H3BO3 was prepared separately by dissolving 25.0 g of CaCl2 and 20.0 g of H3BO3 into 500 mL of distilled water with the pH of the mixture maintained at 4. A secondary cross-linking solution of GA (1 wt%) was prepared separately by adding 2 mL of GA (50% dissolved in H2O) into 98 mL of distilled water. Thereafter, a 4![[thin space (1/6-em)]](https://www.rsc.org/images/entities/char_2009.gif) :
:![[thin space (1/6-em)]](https://www.rsc.org/images/entities/char_2009.gif) 1 (v/v) = [PVA (10.0 wt%)
1 (v/v) = [PVA (10.0 wt%)![[thin space (1/6-em)]](https://www.rsc.org/images/entities/char_2009.gif) :
:![[thin space (1/6-em)]](https://www.rsc.org/images/entities/char_2009.gif) SA–PMNPs (3.0 wt%)] = 20.0 g PVA
SA–PMNPs (3.0 wt%)] = 20.0 g PVA![[thin space (1/6-em)]](https://www.rsc.org/images/entities/char_2009.gif) :
:![[thin space (1/6-em)]](https://www.rsc.org/images/entities/char_2009.gif) 5.0 g SA–PMNPs solution was prepared and stirred together for at least 3 h, until a homogenous suspension was obtained, and it was then ultrasonically oscillated for at least 2 h to further ensure its homogenous quality. After this, the casting solution, i.e. PVA–SA–PMNPs, was transferred into a syringe that had a needle diameter of around about 3.2 mm, and it was placed horizontally in a syringe pump by adjusting the feed flow rate to 13 mL h−1. Then, the mixture droplet was injected into the primary cross-linking solution via a syringe pump by keeping a distance of 8 cm between the needle tip and the primary cross-linking agent solution surface. The prepared capsules were kept in the primary cross-linking agent solution for at least 24 h to form PMNP globules, then gently separated from the primary cross-linking agent solution and were shifted into the secondary cross-linking agent solution for at least 8 h. Thereafter, the prepared PMNPs were separated and washed thoroughly five to six times with distilled water until pH = 7 and stored for further experimental studies. A schematic of BMMC fabrication is illustrated in Fig. 1.
5.0 g SA–PMNPs solution was prepared and stirred together for at least 3 h, until a homogenous suspension was obtained, and it was then ultrasonically oscillated for at least 2 h to further ensure its homogenous quality. After this, the casting solution, i.e. PVA–SA–PMNPs, was transferred into a syringe that had a needle diameter of around about 3.2 mm, and it was placed horizontally in a syringe pump by adjusting the feed flow rate to 13 mL h−1. Then, the mixture droplet was injected into the primary cross-linking solution via a syringe pump by keeping a distance of 8 cm between the needle tip and the primary cross-linking agent solution surface. The prepared capsules were kept in the primary cross-linking agent solution for at least 24 h to form PMNP globules, then gently separated from the primary cross-linking agent solution and were shifted into the secondary cross-linking agent solution for at least 8 h. Thereafter, the prepared PMNPs were separated and washed thoroughly five to six times with distilled water until pH = 7 and stored for further experimental studies. A schematic of BMMC fabrication is illustrated in Fig. 1.
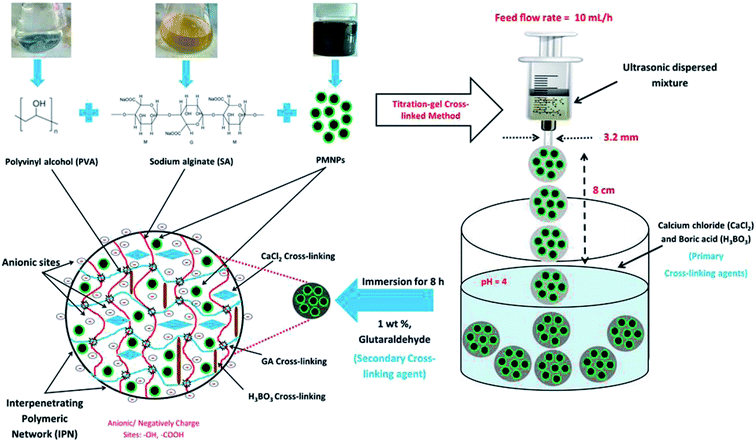 | ||
| Fig. 1 A schematic diagram of bio-magnetic membrane capsule (BMMC) fabrication by the encapsulation of phytogenic magnetic nanoparticles (PMNPs). (Reproduced from Ali et al.24 Copyright@2019, with permission from Elsevier Ltd.) | ||
Moreover, for the investigation of the influence of PMNP encapsulation on the removal performance, various types of BMMCs were also prepared by encapsulating different amounts of PMNPs (1 to 5 wt%) into the PVA–SA matrix.
SA solution (3.0 wt%) was prepared by adding 3.0 g of SA powder into 100 mL of distilled water and heated at 95 °C under vigorous stirring at a speed of 100 rpm for at least 24 h, and finally a homogenous suspension was obtained. Furthermore, an SA–PMNPs solution was prepared by incorporating different amounts of PMNPs (1 to 5 wt%) and heated at 95 °C under vigorous stirring at a speed of 100 rpm for at least 24 h, until finally a homogenous suspension was obtained. For the fabrication of these capsules, 4![[thin space (1/6-em)]](https://www.rsc.org/images/entities/char_2009.gif) :
:![[thin space (1/6-em)]](https://www.rsc.org/images/entities/char_2009.gif) 1 (v/v) = PVA–[SA–PMNPs] solutions were prepared as displayed in Table 1, and then the capsules were prepared according to the same procedure, as previously illustrated in Fig. 1.
1 (v/v) = PVA–[SA–PMNPs] solutions were prepared as displayed in Table 1, and then the capsules were prepared according to the same procedure, as previously illustrated in Fig. 1.
| PMNPs | Amount of PMNPsa (g) | PVA (g) | SA (g) | 4![[thin space (1/6-em)]](https://www.rsc.org/images/entities/char_2009.gif) : :![[thin space (1/6-em)]](https://www.rsc.org/images/entities/char_2009.gif) 1 (v/v) = PVA–[SA–PMNPs] 1 (v/v) = PVA–[SA–PMNPs] |
|---|---|---|---|---|
a PVA![[thin space (1/6-em)]](https://www.rsc.org/images/entities/char_2009.gif) : :![[thin space (1/6-em)]](https://www.rsc.org/images/entities/char_2009.gif) SA = 4 [10 wt%] = 1 [3 wt%]; if PVA = 20 g then SA = 5 g; thus, the total mass of the whole polymer: 20 × 10% + 5 × 3% = 2.15 g. SA = 4 [10 wt%] = 1 [3 wt%]; if PVA = 20 g then SA = 5 g; thus, the total mass of the whole polymer: 20 × 10% + 5 × 3% = 2.15 g. |
||||
| 1.0 wt% | 2.15 × 1% = 0.215 | 20 | 4.785 | 20/4.785 + 0.215 |
| 2.0 wt% | 2.15 × 2% = 0.430 | 20 | 4.570 | 20/4.570 + 0.430 |
| 3.0 wt% | 2.15 × 3% = 0.645 | 20 | 4.355 | 20/4.355 + 0.645 |
| 4.0 wt% | 2.15 × 4% = 0.860 | 20 | 4.140 | 20/4.140 + 0.860 |
| 5.0 wt% | 2.15 × 5% = 1.075 | 20 | 3.925 | 20/3.925 + 1.075 |
2.3. Characterization of BMMCs
 | (1) |
 | (2) |
 | (3) |
| Water content/swelling ratio (%) = ((W − D))/W × 100% | (4) |
2.4. Surface properties, elemental contents, thermal stability and magnetic measurements of the prepared BMMCs
EDX and XPS were employed to detect the elemental contents and atomic percentages of the prepared BMMCs. The thermal stability of the prepared BMMCs was investigated using TGA, and nitrogen (N2) gas was used to perform TGA analysis. Material properties and magnetic measurements were conducted by XRD and VSM. The material interlayer spacing was estimated based on Bragg's Law and freeze-dried BMMCs were utilized to accomplish all these analyses.2.5. Adsorption and desorption experimental studies
All the experiments were conducted in batch mode by shaking Erlenmeyer flasks in a rotary shaker at 100 rpm under atmospheric pressure and room temperature (25 ± 2 °C). A fixed amount of the prepared freeze-dried BMMCs was added into 40 mL of MG dye solution with concentrations ranging from 25 to 1000 mg L−1 and the pH of the dye solution was maintained at 6.5. The initial MG dye concentration was 25 mg L−1, and the pH of the MG dye solution was kept stable at 6.5 throughout all the experiments. For the sorption isotherm and kinetic studies, a fixed amount of 0.02 g L−1 BMMCs was immersed into 40 mL of MG dye solution (25–1000 mg L−1) at pH 6.5 and it was kept in a temperature-controlled rotary shaker under atmospheric pressure and room temperature (25 ± 2 °C) at 100 rpm. Then, it was allowed to react with the prepared BMMCs for 0–96 h and the final MG dye concentration was observed at the end of 2, 5, 8, 10, 15, 20, 24, 30, 36, 40, 48, 64, 72 and 96 h by a UV-vis spectrophotometer. The BMMCs were separated from the final solution using a simple hand-held magnet at the end of each experiment. A UV-vis spectrophotometer was utilized to detect the final MG dye concentration and the sample absorbance readings were determined at λmax = 617 nm for MG. Predetermined standard calibration curves were employed to calculate the real values. All the tests were carried out in triplicate and the averaged values were used to obtain the real concentration. Finally, the removal efficiency and adsorptive capacity at different time intervals and at equilibrium were calculated using the following equations:
 | (5) |
 | (6) |
To investigate the probable removal mechanism of MG dye by the prepared BMMCs, the experimental data were further fitted into different isotherm models (Langmuir, Freundlich, Temkin and Dubinin–Radushkevich) and kinetics models (i.e. pseudo-first-order, pseudo-second-order, Elovich, intraparticle diffusion and liquid film diffusion) (Text-SII†). The debate was conducted after calculating the values of the regression co-efficient (R2). In addition, thermodynamic parameters (i.e. change in free energy ΔG° (kJ mol−1), enthalpy ΔH° (kJ mol−1) and entropy ΔS° (kJ mol−1)) were also estimated at 298.15, 303.15, 313, 323.15 and 333.15 K in a temperature-controlled rotary shaker at 100 rpm by employing a 0.02 g L−1 adsorbent dose at an initial MG dye concentration of 25 mg L−1 under atmospheric pressure and room temperature (25 ± 2 °C) (Text-SII†).
2.6. Regeneration and reusability of BMMCs
 | (7) |
 | (8) |
| Process | Employed solution | Regeneration volume (mL) | Feed-to-regeneration ratio (v/v) |
|---|---|---|---|
| Sorption–desorption of MG dye | 25 mg L−1 of MG dye (40 mL) and distilled water (H2O) | 40 | 1.0 |
| 35 | 1.1 | ||
| 30 | 1.3 | ||
| 25 | 1.6 | ||
| 15 | 2.7 | ||
| 10 | 4.0 | ||
| 5 | 8.0 |
3. Results and discussion
3.1. Physical properties of the bio-magnetic membrane capsules (BMMCs)
Table 3 illustrates the physical properties of the prepared BMMCs. According to the aspect ratio values, the prepared BMMCs were close to a perfect sphere. Other parameters such as diameter, weight and density were also estimated both on a wet and a freeze-dried basis. These findings suggest that the BMMCs could hold approximately 90% water content due to the presence of enriched hydrophilic functional groups. On average, the diameter of the prepared BMMCs was 4 ± 0.02 mm (Fig. SI†).| Parameters | Unit | Values |
|---|---|---|
| Reproduced from Ali et al.24 Copyright@2019, with permission from Elsevier Ltd. | ||
| Average wet weight/capsule | g | 0.064 ± 0.001 |
| Average freeze dried weight/capsule | g | 0.0062 ± 0.0001 |
| Average maximum diameter | mm | 4 ± 0.02 |
| Average minimum diameter | mm | 3.93 ± 0.01 |
| Average density (on wet basis) | g m−3 | 261.56 ± 0.05 |
| Average density (on dry basis) | g m−3 | 2700 ± 0.5 |
| Aspect ratio (on average) | (—) | 1.01 ± 0.03 |
| Average water content | (%) | 90.37 ± 0.05 |
3.2. Formation mechanism and characterization of BMMCs
![[double bond, length as m-dash]](https://www.rsc.org/images/entities/char_e001.gif) O stretching and the presence of O–Na bonds in the –COONa radical of sodium alginate (SA), respectively.5 Furthermore, the peaks at 1562–1363 cm−1 were assigned to C–OH stretching/–COO− groups of SA. Similarly, the band peak at 1039 cm−1 was assigned to the C–OH stretching of PVA.9 Thus, the results of the FTIR spectrum of the PVA–SA mixture showed that the amalgam was homogenous and the hydrophilic functional groups had well interacted with each other via electrostatic forces due to hydrogen bonding.8 Similarly, the FTIR spectrum of the PVA–SA–PMNPs mixture was also studied initially to observe the influence of PMNP addition into PVA and SA solution (Fig. 2b). The results indicated that the intensity of the peaks (at 3600–3300 cm−1) and (at 3191–2898 cm−1) was slightly reduced. This might be due to the space occupied by PMNPs.7 An absorption peak appeared at 489 cm−1, which can be assigned to Fe–O, confirming the existence of PMNPs in the PVA–SA mixture (Fig. 2b).3 However, the chemical structure did not change significantly, except that the color of the mixture changed from light yellow to black after inserting the PMNPs solution.
O stretching and the presence of O–Na bonds in the –COONa radical of sodium alginate (SA), respectively.5 Furthermore, the peaks at 1562–1363 cm−1 were assigned to C–OH stretching/–COO− groups of SA. Similarly, the band peak at 1039 cm−1 was assigned to the C–OH stretching of PVA.9 Thus, the results of the FTIR spectrum of the PVA–SA mixture showed that the amalgam was homogenous and the hydrophilic functional groups had well interacted with each other via electrostatic forces due to hydrogen bonding.8 Similarly, the FTIR spectrum of the PVA–SA–PMNPs mixture was also studied initially to observe the influence of PMNP addition into PVA and SA solution (Fig. 2b). The results indicated that the intensity of the peaks (at 3600–3300 cm−1) and (at 3191–2898 cm−1) was slightly reduced. This might be due to the space occupied by PMNPs.7 An absorption peak appeared at 489 cm−1, which can be assigned to Fe–O, confirming the existence of PMNPs in the PVA–SA mixture (Fig. 2b).3 However, the chemical structure did not change significantly, except that the color of the mixture changed from light yellow to black after inserting the PMNPs solution.
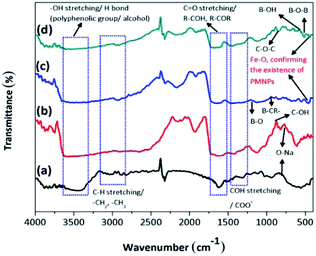 | ||
| Fig. 2 The Fourier transform infrared (FTIR) spectra of (a) PVA–SA, (b) PVA–SA–PMNPs, (c) PVA–SA–PMNPs after primary cross-linking and (d) fabricated bio-magnetic membrane capsules (BMMCs). (Reproduced from Ali et al.24 Copyright@2019, with permission from Elsevier Ltd.) | ||
To better understand the formation mechanism of BMMCs, the FTIR spectra of BMMCs were studied after incorporating primary and secondary cross-linking agents (Fig. 2c and d). It was observed that the cross-linking reaction occurred quickly by injecting a casting drop of PVA–SA–PMNPs mixture into oversaturated CaCl2 and H3BO3 solution and an interpenetrating polymer network (IPN) structure was developed.12,16,22 First, a semi-interpenetrating polymer network (SIPN) structure was formed through cross-linking of the G units in the SA chains through Ca2+ via chelation, and covalent and hydrogen bonding in the presence of PVA–PMNPs.14 This illustrated that ionic bonding was developed between Ca2+ and the carboxyl groups of SA and partial covalent bonding occurred between Ca2+ and the oxygen atom of the ether groups, respectively. Meanwhile, another SIPN structure was formed through crosslinking of B3+ with PVA via hydrogen bonding in the presence of SA–PMNPs.21 It should be noted that CaCl2 and H3BO3 were continuously utilizing –OH and –COONa in PVA and SA, and meantime the B–O, B–CR and B–O–B stretching characteristic peaks appeared at around 1406, 1061 and 696 cm−1 (Fig. 2c).4 However, the band of the O–Na bond at 893 cm−1 disappeared or was significantly reduced, suggesting inter/intra hydrogen bonding among PVA, SA and primary cross-linking agents (Fig. 2c).9 The characteristic peaks around 1560 and 1480 cm−1 attributed to the anti-symmetric and symmetric stretching vibrational peaks of –COH/–COO− groups in the polymer network (Fig. 2c), illustrate the formation of an IPN structure.5
Further, during secondary cross-linking with GA, both SINP structures of SA and PVA reacted with GA independently and an IPN structure was developed by cross-linking of –COH groups in GA with –OH groups in SA and PVA to form acetyls and ether linkages, as shown by mounting characteristic peaks of C![[double bond, length as m-dash]](https://www.rsc.org/images/entities/char_e001.gif) O, C–O–C, B–OH and B–O–B stretching vibrations at around 1666, 1074, 941 and 640 cm−1.8 This showed that during secondary cross-linking, PVA and SA cross-linked through hydrogen bonding and van der Waals forces, promoting a physical entanglement and chemically cross-linked-3D polymer network in membrane capsules.7 Hence, GA performed as a ‘knot’ or ‘joint’ to combine SA and PVA together via a co-cross-linking reaction that reinforced the overall mechanical properties of the capsule membranes and made them more beneficial for the adsorption process (Fig. 2d).21
O, C–O–C, B–OH and B–O–B stretching vibrations at around 1666, 1074, 941 and 640 cm−1.8 This showed that during secondary cross-linking, PVA and SA cross-linked through hydrogen bonding and van der Waals forces, promoting a physical entanglement and chemically cross-linked-3D polymer network in membrane capsules.7 Hence, GA performed as a ‘knot’ or ‘joint’ to combine SA and PVA together via a co-cross-linking reaction that reinforced the overall mechanical properties of the capsule membranes and made them more beneficial for the adsorption process (Fig. 2d).21
On the other hand, a change in the chemical structure in the capsule membrane was not noticeable by FTIR due to the encapsulation of PMNPs, but the characteristic peak can be observed at around 480 cm−1 in both spectra (Fig. 2c and d), suggesting the existence of the smooth encapsulation of PMNPs into the membrane capsules.3 The encapsulated PMNPs have their own functional groups (–OH and –COO−), that will also help to increase the anion active sites for the adsorption of cationic pollutants.6
In addition, the prepared BMMCs adsorbent can easily be separated from the final effluent just by applying a simple hand-held magnet and could be reused for multiple consecutive treatment cycles after regeneration. This encapsulation technique will also help to resolve PMNP disintegration problems and improve the stability of PMNPs. In addition, the functional groups can be maintained for long-term applications.3 Altogether, the FTIR results confirmed the smooth formation of BMMCs via chelation, hydrogen bonding and van der Waals forces by employing primary and secondary cross-linking agents. The conceptual possible cross-linking networks of SA–CaCl2, PVA–H3BO3 and PVA–SA–GA during the fabrication of BMMCs are shown in Fig. 3.
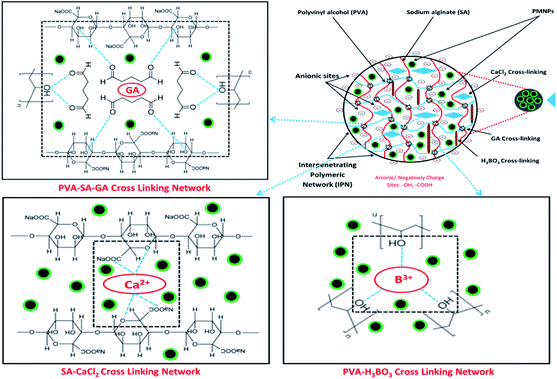 | ||
| Fig. 3 Conceptual possible cross-linking networks of SA–CaCl2, PVA–H3BO3 and PVA–SA–GA during the fabrication of bio-magnetic membrane capsules (BMMCs). (Reproduced from Ali et al.24 Copyright@2019, with permission from Elsevier Ltd.) | ||
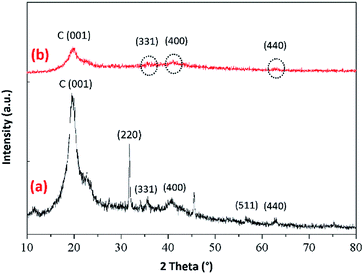 | ||
| Fig. 4 Powder X-ray diffraction patterns of (a) PVA–SA–PMNPs and (b) the prepared bio-magnetic membrane capsules (BMMCs) after reaction with primary and secondary cross-linking agents (displaying the amorphous carbon and magnetite structures). (Reproduced from Ali et al.24 Copyright@2019, with permission from Elsevier Ltd.) | ||
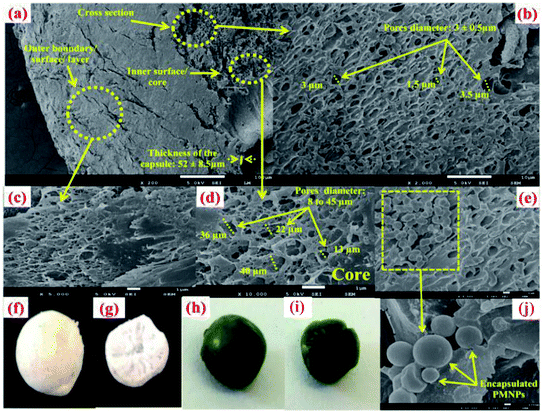 | ||
| Fig. 5 Scanning electron microscopy (SEM) images of (a) the fabricated bio-magnetic membrane capsules (BMMCs), (b) cross-sectional area of the BMMCs, (c) outer boundary/surface/layer of the BMMCs, (d, e & j) inner surface/core of the BMMCs, (f) real pictorial view of the outer boundary/surface/layer of the BMMCs, (g) real pictorial view of the cross-sectional area of the BMMCs, (h) real pictorial view of the outer boundary/surface/layer of the BMMCs after the sorption of cationic MG dye, and (i) real pictorial view of the cross-sectional area of the BMMCs (after the sorption of cationic MG dye). (Reproduced from Ali et al.24 Copyright@2019, with permission from Elsevier Ltd.) | ||
![[double bond, length as m-dash]](https://www.rsc.org/images/entities/char_e001.gif) C bands, which might be linked to the hydrophilic functional groups present in/on the surface of PVA, SA, GA and PMNPs.
C bands, which might be linked to the hydrophilic functional groups present in/on the surface of PVA, SA, GA and PMNPs.
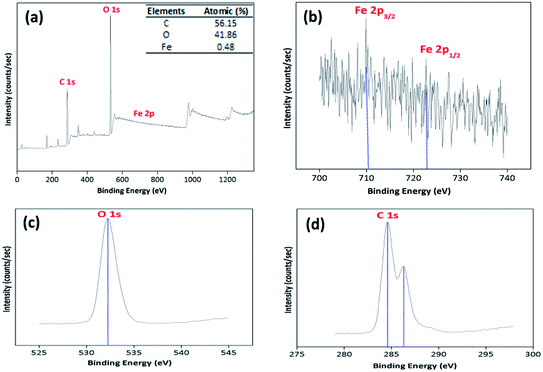
Moreover, the high resolution XPS spectra of Fe 2p were also studied to investigate the structure of Fe3O4. As expected, two small peaks at 710.6 and 724.7 eV emerged in the binding range of 700–740 eV, which were related to Fe 2p3/2 and Fe 2p1/2 respectively, confirming the presence of PMNPs/Fe3O4. The peak at Fe 2p3/2 is typically associated with Fe in Fe3O4/PMNPs (Fig. 6b). The peak intensities were low, because a small amount of PMNPs was incorporated during the fabrication of BMMCs. The XPS results described that the atomic percentages of C, O and Fe were 56.15, 41.86 and 0.48%, respectively. Importantly, the XPS results were well matched with the EDX results and confirmed the loading/encapsulation of PMNPs.
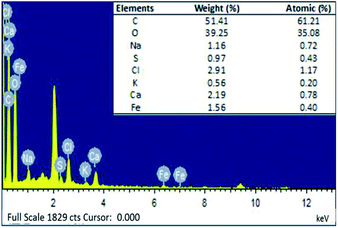 | ||
| Fig. 7 Energy dispersive X-ray (EDX) image of the prepared bio-magnetic membrane capsules (BMMCs). (Reproduced from Ali et al.24 Copyright@2019, with permission from Elsevier Ltd.) | ||
The C and O peaks in the EDX profile were associated with –OH and COOH groups, mainly linked to the PVA, SA, GA and PMNPs solution. On the other hand, the presence of Fe peaks in the EDX spectrum confirmed the encapsulation of PMNPs in the prepared BMMCs (Fig. 7). The peaks of Ca and Cl can be related to the primary cross-linking agent, i.e. CaCl2. While the intense peak of Na was mainly linked to SA. In addition, the presence of K and S peaks can be assigned to the plant bio-molecules, present in the plant leaf extract. The results indicated that the atomic percentages as obtained by EDX quantification were C (61.21%), O (35.08%), Na (0.72%), S (0.43%), Cl (1.17%), K (0.20%), Ca (0.78%) and Fe (0.40%) (Fig. 7). The presence of Fe homogenously distributed throughout the sample directed the smooth loading of PMNPs in the PVA–SA mixture, though in a small amount (1.56%). For the fabrication of BMMCs, 4![[thin space (1/6-em)]](https://www.rsc.org/images/entities/char_2009.gif) :
:![[thin space (1/6-em)]](https://www.rsc.org/images/entities/char_2009.gif) 1 (v/v) = [PVA (10.0 wt%)
1 (v/v) = [PVA (10.0 wt%)![[thin space (1/6-em)]](https://www.rsc.org/images/entities/char_2009.gif) :
:![[thin space (1/6-em)]](https://www.rsc.org/images/entities/char_2009.gif) SA–PMNPs (3.0 wt%)] = 20.0 g PVA
SA–PMNPs (3.0 wt%)] = 20.0 g PVA![[thin space (1/6-em)]](https://www.rsc.org/images/entities/char_2009.gif) :
:![[thin space (1/6-em)]](https://www.rsc.org/images/entities/char_2009.gif) 5.0 g SA–PMNPs solution was employed. Thus, based on the EDX quantification, the total amount of C, O and Na was 91.88%, excluding the amounts of S, Cl, K and Ca. Whereas, the amount of Fe element was 1.56% and this reading was very close to our theoretical calculation: i.e. 0.430 g (2 wt% PMNPs in 4
5.0 g SA–PMNPs solution was employed. Thus, based on the EDX quantification, the total amount of C, O and Na was 91.88%, excluding the amounts of S, Cl, K and Ca. Whereas, the amount of Fe element was 1.56% and this reading was very close to our theoretical calculation: i.e. 0.430 g (2 wt% PMNPs in 4![[thin space (1/6-em)]](https://www.rsc.org/images/entities/char_2009.gif) :
:![[thin space (1/6-em)]](https://www.rsc.org/images/entities/char_2009.gif) 1 (v/v) = PVA–[SA–PMNPs]). Moreover, despite having a very low Fe content (1.56%) of the PMNPs, the prepared BMMCs had a very high saturation magnetization (11.02 emu g−1). Notably, the said value was approximately 2.5 times lower than the saturation magnetization value obtained for PMNPs (50.95 emu g−1). This means that a slight loading of PMNPs into capsules is enough to produce significantly high Ms, which makes the capsules suitable for easy magnetic separation from an aqueous environment. Overall, the EDX results ensured the presence of C, O, Na, Cl, Ca and Fe in the fabrication of BMMCs (Fig. 7).
1 (v/v) = PVA–[SA–PMNPs]). Moreover, despite having a very low Fe content (1.56%) of the PMNPs, the prepared BMMCs had a very high saturation magnetization (11.02 emu g−1). Notably, the said value was approximately 2.5 times lower than the saturation magnetization value obtained for PMNPs (50.95 emu g−1). This means that a slight loading of PMNPs into capsules is enough to produce significantly high Ms, which makes the capsules suitable for easy magnetic separation from an aqueous environment. Overall, the EDX results ensured the presence of C, O, Na, Cl, Ca and Fe in the fabrication of BMMCs (Fig. 7).
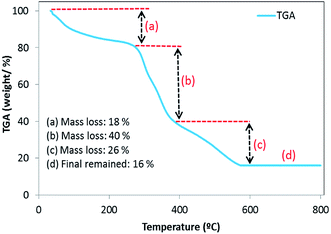 | ||
| Fig. 8 Thermogravimetric analysis (TGA) plot of the fabricated bio-magnetic membrane capsules (BMMCs). (Reproduced from Ali et al.24 Copyright@2019, with permission from Elsevier Ltd.) | ||
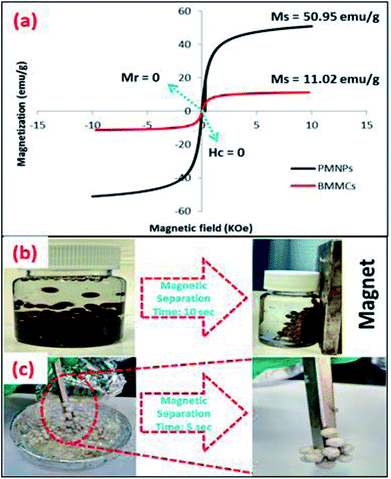 | ||
| Fig. 9 (a) M–H hysteresis loop/vibrating sample magnetometer (VSM) measurement of the prepared PMNPs and bio-magnetic membrane capsules (BMMCs) at a temperature of 300 K; and magnetic separation studies of the prepared BMMCs in (b) an aqueous environment, and (c) freeze-dried conditions using a simple hand-held magnet. (Reproduced from Ali et al.24 Copyright@2019, with permission from Elsevier Ltd.) | ||
| Magnetic sorbent | Magnetic separation time (s) | Ms (emu g−1) | Reference |
|---|---|---|---|
| Reproduced from Ali et al.24 Copyright@2019, with permission from Elsevier Ltd. | |||
| PVA–SA-embedded Fe3O4 magnetic nanoparticles (MNPs) | — | 5 | 7 |
| Fe3O4@mesoC | — | 5.5 | 26 |
| Fe3O4@SiO2@CS-TETA-GO | — | 8.22 | 27 |
| Bio-magnetic membrane capsules (BMMCs) | 10 | 11.02 | Present study |
| FeCo/GC NCs@MSNs | — | 17.1 | 28 |
| Fe3O4@(PAH/GO–COOH)2 nanocomposites | — | 21.5 | 25 |
| CMC-g-CMPVA film loaded with Fe3O4/SiO2nanoparticles | — | 36.87 | 31 |
3.3. Influence of different operating parameters on the adsorptive performance and properties of BMMCs for the removal of cationic toxic malachite green (MG) dye
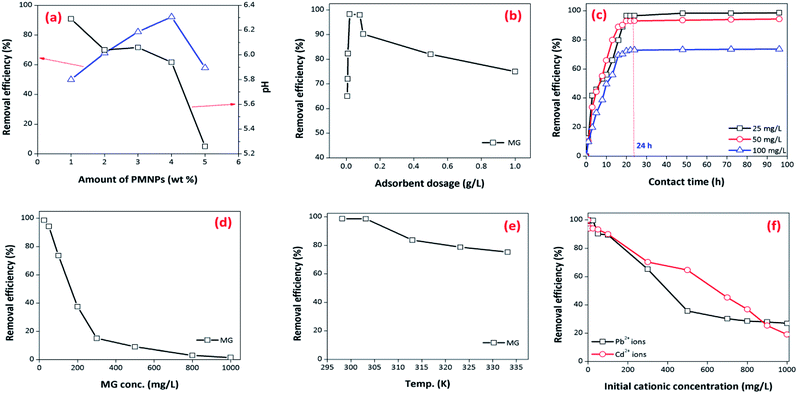
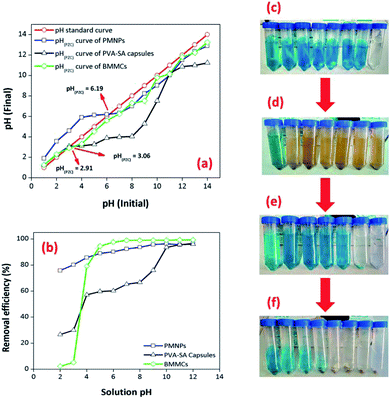
3.4. Adsorption kinetics studies
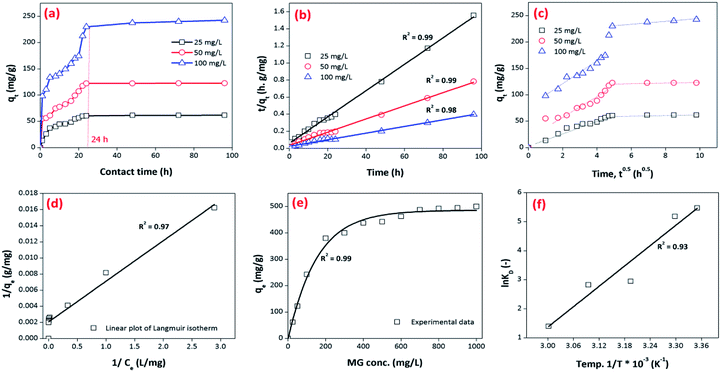
Most often, adsorption kinetics are employed to estimate the adsorption performance and application of lab-scale adsorbents. In order to evaluate the kinetics of MG dye sorption on/in the BMMCs, the influence of contact time was noted using an adsorbent dosage of 0.02 g L−1 in the MG dye concentration range of 25–100 mg L−1 at pH 6.5 (Fig. 12). It can be seen that initially a fast sorption occurred within a contact time of 20 h, and approached stability during the time period of 20 to 96 h (Fig. 12a). This fast sorption can be assigned to the availability of greater hydrophilic functional groups/negatively charged sites on/in the membrane capsules, which facilitated the rapid interaction of MG ions with negatively charged vacant/active sites, as previously examined by FTIR, EDX and XPS analyses. Overall, the fast sorption rate was achieved within a contact time of 20 h, while after 24 h adsorptive equilibrium was accomplished.To further explore the adsorption mechanism and to determine the kinetic parameters of MG dye sorption on/in the membrane capsules, various frequently used adsorption kinetics models were utilized. It is supposed that different independent processes may be concerned in controlling sorption kinetics during the adsorptive removal of pollutants that can be performed in series or parallel. For instance: (i) chemisorption/chemical reaction, (ii) bulk transport, (iii) intra-particle diffusion and (iv) film diffusion/external mass transfer. For this purpose, kinetic models including pseudo-first-order, pseudo-second-order, Elovich, intraparticle diffusion/Weber and Morris, and liquid film diffusion were employed to fit the experimental data. The obtained results are presented in Table 5.
| Kinetic models | Equations | Parameters | MG | ||
|---|---|---|---|---|---|
| 25 | 50 | 100 | |||
| a Given in ESI (Text-SIV). | |||||
| Pseudo-first-order |  |
qe (exp.) (mg g−1) | 61.63 | 122.5 | 242.5 |
| k1 (min−1) | −0.024 | −0.0314 | −0.0253 | ||
| qe (cal.) (mg g−1) | 61.97 | 122.775 | 242.25 | ||
| R2 | 0.80 | 0.73 | 0.92 | ||
| Pseudo-second-order |  |
k2 (min−1) | 0.0155 | 0.0078 | 0.0039 |
| qe (cal.) (mg g−1) | 61.975 | 122.775 | 242.25 | ||
| h (mg g−1 min−1) | 20.65 | 40.92 | 80.75 | ||
| R2 | 0.99 | 0.99 | 0.98 | ||
| Elovich |  |
α (mg g−1 min−1) | 20.65 | 40.92 | 80.75 |
| β (g mg−1) | 13.161 | 23.546 | 44.887 | ||
| R2 | 0.90 | 0.84 | 0.86 | ||
| Intraparticle diffusion | qt = kipdt0.5 | Kipd (mg g−1 min−0.5) | 35.78 | 70.88 | 139.86 |
| I | 20.095 | 40.579 | 70.461 | ||
| R2 | 0.70 | 0.74 | 0.80 | ||
| Liquid film diffusion | ln(1 − F) = −kfdt | kfd (g mg−1) | −0.245 | −0.593 | −0.518 |
| I | −0.870 | −0.767 | −0.9583 | ||
| R2 | 0.80 | 0.73 | 0.17 | ||
In all these experiments, the regression coefficient values (R2) for the second-order kinetic model were estimated to be greater than 0.97, which were higher than other employed kinetics models, indicating the presence of ion-exchange and/or chemisorption/chemical reaction mechanism (Fig. 12b). In addition, the calculated qe/adsorptive capacities by the second-order kinetic model were 61.975 mg g−1 at 25 mg L−1, 122.775 mg g−1 at 50 mg L−1 and 242.25 mg g−1 at 100 mg L−1, which were very close to the experimental qe/adsorptive capacities (61.63 mg g−1 at 25 mg L−1, 122.5 mg g−1 at 50 mg L−1 and 242.5 mg g−1 at 100 mg L−1), suggesting that sorption of MG dye on/in the BMMCs, was dominated by chemisorption and/or ion-exchange mechanisms. Furthermore, the values of k2 were less than h, suggesting a rapid adsorption of MG dye initially and subsequently slower sorption. Adsorption and desorption were also discovered by using Elovich's kinetic model. The values of α were greater than β, suggesting that the BMMCs had a greater adsorption rate than desorption. The R2 values of this model were less than 0.90, indicating the non-applicability of this model.
It is often reported that dye sorption is normally regulated by either the liquid phase mass transport rate or through the intra-particle mass transport rate. In order to investigate this phenomenon, the Weber and Morris kinetic equation was employed. Normally, this model is used to investigate the following adsorption processes that might be occurring: (i) bulk diffusion, (ii) film diffusion, (iii) intra-particle diffusion and (iv) chemical reaction via ion-exchange or the adsorption of pollutants at the vacant/active sites on the adsorbent surface. The plots/graph line did not pass through the origin, but data points can be explained in double lines by a difference in slope and intercept, suggesting that more than one process (boundary layer adsorption) might be implicated. For instance, the first straight line had a significant slope, suggesting that initially MG molecules covered/transported/interacted with the external surface/vacant sites of the BMMCs via film diffusion, and then these cationic MG ions entered into the solid phase or pores of the membrane capsules via intra-particle diffusion, which is shown in the second straight line. Furthermore, the values of kipd and intercept (I) also increased as the concentration of MG dye increased in the solution, suggesting the boundary layer diffusion effect occurred owing to the entry of MG molecules into the pores of the membrane capsules (Fig. 12c). Consequently, it can be declared that MG molecules sorbed on/in the membrane capsules owing to the presence of both surface adsorption and boundary layer adsorption or intra-particle diffusion. Finally, the liquid film diffusion mechanism was also used and its straight line did not pass through the origin, but showed proximity to the origin. This might be due to the rapid mixing of batch experiments, which can give rise to a discrepancy between the rate of mass transfer in the initial and final stages of the adsorption process. Overall, based on the adsorption kinetic results and fitting of the experimental data to the second-order kinetic model, it was demonstrated that the adsorption of MG dye on/in the BMMCs principally happened due to an ion-exchange and/or chemisorption mechanism. Moreover, double lines in the intra-particle diffusion kinetic model imply the presence of boundary layer diffusion, which might be due to the transportation of MG molecules into the inner core of the BMMCs via micro-pores to macro-pores, as formerly observed by SEM.
3.5. Adsorption isotherm studies
Adsorption isotherms were investigated to check the sorption performance of fabricated BMMCs as well as the interaction between the cationic MG and adsorbent/membrane capsule surface. The findings showed that sorption capacity increased as the initial concentration of MG dye increased, and then reached saturation at Co = 600 mg L−1 (Fig. 12e). The saturation sorption capacities were calculated as 500 mg g−1 for MG dye. For estimating the sorption isotherm, frequently used equilibrium models (Langmuir isotherm, Freundlich isotherm, Temkin isotherm and Dubinin–Radushkevich isotherm) were utilized to discuss the MG dye interaction with BMMCs and the estimated values are listed in Table 6. The experimental data were fitted into the models and discussed according to the values of R2 and the linearity of the isotherms. The findings indicated that the Langmuir isotherm represented a better R2 (0.97) than the other isotherm models, intimating the monolayer adsorption of MG dye on/in the BMMCs (Fig. 12d). This means that the membrane capsule surfaces were homogeneous and that all the active sites had the same affinity for adsorbing MG molecules. In addition, the values of KL for MG dye were in the range of 0.37–0.99, suggesting that adsorption was favorable, because the favorability of the adsorption isotherm depends mainly on the KL value. If KL > 1, the adsorption isotherm is unfavorable; if KL = 1, the adsorption isotherm is linear; if KL = 0, the adsorption isotherm is irreversible; and if KL < 1, then the adsorption isotherm is favorable. The calculated maximum adsorption capacity by the Langmuir model was 500 mg g−1 using a BMMC dosage of 0.02 g L−1 at pH 6.5. Overall, the evidence from the isotherm and kinetic studies confirmed that cationic MG dye was removed by the interaction with oppositely charged functional groups attached on/in the BMMCs via ion-exchange and/or electrostatic attractions. Furthermore, the uniform/smooth distribution of –OH and –COOH groups on/in the BMMCs played an important role in improving the sorption capacity and removal efficiency of MG dye.| Isotherm models | Equations | Parameters | Values |
|---|---|---|---|
| a Given in ESI (Text-SIV). | |||
| Langmuir isotherm |  |
qmax (mg g−1) | 500 |
| b (L mg−1) | 0.0021 | ||
| KL | 0.99–0.37 | ||
| R2 | 0.97 | ||
| Freundlich isotherm |  |
1/n | 0.4199 |
| kF (mg L−1) | 1.5923 | ||
| R2 | 0.49 | ||
| Temkin isotherm |  |
KT (L g−1) | 107.42 |
| BT (kJ mol−1) | 138.66 | ||
| R2 | 0.95 | ||
| Dubinin–Radushkevich isotherm | ln![[thin space (1/6-em)]](https://www.rsc.org/images/entities/char_2009.gif) qe = ln qe = ln![[thin space (1/6-em)]](https://www.rsc.org/images/entities/char_2009.gif) qm − βε2 qm − βε2 |
qm (mg L−1) | 500 |
| ε (kJ mol−1) | 0.3013 | ||
| β (mol2 J−2) | 5.5094 | ||
| R2 | 0.042 | ||
3.6. Thermodynamic studies
In order to evaluate the type of adsorption, thermodynamic parameters were also estimated (Table 7). The values of ΔG° were negative for all temperatures, suggesting that sorption was thermodynamically feasible and spontaneous in nature (Fig. 12f). The value of ΔG° decreased with the increase in temperature, indicating a lower feasibility of adsorption at higher temperature. From the negative value of enthalpy (ΔH°) we inferred that sorption was exothermic in nature in the temperature range of 298.15–333.15 K. Further, the value of ΔH° (39.387 kJ mol−1) was greater than 20.9 kJ mol−1, suggesting that adsorption of MG dye on/in the BMMCs mainly happened due to an ion-exchange and/or chemisorption mechanism, as formerly confirmed in the kinetic and isotherm studies. On the other hand, the positive value of entropy (ΔS°) indicates an increase in randomness/adsorbed species degree of freedom at the solid–solution interface during the process of sorption. In addition, it was also noticed that the removal efficiency and sorption capacity decreased with the increase in temperature (Fig. SX†). This might be due to damage to the morphology/structure of the BMMCs, which reduced vacant sites on/in the membrane capsules and/or decreased the rate of pore diffusion. It is also confirmed by BET analysis that the swelling nature of the non-rigid porous structures is helping to desorb the pollutants/molecules instead of sorption due to the rupture in macro-porosity at higher temperature. Hence, a higher temperature is favorable to desorb pollutants from the membrane capsules or for desorption processes rather than sorption.| Equations | Temperature (K) | ΔG° (kJ mol−1) | ΔH° (kJ mol−1) | ΔS° (kJ mol−1 K−1) |
|---|---|---|---|---|
| a Given in ESI (Text-SIV). | ||||
 |
298.15 | −13563.56 | −39.387 | 37.076 |
| 303.15 | −13069.43 | |||
| 313 | −7669.33 | |||
| 323.15 | −7588.07 | |||
| 333.15 | −3865.72 | |||
3.7. Desorption and reusability studies
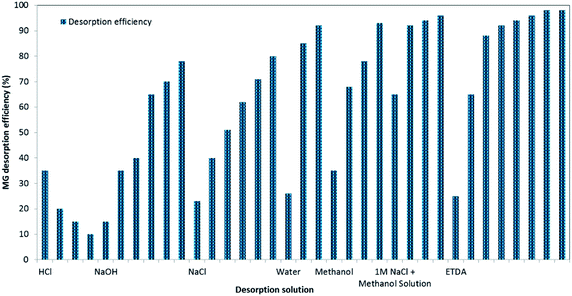
Adsorbent stability, regeneration and reusability for consecutive treatment cycles are considered important traits to implement proposed adsorption technology, economically and feasibly technically for real applications. Hence, initially, regeneration experiments were planned to choose a suitable regeneration solution, and its optimum volume for the removal of MG dye by BMMCs (Fig. 13). For this purpose, first, a 0.02 g L−1 membrane capsule dose was added into 40 mL of MG dye solution (25 mg L−1) for sorption of MG molecules, and then after approaching equilibrium, these BMMCs were separated from solution, and added into different kinds of regeneration solution in order to achieve maximum replenishment using minimum cost and energy. The findings of these experiments are given in ESI (Fig. SIV–IX†). In short, basic (NaOH), salty (NaCl), acidic (HCl and EDTA), water/H2O and organic solvent (methanol) solutions were employed to desorb MG molecules and to retrieve the membrane capsules. In the first phase, an acidic environment was selected, such as the HCl selected by many other researchers. The results indicated that desorption efficiency decreased from 35 to 10% as the concentration of HCl increased from 25 to 100%.Despite this fact, HCl had protons (H+) to exchange with adsorbed cationic MG ions (Fig. 13). However, interestingly, it was noticed that firstly the color of the bio-magnetic membrane capsules changed from brown/chocolate to white by increasing HCl concentration from 5 to 30% (Fig. SIII†). This might be due to the leaching of encapsulated PMNPs from the membrane, indicating that the prepared BMMCs could not survive in a more acidic environment. Thereafter, the membrane capsules disappeared from solution by further increasing the concentration of HCl from 30 to 100%, confirming the complete loss of stability and morphology at higher pH (Fig. SIII†). In the second phase, in the basic conditions, it was noticed that the desorption efficiency was improved to 80% by increasing NaCl from 0.1 to 3 M. This might be due the replacement of Na+ with cationic MG and/or the presence of a higher affinity of –OH and –COOH, to replace cationic MG with Na+ via an ion-exchange process (Fig. 13). However, complete regeneration was not achieved due to the occurrence of a ‘salting-out effect’, because the solubility of the dyes often deteriorated with increasing salt concentration in the aqueous environment.32 It is also suggested that some other forces (hydrophobic interactions) along with electrostatic interactions and ion-exchange might complicate the interactions between MG ions and membrane capsules. Hence, in the third phase, it was supposed that an organic solvent (methanol) could destroy these additional forces, but it seemed ineffective in desorbing MG ions completely from the membrane capsules, indicating the co-presence of other forces (hydrogen bonding, ion-exchange, and strong bonding between cationic MG and hydrophilic functional groups) along with the hydrophobic interactions. More or less similar results were found using basic solution (NaOH). In the next phase, a combination of organic solvent and salt was employed to disconnect these forces (Fig. 13), which indicated that a combination was good for desorbing up to 96% of MG ions from membrane capsules. However, complete desorption was not achieved due to the co-presence of other forces (hydrogen bonding, and π–π interaction/stacking-like polar–π interactions and aromatic–aromatic interactions/π stacking) along-with ion-exchange, electrostatic and hydrophobic interactions. At this stage, there were hints found by applying various types of regeneration solution that the adsorption of MG dye on/in the bio-magnetic membrane capsules might be due to the combination of five types of interactions: i.e., ion-exchange, electrostatic interaction, hydrogen bonding, hydrophobic interaction, π–π interaction/stacking-like polar–π interactions and aromatic–aromatic interactions/π stacking. In addition, the prepared BMMCs have a 3D honeycomb like structure, which has an outer surface and inner/core area, where hydrophilic functional groups, active and negatively charged sites are disturbed randomly on/in the membrane capsules (Fig. 13).
Consequently, they are creating other interactions automatically like hydrogen bonding, hydrophobic interaction and π–π interaction/stacking like polar–π interactions and aromatic–aromatic interactions/π stacking, that are developing a strong bonding between cationic MG and adsorbents/membrane capsules, which are making it difficult to desorb MG dye from adsorbents/membrane capsules. On the other hand, MG dye has N+ at only one of its terminal ends along with two methyl groups. Whereas, there are three aromatic rings, and one of these is connected to a nitrogen atom with two methyl groups. This means that the positive charge is not uniformly distributed over the MG molecule. So, only one terminal end which has a cationic N+ side contributed to electrostatic interactions, while for the rest of the sides, the organic portion assisted the hydrophobic interaction and benzene rings/aromatic rings aided the hydrogen bonding, and π–π interaction/stacking-like polar–π interactions and aromatic–aromatic interactions/π stacking.
In the next phase, by keeping in mind all these interactions, a strong regeneration solution such as EDTA was selected, as recommended by other researchers (Fig. 13). The findings showed that EDTA had an excellent desorption performance over all the other employed solutions and showed 98% MG desorption efficiency with a 1.5 M EDTA solution, while 92% was achieved by applying 0.5 M EDTA, indicating that EDTA had excellent characteristics for disengaging all these interactions due to the presence of two amines and four –COO−, which can replace four cationic MG sorbed on/in the membrane capsule with four –COO− sides. Meanwhile, it was also observed that the structure of membrane capsule was significantly damaged because of chelation, which sequestered Ca2+ and metal complexes by bonding with ETDA (Fig. 13). In fact, this phenomenon has destroyed the morphology of the membrane capsules, despite offering the greatest desorption efficiency. Finally, from an economic point of view, water was selected to desorb cationic MG from BMMCs and interestingly, >90% desorption efficiency was achieved by increasing the volume of water from 10 to 50 mL, indicating that the prepared BMMCs had a strong affinity to replace H+ from solution due to the hydrophilic functional groups (–O−/–COO−) via an ion-exchange mechanism.3 Hence, water was selected as environmentally friendly and cost-effective regeneration solution to desorb cationic MG from BMMCs.
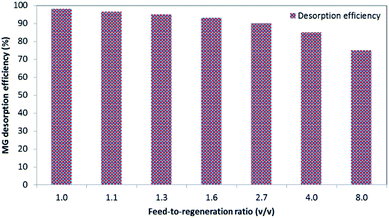
Further, the feed-to-regeneration ratio (v/v) was also elevated to attain a more economical and feasible ratio of regeneration solution to adsorbent (Fig. 14). It was noticed that initially the desorption efficiency was almost constant from 1 to 2.7, and then reduced gradually by further boosting the feed-to-regeneration ratio from 2.7 to 8. Based on the results, about 90% desorption efficiency was achieved at a 2.7 feed-to-regeneration ratio. Hence, this ratio (2.7) was selected as an optimum feed-to regeneration ratio for further studies to keep the membrane capsule technology sustainable and feasible.
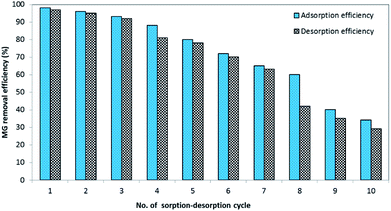
Finally, the sorption-desorption of MG dye was investigated for ten consecutive treatment cycles by keeping the optimum feed-to-regeneration ratio (2.7) using a dosage 0.02 g L−1 of membrane capsules (Fig. 15). The findings indicated that the prepared BMMCs maintained their performance for up to four consecutive treatment cycles with continuing removal efficiency > 80%, and then gradually reduced to 29%. Each time the membrane capsules were separated by a magnet and regenerated using 15 mL of fresh water. Since the desorption efficiency was not 100%, it can be supposed that a segment of sorbed MG dye remained on/inside the membrane capsules owing to the presence of other forces (hydrogen bonding, hydrophobic interaction and π–π interaction/stacking), which might be not collapsed by water. Moreover, during the first four treatment cycles, no leakage of PMNPs was discovered, suggesting the smooth encapsulation of PMNPs into the membrane capsules via strong hydrogen bonding. On the other hand, after four cycles, the reusability reduced, which might be due to the demolition of the membrane capsule structure due to the dissolution of PMNPs or lack of the availability of active sites on/in the membrane capsule, because a segment of the sorbed MG dye remained on/inside the membrane capsule due to the presence of micro or macro pores/voids. Similarly, Yue et al.16 prepared novel cellulose nanofiber-reinforced sodium alginate-polyvinyl alcohol hydrogels for the removal of cationic MB dye from textile wastewater and reported that the developed adsorbent could be regenerated by using fresh water and it maintained sorption–desorption efficiency up to four consecutive treatment cycles. However, in our case, the reusability potential of the prepared adsorbent can be enhanced by changing the regeneration solution. As Fig. 13 depicts, the prepared adsorbent showed maximum regeneration potential, when EDTA solution was employed, while, from the economic point of view, in the present study, fresh water was used to regenerate prepared capsules to make the treatment process cheap and affordable to developing countries. Research on the changes in morphology and structure of the prepared BMMCs is underway and will be discussed in the next report. Overall, the fabricated BMMCs can be re-used for up to four consecutive treatment cycles by keeping the removal efficiency above 80%. According to the mass balance approach, on average, an amount of 100 mL of treated water can be obtained from 160 mL of textile wastewater that contains cationic pollutants/MG dye just by using a dosage of 0.02 g L−1 adsorbent/membrane capsules.
3.8. Adsorption mechanism/proposed removal mechanism
The findings from the isotherm, kinetics, thermodynamic, regeneration and reusability examinations were further confirmed by utilizing FTIR and EDX analyses to investigate the probable adsorption mechanism of cationic MG toxic dye by BMMCs. The FTIR spectrum was obtained after the sorption of MG dye and compared with the spectrum of BMMCs (Fig. 16). The results showed that the stretching vibrations of hydroxyl/–O− functional groups (at around 3600–3300 cm−1) and carboxyl/–COO− (at around 1500–1300 cm−1) were affected and extended inward, suggesting the sorption of cationic MG on/in the BMMCs via electrostatic interaction and/or an ion-exchange mechanism ([Dye]–2R–HN+—−O and [Dye]–2R–HN+—−OOC). Furthermore, the stretching vibrations of C–H (–CH3/–CH2) at around 3191–2898 cm−1 were also affected, suggesting the sorption of cationic MG on/in the BMMCs. This might also be due to the co-presence of other interactions: i.e. hydrophobic interactions (between CH3 and CH3 groups attached on the MG molecules), hydrogen bonding (between the nitrogen atom attached on the MG molecules and –OH functional groups attached on in the membrane capsule) and π–π interaction/stacking, e.g. polar–π interactions (between benzene rings attached on the MG molecules and –OH functional groups attached on/in the membrane capsule) and aromatic–aromatic interactions/π stacking (among benzene rings attached on the MG molecules). In addition, an absorption peak at 489 cm−1 (for Fe–O) did not have an influence, suggesting good stability/smooth encapsulation/presence of PMNPs on/in the BMMCs (Fig. 16a and b). Overall, the FTIR results indicated the adsorption of cationic MG molecules via the attachment of cationic MG ions via –O− and –COO− functional groups on/in the BMMCs.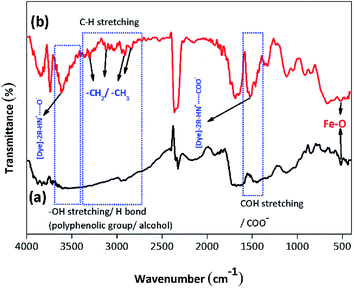 | ||
| Fig. 16 Fourier transform infrared (FTIR) spectrum of bio-magnetic membrane capsules (BMMCs) (a) before and (b) after the sorption of cationic malachite green (MG) dye. | ||
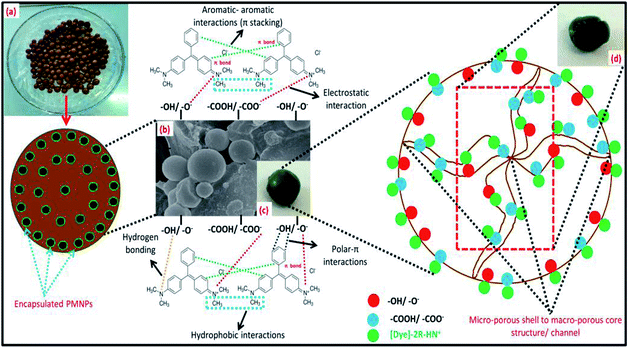
Therefore, based on the evidence obtained from isotherm, kinetics, thermodynamic, regeneration, reusability, FTIR and EDX studies along with the fact that MG dye and hydrophilic functional groups attached on/in the BMMCs are oppositely charged, indicated that electrostatic interactions/ion-exchange might be the leading adsorptive mechanism of cationic MG dye removal by BMMCs. In addition, the prepared BMMCs had a 3D honeycomb-like structure, which had outer surface and inner core areas, where hydrophilic functional groups, vacant, active, and negatively charged sites were disturbed randomly on/inside the membrane capsules (Fig. 17). Therefore, the attachment of MG molecules was also disturbed randomly. Consequently, they created other interactions automatically, to develop a strong bonding between cationic MG and adsorbent/membrane capsule (Fig. 17). For example, initially cationic MG molecules interacted with the external surface/vacant sites via film diffusion, and then the rest of the cationic MG ions were transported/entered into or inside the solid phase or cores via intra-particle diffusion by creating a flow network owing to the presence of a micro-porous shell to macro-porous core structure/channel, and meantime interacted with vacant sites through electrostatic interactions, hydrogen bonding, hydrophobic interaction and π–π interaction/stacking-like polar–π interactions and aromatic–aromatic interactions/π stacking. For instance, in aqueous solution the MG dye molecule ionized as:
| [Dye]–2R–HNCl → [Dye]–2R–HN+ + Cl− |
These protonated or ionized MG molecules then interacted with negatively charged hydrophilic functional groups of BMMCs via an electrostatic interaction/ion-exchange mechanism. A possible interaction can be expressed in the following way:
| [Dye]–2R–HN+ + [BMMC]–OH → [Dye]–2R–HN+—−O–[BMMC] + H+ |
| [Dye]–2R–HN+ + [BMMC]–COOH → [Dye]–2R–HN+—−OOC–[BMMC] + H+ |
3.9. Comparison of BMMCs with other sorbents and proposed BMMC based wastewater treatment model
Finally, compared to other sorbents and/or composites for the removal of cationic MG dye from wastewater, it is obvious that different kinds of adsorbents indicate different characteristics, but it was found that our BMMCs prepared by the encapsulation of green PMNPs had comparatively superior adsorptive performance in terms of adsorptive capacity and removal towards cationic MG toxic dye along with offering capsule regeneration just by using water and better reusability for up to four consecutive treatment cycles (Table 8). Moreover, an eco-friendly fabrication, wide operable pH range (3–12), rapid and easy magnetic separation from final effluents just by applying a simple hand-held magnet makes BMMCs an attractive candidate/3D composite magnetic sorbent for the treatment of wastewater containing cationic pollutants. It was also anticipated that the fabricated BMMCs could provide broad applications in the fields of green chemistry and environmental engineering. Importantly, this encapsulation technique will assist in resolving PMNP oxidation problems, and the generation of secondary pollution can be controlled along with improving PMNP adsorptive performance and stability for long-term applications. Therefore, inspired by the results obtained from this study, a model of BMMCs based on zero-effluent discharge was consequently proposed (Fig. 18).| Cationic dye | Sorbent | qe (mg g−1) | Reference |
|---|---|---|---|
| a qe: sorption capacity (mg g−1). | |||
| MG | Chitosan ionic liquid beads | 8.07 | 33 |
| MG | Carboxylate group functionalized multi-walled carbon nanotubes | 11.73 | 34 |
| MG | Pomegranate peel | 31.45 | 35 |
| MG | Wood apple shell (WAS) | 34.56 | 36 |
| MG | Activated carbon derived from Borassus aethiopum flowers | 48.48 | 37 |
| MG | CoFe2O4–SiO2 | 75.50 | 23 |
| MG | 3-MPA@PMNPs | 81.2 | 3 |
| MG | Chitosan beads | 93.6 | 38 |
| MG | Rice straw-derived char | 148.7 | 39 |
| MG | Graphene oxide–agarose hydrogel | 186.0 | 40 |
| MG | Organo-HAP | 188.18 | 41 |
| MG | Almond gum | 196.07 | 42 |
| MG | MIL-100(Fe) | 205.0 | 43 |
| MG | CNF aerogel | 212.7 | 44 |
| MG | Reduced graphene oxide–agarose hydrogel | 242.0 | 45 |
| MG | Zr-MOFs (UiO-67) | 357.3 | 46 |
| MG | Reduced graphene oxide–hematite (α-Fe2O3) | 438.8 | 47 |
| MG | Acetylated and dicarboxylated hemicellulosic (ASDCH) | 456.23 | 48 |
| MG | Reduced graphene oxide (rGO) | 476.2 | 49 |
| MG | Bio-magnetic membrane capsules (BMMCs) | 500 | Present study |
| MG | Magnetic β-cyclodextrin–graphene oxide nanocomposites (Fe3O4/β-CD/GO) | 740.7 | 50 |
| MG | Nickel nanoparticles encapsulated in porous carbon and carbon nanotube hybrids | 898 | 51 |
| MG | Calcium-rich biochar (CRB) | 12![[thin space (1/6-em)]](https://www.rsc.org/images/entities/char_2009.gif) 502 502 |
52 |
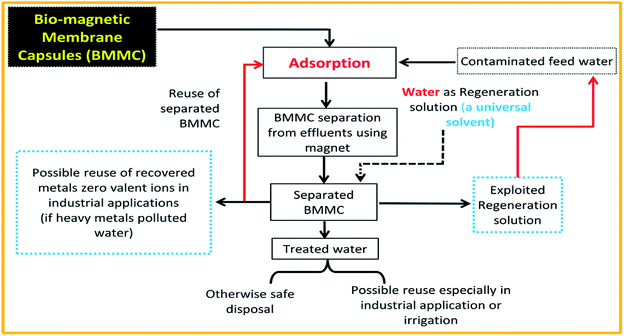 | ||
| Fig. 18 Proposed conceptual treatment model using bio-magnetic membrane capsules (BMMCs) based on zero-effluent discharge for water/wastewater containing cationic toxic dyes and heavy metal ions. | ||
4. Conclusions
In the present work, novel bio-magnetic membrane capsules (BMMCs) were successfully prepared to control the disintegration of phytogenic magnetic nanoparticles (PMNPs) for the adsorptive removal of cationic toxic MG dye from water. The fabrication, morphology, surface properties and magnetic measurements were inspected via FTIR, powder XRD, SEM, EDX, XPS, VSM and BET techniques. The following are the key findings of the present work:• PMNPs were smoothly encapsulated into a PVA–SA matrix via intra/inter-molecular hydrogen bonding, which significantly improved the stability against oxidation/disintegration in an aqueous environment.
• SEM analysis indicated that the prepared BMMCs had a micro-porous surface and a macro-porous core morphology.
• Batch adsorption experiments indicated that the prepared BMMCs had an excellent adsorption capacity of up to 500 mg g−1 against MG under optimized operating conditions (pH 6.5; temp: 25 °C; contact time: 24 h, agitation speed: 100 rpm; and adsorbent dosage: 0.02 g L−1), due to the presence of a large amount of hydrophilic functional groups.
• Moreover, the adsorption isotherm, kinetic, thermodynamic and FTIR results indicated that MG dye is mainly removed via electrostatic interactions and ion-exchange mechanisms, while the regeneration results indicated that some other co-present forces (i.e. hydrogen bonding, hydrophobic interaction and π–π interaction/stacking-like polar–π interactions and aromatic–aromatic interactions/π stacking) were also involved.
• In addition, the prepared BMMCs can be reused for at least four (4) consecutive treatment cycles just by washing with water without apparent leaching leakage of PMNPs/Fe0, and can be easily separated from aqueous solution within 10 s just by using a hand-held magnet, due to their superparamagnetic behavior.
Altogether, the fabricated BMMCs indicated a high adsorptive capacity and stability compared to naked/bare PMNPs, which emphasizes the brilliant potential for their practical application in water/wastewater treatment.
Author contributions
All authors contributed to the analysis of data and the preparation of the manuscript.Conflicts of interest
The authors declare no conflict of interest.Acknowledgements
This work was supported by the State Key Laboratory of Environmental Criteria and Risk Assessment (No. SKLECRA 2013FP12) and the Shandong Province Key Research and Development Program (2016GSF115040). Meanwhile, the first author would like to give thanks for the financial support from the Chinese Scholarship Council, China (CSC No: 2016GXYO20).References
- I. Ali, C. Peng, Z. M. Khan, I. Naz, M. Sultan, M. Ali, I. A. Abbasi, T. Islam and T. Ye, J. Environ. Manage., 2015, 230, 128–150 CrossRef PubMed
.
- I. Ali, C. Peng, I. Naz, Z. M. Khan, M. Sultan, T. Islama and I. A. Abbasi, RSC Adv., 2017a, 7, 40158–40178 Search PubMed
.
- I. Ali, C. Peng, T. Ye and I. Naz, RSC Adv., 2018a, 8(16), 8878–8897 Search PubMed
.
- S. Bekin, S. Sarmad, K. Gürkan, G. Keçeli and G. Gürdağ, Sens. Actuators, B, 2014, 202, 878–892 CrossRef CAS
.
- F. G. Thankam, J. Muthu, V. Sankar and R. K. Gopal, Colloids Surf., B, 2013, 107, 137–145 CrossRef PubMed
.
- I. Ali, C. Peng and I. Naz, Chin. J. Chem. Eng., 2018b DOI:10.1016/j.cjche.2018.03.018
.
- C. F. Huang, A. C. Huang, Y. F. Hsieh, F. J. Chu and T. J. Wan, Water Resources and Industry, 2017, 18, 9–16 CrossRef
.
- E. S. Dragan, Chem. Eng. J., 2014, 243, 572–590 CrossRef CAS
.
- H. S. Samanta and S. K. Ray, Carbohydr. Polym., 2014, 99, 666–678 CrossRef CAS PubMed
.
- S. Kahya, E. K. Solak and O. Şanlı, Vacuum, 2010, 84(9), 1092–1102 CrossRef CAS
.
- I. Ali, Z. M. Khan, M. Sultan, M. H. Mahmood, H. U. Farid, M. Ali and A. Nasir, Pol. J. Environ. Stud., 2016, 25(6), 2265–2273 CrossRef CAS
.
- G. B. Messaoud, L. Sánchez-González, L. Probst, C. Jeandel, E. Arab-Tehrany and S. Desobry, Carbohydr. Polym., 2016, 144, 428–437 CrossRef PubMed
.
- I. Ali, Z. M. Khan, C. Peng, I. Naz, M. Sultan, M. Ali, M. H. Mahmood and Y. Niaz, Pol. J. Environ. Stud., 2017b, 26(6), 2431–2444 Search PubMed
.
- W. C. Jao, H. C. Chen, C. H. Lin and M. C. Yang, Polym. Adv. Technol., 2009, 20(8), 680–688 CrossRef CAS
.
- I. Ali, C. Peng, Z. M. Khan and I. Naz, J. Basic Microbiol., 2017c, 57, 643–652 Search PubMed
.
- Y. Yue, J. Han, G. Han, A. D. French, Y. Qi and Q. Wu, Carbohydr. Polym., 2016, 147, 155–164 CrossRef CAS PubMed
.
- I. Ali, C. Peng, Z. M. Khan, I. Naz and M. Sultan, J. Chem. Technol. Biotechnol., 2018c, 2817–2832 Search PubMed
.
- I. Ali, C. Peng, Z. M. Khan, M. Sultan and I. Naz, Arabian J. Sci. Eng., 2018d, 1–15 Search PubMed
.
- I. Ali, C. Peng, D. Lin and I. Naz, Green Process. Synth., 2018e DOI:10.1515/gps-2018-0078
.
- T. Islam, C. Peng and I. Ali, J. Basic Microbiol., 2018, 58(5), 378–389 CrossRef PubMed
.
- A. Akbari, J. Taiwan Inst. Chem. Eng., 2017, 70, 391–400 CrossRef
.
- J. Hoon Kim, J. Jegal, J. Hye Kim, K. H. Lee and Y. Lee, J. Appl. Polym. Sci., 2003, 89(11), 3046–3051 CrossRef
.
- M. Amiri, M. Salavati-Niasari, A. Akbari and T. Gholami, Int. J. Hydrogen Energy, 2017, 42(39), 24846–24860 CrossRef CAS
.
- I. Ali, C. Peng, D. Lin, D. P. Saroj, I. Naz, Z. M. Khan, M. Sultan and M. Ali, J. Environ. Manage., 2019, 234, 273–289 CrossRef CAS PubMed
.
- R. Guo, T. Jiao, R. Li, Y. Chen, W. Guo, L. Zhang, J. Zhou, Q. Zhang and Q. Peng, ACS Sustainable Chem. Eng., 2017, 6(1), 1279–1288 CrossRef
.
- Y. Zhang, S. Xu, Y. Luo, S. Pan, H. Ding and G. Li, J. Mater. Chem., 2011, 21(11), 3664–3671 RSC
.
- F. Wang, L. Zhang, Y. Wang, X. Liu, S. Rohani and J. Lu, Appl. Surf. Sci., 2017, 420, 970–981 CrossRef CAS
.
- Y. Hong, I. A. Choi, M. Pal, G. Lee, K. M. Nam and W. S. Seo, RSC Adv., 2018, 8(2), 1089–1097 RSC
.
- W. G. Liang, C. Yang, G. Q. Wen, W. Wang, X. J. Ju, R. Xie and L. Y. Chu, Appl. Therm. Eng., 2014, 70(1), 817–826 CrossRef CAS
.
- Y. Y. Ling and F. B. M. Suah, J. Environ. Chem. Eng., 2017, 5(1), 785–794 CrossRef CAS
.
- N. A. Dahlan, A. K. Veeramachineni, S. J. Langford and J. Pushpamalar, Carbohydr. Polym., 2017, 173, 619–630 CrossRef CAS PubMed
.
- S. Karcher, A. Kornmüller and M. Jekel, Dyes Pigm., 2001, 51(2–3), 111–125 CrossRef CAS
.
- F. Naseeruteen, N. S. A. Hamid, F. B. M. Suah, W. S. W. Ngah and F. S. Mehamod, J. Biol. Macromol., 2018, 107, 1270–1277 CrossRef CAS PubMed
.
- M. Rajabi, B. Mirza, K. Mahanpoor, M. Mirjalili, F. Najafi, O. Moradi, H. Sadegh, R. Shahryari-Ghoshekandi, M. Asif, I. Tyagi and S. Agarwal, J. Ind. Eng. Chem., 2016, 34, 130–138 CrossRef CAS
.
- F. Gündüz and B. Bayrak, J. Mol. Liq., 2017, 243, 790–798 CrossRef
.
- A. S. Sartape, A. M. Mandhare, V. V. Jadhav, P. D. Raut, M. A. Anuse and S. S. Kolekar, Arabian J. Chem., 2017, 10, S3229–S3238 CrossRef CAS
.
- S. Nethaji, A. Sivasamy, G. Thennarasu and S. Saravanan, J. Hazard. Mater., 2010, 181(1–3), 271–280 CrossRef CAS PubMed
.
- Z. Bekçi, C. Özveri, Y. Seki and K. Yurdakoç, J. Hazard. Mater., 2008, 154(1–3), 254–261 CrossRef PubMed
.
- B. H. Hameed and M. I. El-Khaiary, J. Hazard. Mater., 2008, 153(1–2), 701–708 CrossRef CAS PubMed
.
- R. Gong, M. Feng, J. Zhao, W. Cai and L. Liu, Bioresour. Technol., 2009, 100(2), 975–978 CrossRef CAS PubMed
.
- A. A. El-Zahhar and N. S. Awwad, J. Environ. Chem. Eng., 2016, 4(1), 633–638 CrossRef CAS
.
- F. Bouaziz, M. Koubaa, F. Kallel, R. E. Ghorbel and S. E. Chaabouni, Int. J. Biol. Macromol., 2017, 105, 56–65 CrossRef CAS PubMed
.
- S. H. Huo and X. P. Yan, J. Mater. Chem., 2012, 22(15), 7449–7455 RSC
.
- F. Jiang, D. M. Dinh and Y. L. Hsieh, Carbohydr. Polym., 2017, 173, 286–294 CrossRef CAS PubMed
.
- Y. Wang, P. Zhang, C. F. Liu and C. Z. Huang, RSC Adv., 2013, 3(24), 9240–9246 RSC
.
- Q. Yang, Y. Wang, J. Wang, F. Liu, N. Hu, H. Pei, W. Yang, Z. Li, Y. Suo and J. Wang, Food Chem., 2018, 254, 241–248 CrossRef CAS PubMed
.
- A. Liu, W. Zhou, K. Shen, J. Liu and X. Zhang, RSC Adv., 2015, 5(22), 17336–17342 RSC
.
- D. Gautam, S. Kumari, B. Ram, G. S. Chauhan and K. Chauhan, J. Environ. Chem. Eng., 2018, 6(4), 3889–3897 CrossRef CAS
.
- K. Gupta and O. P. Khatri, J. Colloid Interface Sci., 2017, 501, 11–21 CrossRef CAS PubMed
.
- D. Wang, L. Liu, X. Jiang, J. Yu and X. Chen, Colloids Surf., A, 2015, 466, 166–173 CrossRef CAS
.
- L. Jin, X. Zhao, X. Qian and M. Dong, J. Colloid Interface Sci., 2018, 509, 245–253 CrossRef CAS PubMed
.
- L. Dai, W. Zhu, L. He, F. Tan, N. Zhu, Q. Zhou, M. He and G. Hu, Bioresour. Technol., 2018, 267, 510–516 CrossRef CAS PubMed
.
Footnote |
| † Electronic supplementary information (ESI) available. See DOI: 10.1039/c8ra09275c |
| This journal is © The Royal Society of Chemistry 2019 |

