 Open Access Article
Three resorcin[4]arene-based lanthanide-coordination polymers with multifunctional photoluminescence sensing properties†
Hang
Zhang
 *a,
Jia-Chen
Wang
a,
Wei
Jiang
b and
Si-Si
Zhao
*a
aInstitute of Catalysis for Energy and Environment, College of Chemistry & Chemical Engineering, Shenyang Normal University, Shenyang, 110034, P. R. China. E-mail: zhangh@synu.edu.cn; zhaoss@synu.edu.cn
bCollege of Environmental Science and Engineering, Jilin Normal University, Siping, 136000, P. R. China
First published on 28th January 2019
Abstract
By utilizing a novel octacarboxylate-functionalized resorcin[4]arene as organic linkers, three lanthanide-coordination polymers, namely, [(CH3)2NH2][Ln2(HL)(H2O)7]·2H2O (Ln = Tb (1), Eu (2) and Gd (3), H8L = 2,8,14,20-tetra-pentyl-4,6,10,12,16,18,22,24-octa-carboxymethoxy-resorcin[4]arene) have been solvothermally synthesized and structurally characterized. Isostructural 1–3 display unique two dimensional sandwich-based layers built with Ln3+ cations and bowl-shaped HL7− anions. Remarkably, 1 and 2 produce intensive green and red emissions respectively and long lifetimes thanks to the antenna effect of HL7− anions. The energy level testing of 3 indicates that the newly designed ligand H8L has a very efficient intersystem crossing process. More importantly, luminescent investigations reveal that 1 and 2 can selectively detect N,N′-dimethylformamide and Fe3+ ions with turn-on-type and turn-off-type responses, respectively.
Introduction
Currently, probing hazardous chemicals, such as volatile organic compounds and metal ionic pollutants is of great importance because it is highly critical in the fields of biology, physiology, pharmacology and environmental sciences.1–3 In light of the impacts that hazardous chemicals have on human health and the environment, developing effective technologies for the sensing of volatile organic compounds and metal ionic pollutants are therefore of global importance and highly necessary.4,5 It needs to be mentioned that fluorometric techniques offer relative ease of use, technical simplicity, and wide applicability, and would likely be preferred during sensing of volatile organic compounds and metal ionic pollutants if available.6,7Emerging as a class of luminescent materials, lanthanide-coordination polymers (Ln-CPs) have afforded a great opportunity in terms of molecular sensing because of their exceptional fluorescent features with narrow emission bands, long emission lifetimes, and high luminescent quantum efficiencies.8–10 So far, fluorescent Ln-CPs have been successfully employed for luminescent sensing of harmful volatile organic compounds, ionic pollutants, pH value, gas and biomarker molecules with a turn-off-type luminescent process.11–14 Most recently, some progress has been achieved in development of turn-on-type Ln-CP luminescent sensors that were utilized to monitor local concentration fluctuations of environmentally hazardous chemicals.15,16 However, single Ln-CP luminescent sensors that discriminate volatile organic compounds and metal ionic pollutants through different response types remain exceedingly rare.17 Thus, it is an active and challenging research field to develop new luminescent Ln-CPs.
Among all lanthanide elements, Tb3+ and Eu3+ could show intense characteristic green and red emissions, respectively, when they are excited by energy transfer from an “antenna” linker to Ln3+ cations under UV irradiation.18,19 Remarkably, during the probing process the bright color changes of green or red could even be observed by the naked eye directly.20 On the other hand, introduction of suitable organic chromophoric sensitizers into Ln-CPs will significantly enhance the light absorption ability and increase the luminescent brightness of Ln3+ cations by “antennae effect”.21 In this regard, resorcin[4]arenes are particularly attractive because of their bodies and rims with various substituents, thus yielding a great diversity of ligands.22,23 Thus far some metal–organic frameworks with fascinating structures and properties have been synthesized by applying the resorcin[4]arene-based ligands.24,25 Remarkably, carboxylate-functionalized resorcin[4]arene ligands have been proven to exhibit strong “antennae effects” in building luminescent Ln-CPs.26,27
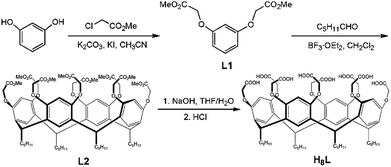
Based on above consideration, we herein report three Ln-CPs, namely, [(CH3)2NH2][Ln2(HL)(H2O)7]·2H2O [Ln = Tb (1), Eu (2), Gd (3)], assembled with a new octacarboxylate-functionalized resorcin[4]arene ligand, 2,8,14,20-tetra-pentyl-4,6,10,12,16,18,22,24-octa-carboxymethoxy-resorcin[4]arene (H8L) (Scheme 1). 1 and 2 emit unique and bright luminescence in visible light region. Most importantly, they could be applied as turn-on-type fluorescent sensors for N,N′-dimethylformamide (DMF) and exhibit selectively fluorescent turn-off responses triggered by Fe3+ ion in comparison to other ions.
Experimental
Materials and general measurements
Commercial chemicals were used as purchased unless otherwise mentioned. FT-IR spectra were determined on a Mattson Alpha Centauri spectrometer. Elemental analysis data were recorded on a Perkin-Elmer Model 240C elemental analyzer. Powder X-ray diffraction (PXRD) patterns were determined on a Rigaku Dmax 2000 X-ray diffractometer using CuKα radiation (λ = 0.154 nm). UV-vis spectra were measured on a Cary TU-1900 doublebeam UV-vis spectrophotometer. Thermogravimetric (TG) data were conducted on a Perkin-Elmer Model TG-7 analyzer under nitrogen gas. Luminescent spectra were performed on a FLSP920 Edinburgh Fluorescence Spectrometer.Synthesis of H8L
The precursor 1,3-bis[(methoxycarbonyl)methoxy]benzene (L1) was synthesized according to the literature procedure.28 A mixture of L1 (2.56 g, 10.0 mmol) and hexaldehyde (1.0 g, 10 mmol) in dichloromethane (30 mL) was stirred at ice bath for 0.5 h with dropwise addition of BF3·OEt2 (6 mL). Then the mixture was stirred at room temperature overnight. The generated solid was collected and washed using CH2Cl2 to give L2 in a yield of 58%. Then sodium hydroxide (1.6 g, 40 mmol), tetrahydrofuran (150 mL), and water (150 mL) were added into L2. The solvents were removed by water bath, and then 100 mL water was added. The pH value of the mixture was adjusted to 1–2 by using HCl (1.0 mol L−1), and solid H8L was achieved in a 64% yield. Anal. calcd. for C64H80O24 (Mr = 1232.50): C, 62.33; H, 6.54; N, 0.00. Found: C, 62.42; H, 6.47; N, 0.00. IR data (KBr, cm−1) for H8L: 3404(s), 2954(m), 2929(w), 2859(m), 2657(w), 2554(w), 1737(w), 1611(s), 1586(s), 1501(w), 1432(m), 1378(m), 1292(m), 1242(s), 1187(s), 1123(s), 1098(s), 1071(s), 972(s), 907(s), 822(s), 726(s), 673(s), 516(s).Synthesis of [(CH3)2NH2][Tb2(HL)(H2O)7]·2H2O (1)
A mixture of H8L (27.0 mg, 0.1 mmol) and TbCl3·6H2O (18.0 mg, 0.048 mmol) was dissolved in a mixed solution of DMF (2 mL) and water (6 mL). Then the suspension was transferred into a Teflon-lined autoclave (15 mL) and heated at 100 °C for 3 days. Colorless crystals of 1 were achieved in a 35% yield based on Tb3+ after cooling the reactor to room temperature. Anal. calcd. for C66H94Tb2NO33 (Mr = 1747.26): C, 45.36; H, 5.42; N, 0.80. Found: C, 45.82; H, 5.60; N, 0.82. IR data (KBr, cm−1): 3750(s), 3525(s), 3325(m), 3249(m), 2929(w), 2856(m), 1711(m), 1583(w), 1507(w), 1454(w), 1427(w), 1375(m), 1331(m), 1298(w), 1257(m), 1188(m), 1119(w), 1071(m), 939(s), 908(s), 852(s), 775(s), 725(m), 680(m), 582(s), 510(s), 413(s).Synthesis of [(CH3)2NH2][Eu2(HL)(H2O)7]·2H2O (2) and [(CH3)2NH2][Gd2(HL)(H2O)7]·2H2O (3)
2 and 3 were synthesized in a similar procedure as 1, in which TbCl3·6H2O was replaced by EuCl3·6H2O (17.0 mg, 0.048 mmol) and GdCl3·6H2O (18.0 mg, 0.048 mmol), respectively. Colorless crystals of 2 and 3 were achieved in 39% and 42% yields, respectively, based on Ln3+ cations. Anal. calcd. for C66H94Eu2NO33 (Mr = 1733.34): C, 45.73; H, 5.46; N, 0.80. Found: C, 45.66; H, 5.88; N, 0.85. IR data (KBr, cm−1) for 2: 3855(s), 3352(m), 2926(w), 2855(m), 1708(m), 1583(w), 1509(w), 1452(w), 1425(w), 1372(s), 1285(w), 1190(m), 1165(s), 1119(m), 1064(m), 962(s), 919(s), 848(s), 720(s), 639(s), 590(s). Anal. calcd. for C66H94Gd2NO33 (Mr = 1743.92): C, 45.45; H, 5.43; N, 0.80. Found: C, 45.30; H, 5.71; N, 0.84. IR data (KBr, cm−1) for 3: 3750(s), 3369(m), 2929(w), 2857(m), 1578(w), 1508(w), 1427(w), 1376(s), 1332 (s), 1295(w), 1189(m), 1120(m), 1071(m), 959(s), 919(s), 848(s), 726(s), 678(s), 584(s), 413(s).Luminescent sensing experiments
Before luminescent determination, the samples of Ln-CPs were ground into powder. Then the suspension was prepared by introducing the powder sample (3 mg) of Ln-CPs into each volatile organic compounds solvent (3 mL) or stock solutions (1 × 10⁻² M, 3 mL) of MClx by ultrasound treatment for 1 min. Each suspension was transferred to a cuvette and tested by luminescent spectrum.Measurement for luminescent sensing of DMF vapor
A small beaker (10 mL) with the samples (10 mg) was placed into a big sealed container (50 mL) with DMF (20 mL) for 24 h or 10 min. Subsequently, the small beaker was taken out from the container and quickly sealed, and the emission spectra were measured by using the solid samples. The initial emission spectrum of the solid sample was measured in a solid sample holder before exposure to DMF vapor.X-ray crystallography
Crystallographic data for 1–3 were determined on an Oxford Diffraction Gemini R Ultra diffractometer using graphite-monochromated Mo-Kα radiation (λ = 0.71073 Å). The structure were solved by direct method and refined on F2 by full-matrix least-squares method using the SHELXL-97 within WINGX.29–31 H atoms of the organic molecules were placed geometrically. Further crystallographic details are listed in Table S1.† Selected bond lengths and angles for 1–3 are listed in Tables S2–S4.†Results and discussion
Crystal structural descriptions of [(CH3)2NH2][Tb2(HL)(H2O)7]·2H2O (1), [(CH3)2NH2][Eu2(HL)(H2O)7]·2H2O (2) and [(CH3)2NH2][Gd2(HL)(H2O)7]·2H2O (3)
1–3 are isostructural and crystallize in the same triclinic space group P![[1 with combining macron]](https://www.rsc.org/images/entities/char_0031_0304.gif) . Herein, we will only describe the structure of 1 in detail (Fig. S1†). One of the most striking features of such Ln-CPs is the presence of numerous coordinated waters around the Ln3+ centers. The asymmetric unit of 1 consists of two Tb3+ cations, one HL7− anion, seven coordinated water molecules, one [H2N(CH3)2]+ cation, and two lattice water molecules (Fig. 1a). Two Tb3+ cations exhibit different coordination spheres. Tb1 is in a distorted square antiprism geometry, surrounded by eight oxygen atoms from two different HL7− anions and three coordinated water molecules. Tb2 is coordinated by nine oxygen atoms from three HL7− anions and four coordinated water molecules in a distorted tricapped trigonal prism sphere. The Tb–O bond distances vary from 2.300(14) to 2.648(17) Å, which are within the normal range.32 One [H2N(CH3)2]+ cation is included as a counter cation to balance the negative charge. Seven carboxylates of each HL7− anion are involved in coordination with five Tb3+ cations. It is noticeable that two HL7− anions form a sandwich-like unit via sharing two Tb1 cations (Fig. 1b). Further, adjacent sandwich-like units are interconnected by Tb2 cations to give a unique two dimensional sandwich-based layer (Fig. 1c).
. Herein, we will only describe the structure of 1 in detail (Fig. S1†). One of the most striking features of such Ln-CPs is the presence of numerous coordinated waters around the Ln3+ centers. The asymmetric unit of 1 consists of two Tb3+ cations, one HL7− anion, seven coordinated water molecules, one [H2N(CH3)2]+ cation, and two lattice water molecules (Fig. 1a). Two Tb3+ cations exhibit different coordination spheres. Tb1 is in a distorted square antiprism geometry, surrounded by eight oxygen atoms from two different HL7− anions and three coordinated water molecules. Tb2 is coordinated by nine oxygen atoms from three HL7− anions and four coordinated water molecules in a distorted tricapped trigonal prism sphere. The Tb–O bond distances vary from 2.300(14) to 2.648(17) Å, which are within the normal range.32 One [H2N(CH3)2]+ cation is included as a counter cation to balance the negative charge. Seven carboxylates of each HL7− anion are involved in coordination with five Tb3+ cations. It is noticeable that two HL7− anions form a sandwich-like unit via sharing two Tb1 cations (Fig. 1b). Further, adjacent sandwich-like units are interconnected by Tb2 cations to give a unique two dimensional sandwich-based layer (Fig. 1c).
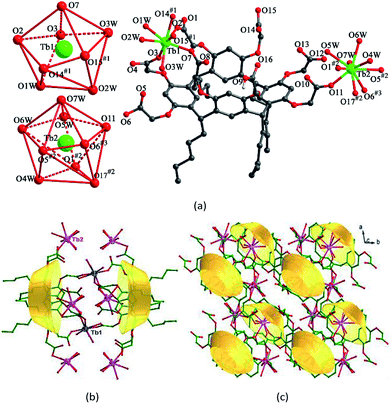 | ||
| Fig. 1 (a) Coordination environments of Tb3+ cations in 1. (b) View of the sandwich unit of 1. (c) Top view of the unique 2D sandwich-based network of 1. | ||
Luminescent properties
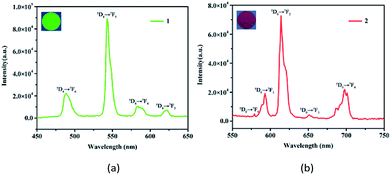
Solid state emission spectra of the free H8L and 1 and 2 were determined at room temperature. For the free H8L, the emission peak at 366 nm (λex = 315 nm) corresponds to the π* → π or π* → n transitions,33 as shown in Fig. S2.† When excited at 295 nm, 1 emits characteristic emission peaks at 488, 543, 584, and 623 nm, which could be ascribed to 5D4 → 7FJ (J = 6–3) transitions of the Tb3+ cations (Fig. 2a).30 The most intense emission at 543 nm is attributed to the 5D4 → 7F5 transition of the Tb3+ cations, resulting in an intense green emission output in the solid state.34 Similarly, 2 exhibits characteristic transitions of the Eu3+ cations upon excitation at 318 nm. As depicted in Fig. 2b, the emission peaks at 579, 593, 614, 651, and 698 nm correspond to the 5D0 → 7FJ (J = 0–4) transitions of the Eu3+ cations.35 Notably, the emission spectrum of 2 is mainly dominated by the 5D0 → 7F2 transition, which is more intense than others, leading to intense red luminescence.36 The bright colors also demonstrate that HL7− acts as an excellent “antenna” linker in the effectively transfer energies to Tb3+ and Eu3+ metals.37Another critical luminescence characteristic of Ln-CPs is the lifetime, which refers to the average time that a molecule stays in its excited state before emitting a photon.38 Hence, the lifetime values of the excited states 5D4 (Tb3+) and 5D0 (Eu3+) of 1 and 2 were monitored with 543 and 614 nm, respectively (Fig. S3†). The observed luminescent decay profiles correspond to single exponential functions, with the lifetimes of τ = 0.730 ms for 1 and τ = 1.242 ms for 2.39 Moreover, the ligand-centered emission is not detected, thus implying the existence of an efficient ligand-to-metal energy-transfer process in these Ln-CPs.40
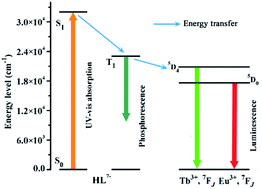
To better understand the energy transfer process, the UV-vis absorption spectrum of 3 was determined in methanol solution at room temperature.41 The wavelength of the absorbance edge is about 312 nm, indicating that HL7− has a singlet state (S1) energy level of 32![[thin space (1/6-em)]](https://www.rsc.org/images/entities/char_2009.gif) 051 cm−1 (Fig. S4a†). The phosphorescent spectrum of 3 was also recorded at 77 K to estimate the triplet state (T1) energy level of HL7−, and obtained the T1 energy level of 22
051 cm−1 (Fig. S4a†). The phosphorescent spectrum of 3 was also recorded at 77 K to estimate the triplet state (T1) energy level of HL7−, and obtained the T1 energy level of 22![[thin space (1/6-em)]](https://www.rsc.org/images/entities/char_2009.gif) 675 cm−1 (Fig. S4b†). According to Reinhoudt's empirical rule, the energy transfer from ligand to metal will become effective when the energy gap between S1 and T1 of the organic linker is at least 5000 cm−1.41 For HL7−, the energy gap between S1 and T1 is 9376 cm−1, implying that the intersystem crossing process is greatly efficient. Generally, to fulfill luminescent Tb- and Eu-CP sensors, the organic ligands should have a suitable T1 in 22
675 cm−1 (Fig. S4b†). According to Reinhoudt's empirical rule, the energy transfer from ligand to metal will become effective when the energy gap between S1 and T1 of the organic linker is at least 5000 cm−1.41 For HL7−, the energy gap between S1 and T1 is 9376 cm−1, implying that the intersystem crossing process is greatly efficient. Generally, to fulfill luminescent Tb- and Eu-CP sensors, the organic ligands should have a suitable T1 in 22![[thin space (1/6-em)]](https://www.rsc.org/images/entities/char_2009.gif) 000–27
000–27![[thin space (1/6-em)]](https://www.rsc.org/images/entities/char_2009.gif) 000 cm−1 to well match their energy levels (5D4, 20
000 cm−1 to well match their energy levels (5D4, 20![[thin space (1/6-em)]](https://www.rsc.org/images/entities/char_2009.gif) 500 cm−1 for Tb3+, and 5D0, 17
500 cm−1 for Tb3+, and 5D0, 17![[thin space (1/6-em)]](https://www.rsc.org/images/entities/char_2009.gif) 500 cm−1 for Eu3+).42 In our case, the T1 energy level of HL7− is 22
500 cm−1 for Eu3+).42 In our case, the T1 energy level of HL7− is 22![[thin space (1/6-em)]](https://www.rsc.org/images/entities/char_2009.gif) 675 cm−1, indicating that HL7− could efficiently sensitize both Eu3+ and Tb3+ emissions.42 The energy transfer process illustrated in Scheme 2 shows ligand-to-metal energy transfers.
675 cm−1, indicating that HL7− could efficiently sensitize both Eu3+ and Tb3+ emissions.42 The energy transfer process illustrated in Scheme 2 shows ligand-to-metal energy transfers.
Luminescent recognition of DMF
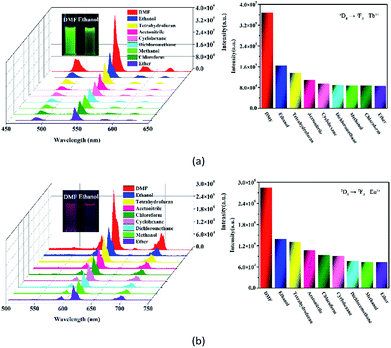
Most recently, volatile organic compounds sensing has gained considerable interest in fundamental and practical research due to their potential applications in optical devices, environmental monitoring, and separation.43,44 To explore the potential applications in this field, luminescent responses of 1 and 2 after incubation in various volatile organic compounds, including chloroform, dichloromethane, ethanol, acetonitrile, tetrahydrofuran, ether, cyclohexane, methanol and DMF, were studied in detail. As shown in Fig. 3, the corresponding luminescence curves still show the four characteristic emission peaks, and only the relative 5D4 → 7F5 or 5D0 → 7F2 transition intensities of 1 and 2 were monitored under the perturbation of various volatile organic compounds. Particularly, DMF triggers a superior luminescent turn-on effect for 1 and 2, while other volatile organic compounds have no significant effect on the emission. Moreover, the inset photographs shows that only DMF can obviously enhance the emission colors of 1 and 2, which leads to brighten under UV light. This finding suggests that 1 and 2 are potential sensing materials for DMF with an excellent selectivity.The obvious emission intensity enhancement of 1 and 2 by displacement in DMF encouraged us to further explore the potential applications of them for probing DMF vapor. In order to test the performance of 1 and 2 as DMF vapor sensor, an in situ solid-state luminescent sensor setup was designed and used (Fig. S5†). The luminescence response of 1 and 2 after incubation for 24 h under DMF vapor were measured and the results are plotted in Fig. 4. The observation indicates 1 and 2 still exhibit a clear enhancement effect. Besides good sensitivity, fast response is also an important criterion for a good sensor. Hence, the solid state emission spectra of 1 and 2 were further determined after exposed in DMF vapor for 10 minutes. Clearly, the response rate of the sensor is quite fast with 88.9% and 89.7% (the relative 5D4 → 7F5 or 5D0 → 7F2 transition intensities) of enhancement achieved compared that after 24 h, rendering 1 and 2 potential sensors for turn-on-type detection of DMF vapor. Moreover, PXRD patterns of 1 and 2 in DMF vapor are nearly identical to the simulated one, suggesting they are stable in the luminescent sensing process (Fig. S6†).
The emission intensity of the Ln3+ is well-known to rely on the energy transfer efficiency from the ligand to the Ln3+ center.45 Meanwhile, the interactions with the O–H bond of coordinated water may lead to quenching of Ln3+ luminescence.45 DMF has a more strong coordination ability compared to other volatile organic compound. When coordinated waters are partially changed by DMF, the O–H bonds surrounding the Ln3+ centers may leave fewer and thus enhance Ln3+ emission. Hence, we infer that the marked enhancement of their emission intensities in response to DMF is likely caused by the displacement of coordinated water molecules by DMF molecules.
Selective sensing of Fe3+ ion
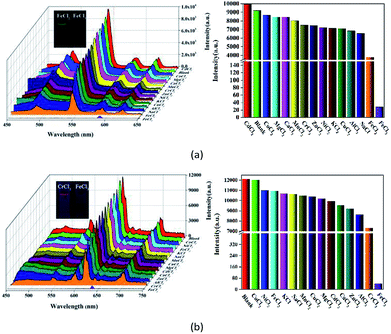
Metal ion sensing and detection play a significant role in environment and life science.46–48 In this study, we also investigated luminescent 1 and 2 to sense metal ionic pollutants. The crystalline samples were simply soaked in aqueous solutions of MClx (M = Na+, K+, Ca2+, Cd2+, Zn2+, Mn2+, Ni2+, Mg2+, Co2+, Al3+, Cu2+, Cr3+ Fe2+ and Fe3+, 1 × 10⁻² M) for luminescence studies. As depicted in Fig. 5, the corresponding luminescence curves still show the four characteristic emission peaks, and only the relative 5D4 → 7F5 or 5D0 → 7F2 transition intensities for 1 and 2 were monitored under the perturbation of various cations. Interestingly, Fe3+ exhibits a pronounced quenching effect on the luminescence of 1 and 2, while other metal ions have no significant effect with the exception of Fe2+ or Cr3+, which can weaken the luminescence to some extent. Moreover, the inset photographs show that only Fe3+ can completely quench the emission colors of 1 and 2, which leads to the dark under UV light. The above phenomenon indicate that 1 and 2 may be considered as a promising luminescent probe for Fe3+ ions.To further prove the luminescent quenching by Fe3+ ion, concentration-dependent luminescent studies for 1 and 2 were carried out in the presence of Fe3+ ion. As demonstrated in Fig. 6, the emission intensity for the suspension of 1 and 2 sharply declines with the increase of Fe3+ concentration from 0 to 5000 μM. At the Fe3+ content of 5 × 10⁻³ M, the fluorescence intensity of 1 and 2 completely disappeared. Quantitatively, the Stern–Volmer equation I0/I = 1 + Ksv[M] can be used to describe this quenching effect, where the values I0 and I represent the luminescent intensities of 1 without and with addition of Fe3+, respectively, [M] is the concentration of Fe3+, and Ksv is the quenching constant. Based on the quenching experimental data, the Ksv value is calculated to be 1.545 × 10⁴, suggesting a strong quenching effect on the luminescence of 1. The calculated linear correlation coefficient (R) in the Ksv curve of 1 with addition of Fe3+ is 0.99685, demonstrating that the quenching effect of Fe3+ on the luminescence of 1 fits the Stern–Volmer model. The suspension of 2 also exhibits the similar selective sensing of Fe3+ ion. The calculated Ksv value is 3.93 × 10⁴ based on the Stern–Volmer equation, demonstrating a quenching effect on the fluorescence of 2. Besides, a good linear relationship is achieved with the coefficient of 0.96502 (Fig. S7†).
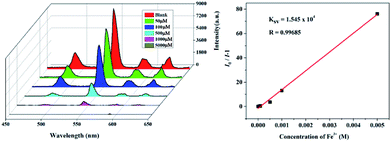 | ||
| Fig. 6 Emission spectra and linear relationship for 1 in aqueous solution of different concentrations of Fe3+. | ||
To understand the mechanism of the fluorescence quenching effect of 1 and 2 toward Fe3+ ions the UV/vis absorption data of 1 and 2 and varied metal ions were carried out. The UV/vis absorption spectra show that the wide absorption band from 260 to 400 nm of Fe3+ covers the range of absorption bands of 1 and 2, and is much more stronger than those of other metal ions (Fig. S8†). This means that the UV/vis absorption of Fe3+ upon excitation may prevent the absorption of 1 and 2, and result in the decrease or quenching of the luminescence.49,50
Conclusions
In summary, we reported three Ln-CPs assembled with a new octacarboxylate-functionalized resorcin[4]arene ligand and Ln3+ cations. 1 and 2 emit intense characteristic red and green emission colors. The photophysical properties demonstrated that H8L is well suited for the sensitization of Tb3+ and Eu3+ emissions thanks to the favorable energy level of its triplet state. 1 and 2 could be employed as potential turn-on-type fluorescent sensors for DMF and turn-off-type luminescent probe for Fe3+ ion.Conflicts of interest
There are no conflicts to declare.Acknowledgements
We appreciate support from Prof. Jian-Fang Ma (the National Natural Science Foundation of China (Grant No. 21471029)) for experimental measurements. PhD startup fund of Shenyang Normal University is gratefully acknowledged (054/91800161006).Notes and references
- H. Wang, W. P. Lustig and J. Li, Chem. Soc. Rev., 2018, 47, 4729–4756 RSC.
- D. Wu, A. C. Sedgwick, T. Gunnlaugsson, E. U. Akkaya, J. Yoon and T. D. James, Chem. Soc. Rev., 2017, 46, 7105–7123 RSC.
- B. Wang, X. L. Lv, D. Feng, L. H. Xie, J. Zhang, M. Li, Y. Xie, J. R. Li and H. C. Zhou, J. Am. Chem. Soc., 2016, 138, 6204–6216 CrossRef CAS.
- Y. Zhang, S. Yuan, G. Day, X. Wang, X. Yang and H.-C. Zhou, Coord. Chem. Rev., 2018, 354, 28–45 CrossRef CAS.
- X. L. Yang, X. Chen, G. H. Hou, R. F. Guan, R. Shao and M. H. Xie, Adv. Funct. Mater., 2016, 26, 393–398 CrossRef CAS.
- W. P. Lustig, S. Mukherjee, N. D. Rudd, A. V. Desai, J. Li and S. K. Ghosh, Chem. Soc. Rev., 2017, 46, 3242–3285 RSC.
- M. Rieger, M. Wittek, P. Scherer, S. Löbbecke and K. Müller-Buschbaum, Adv. Funct. Mater., 2018, 28, 1704250 CrossRef.
- Y. Cui, J. Zhang, H. He and G. Qian, Chem. Soc. Rev., 2018, 47, 5740–5785 RSC.
- T. N. Nguyen, G. Capano, A. Gładysiak, F. M. Ebrahim, S. V. Eliseeva, A. Chidambaram, B. Valizadeh, S. Petoud, B. Smit and K. C. Stylianou, Chem. Commun., 2018, 54, 6816–6819 RSC.
- C. Y. Chow, S. V. Eliseeva, E. R. Trivedi, T. N. Nguyen, J. W. Kampf, S. Petoud and V. L. Pecoraro, J. Am. Chem. Soc., 2016, 138, 5100–5109 CrossRef CAS.
- S. Wu, Y. Lin, J. Liu, W. Shi, G. Yang and P. Cheng, Adv. Funct. Mater., 2018, 28, 1707169 CrossRef.
- J. N. Hao and B. Yan, Nanoscale, 2016, 8, 12047–12053 RSC.
- B. Yan, Acc. Chem. Res., 2017, 50, 2789–2798 CrossRef CAS.
- L. Li, J. Cheng, Z. Liu, L. Song, Y. You, X. Zhou and W. Huang, ACS Appl. Mater. Interfaces, 2018, 10, 44109–44115 CrossRef CAS PubMed.
- P. Harvey, A. Nonat, C. Platas-Iglesias, L. S. Natrajan and L. J. CharbonniHre, Angew. Chem., Int. Ed., 2018, 57, 9921–9924 CrossRef CAS.
- B. Liu, H. Shen, Y. Hao, X. Zhu, S. Li, Y. Huang, P. Qu and M. Xu, Anal. Chem., 2018, 90, 12449–12455 CrossRef CAS.
- S. Anbu, R. Ravishankaran, M. F. C. G. da Silva, A. A. Karande and A. J. L. Pombeiro, Inorg. Chem., 2014, 53, 6655–6664 CrossRef CAS PubMed.
- R. F. Bogale, Y. Chen, J. Ye, Y. Yang, A. Rauf, L. Duan, P. Tian and G. Ning, Sens. Actuators, B, 2017, 245, 171–178 CrossRef CAS.
- S. N. Zhao, L. J. Li, X. Z. Song, M. Zhu, Z. M. Hao, X. Meng, L. L. Wu, J. Feng, S. Y. Song, C. Wang and H. J. Zhang, Adv. Funct. Mater., 2015, 25, 1463–1469 CrossRef CAS.
- D. Zhao, D. Yue, L. Zhang, K. Jiang and G. Qian, Inorg. Chem., 2018, 57, 12596–12602 CrossRef CAS.
- Q. Zhang, J. Wang, A. M. Kirillov, W. Dou, C. Xu, C. Xu, L. Yang, R. Fang and W. Liu, ACS Appl. Mater. Interfaces, 2018, 10, 23976–23986 CrossRef CAS.
- B.-B. Lu, W. Jiang, J. Yang, Y.-Y. Liu and J.-F. Ma, ACS Appl. Mater. Interfaces, 2017, 9, 39441–39449 CrossRef CAS.
- Q.-Y. Zhai, J. Su, T.-T. Guo, J. Yang, J.-F. Ma and J.-S. Chen, Cryst. Growth Des., 2018, 18, 6046–6053 CrossRef CAS.
- W.-Y. Pei, G. Xu, J. Yang, H. Wu, B. Chen, W. Zhou and J.-F. Ma, J. Am. Chem. Soc., 2017, 139, 7648–7656 CrossRef CAS.
- B.-B. Lu, J. Yang, G.-B. Che, W.-Y. Pei and J.-F. Ma, ACS Appl. Mater. Interfaces, 2018, 10, 2628–2636 CrossRef CAS.
- S. T. Zhang, J. Yang, H. Wu, Y. Y. Liu and J. F. Ma, Chem.–Eur. J., 2015, 21, 15806–15819 CrossRef CAS.
- X. Han, J. Yang, Y.-Y. Liu and J.-F. Ma, Dyes Pigm., 2019, 160, 492–500 CrossRef CAS.
- H. Zhang, J. Yang, Y. Y. Liu, S. Song and J. F. Ma, Cryst. Growth Des., 2016, 16, 3244–3255 CrossRef CAS.
- G. M. Sheldrick, SHELXS-97, programs for X-ray crystal structure solution, University of Göttingen, Göttingen, Germany, 1997 Search PubMed.
- G. M. Sheldrick, SHELXL-97, programs for X-ray crystal structure refinement, University of Göttingen, Göttingen, Germany, 1997 Search PubMed.
- L. J. Farrugia, WINGX, a windows program for Crystal Structure Analysis, University of Glasgow, Glasgow, UK, 1988 Search PubMed.
- P. Wu, J. Wang, Y. Li, C. He, Z. Xie and C. Duan, Adv. Funct. Mater., 2011, 21, 2788–2794 CrossRef CAS.
- P. P. Cui, Y. Zhao, X. D. Zhang, P. Wang and W. Y. Sun, Dyes Pigm., 2016, 124, 241–248 CrossRef CAS.
- Y. Cui, B. Chen and G. Qian, Coord. Chem. Rev., 2014, 273, 76–86 CrossRef.
- J. Sahoo, R. Arunachalam, P. S. Subramanian, E. Suresh, A. Valkonen, K. Rissanen and M. Albrecht, Angew. Chem., Int. Ed., 2016, 55, 9625–9629 CrossRef CAS.
- A. D. Bettencourt-Dias, P. S. Barber and S. Bauer, J. Am. Chem. Soc., 2012, 134, 6987–6994 CrossRef.
- W. Wang, R. Wang, Y. Ge and B. Wu, RSC Adv., 2018, 8, 42100–42108 RSC.
- D. Ananias, F. A. A. Paz, D. S. Yufit, L. D. Carlos and J. Rocha, J. Am. Chem. Soc., 2015, 137, 3051–3058 CrossRef CAS.
- C.-L. Tao, Y.-M. Ying, H. Wang, B. Chen, G.-P. Zhu, Y.-J. Song, X.-G. Liu, Z. Zhao, L. Shen and B. Z. Tang, J. Mater. Chem. C, 2018, 6, 12371–12376 RSC.
- C. Zhan, S. Ou, C. Zou, M. Zhao and C. D. Wu, Anal. Chem., 2014, 86, 6648–6653 CrossRef CAS.
- C. Gao, A. M. Kirillov, W. Dou, X. Tang, L. Liu, X. Yan, Y. Xie, P. Zang, W. Liu and Y. Tang, Inorg. Chem., 2014, 53, 935–942 CrossRef CAS.
- J. M. Zhou, H. H. Li, H. Zhang, H. M. Li, W. Shi and P. Cheng, Adv. Mater., 2015, 27, 7072–7077 CrossRef CAS.
- X. Yan, H. Wang, C. E. Hauke, T. R. Cook, M. Wang, M. L. Saha, Z. X. Zhou, M. M. Zhang, X. P. Li, F. H. Huang and P. J. Stang, J. Am. Chem. Soc., 2015, 137, 15276–15286 CrossRef CAS.
- S. Rochat and T. M. Swager, Angew. Chem., Int. Ed., 2014, 53, 9792–9796 CrossRef CAS PubMed.
- Y. Li, S. Zhang and D. Song, Angew. Chem., Int. Ed., 2013, 52, 710–713 CrossRef CAS.
- H. Xu, H.-C. Hu, C.-S. Cao and B. Zhao, Inorg. Chem., 2015, 54, 4585–4587 CrossRef CAS.
- S.-Q. Lu, Y.-Y. Liu, Z.-M. Duan, Z.-X. Wang, M.-X. Li and X. He, Cryst. Growth Des., 2018, 18, 4602–4610 CrossRef CAS.
- Q. Zhang, J. Wang, A. M. Kirillov, W. Dou, C. Xu, L. Yang, R. Fang and W. Liu, ACS Appl. Mater. Interfaces, 2018, 10, 23976–23986 CrossRef CAS.
- D. Zhao, X.-H. Liu, Y. Zhao, P. Wang, Y. Liu, M. Azam, S. I. Al-Resayes, Y. Lu and W.-Y. Sun, J. Mater. Chem. A, 2017, 5, 15797–15807 RSC.
- S.-S. Zhao, J. Yang, Y.-Y. Liu and J.-F. Ma, Inorg. Chem., 2016, 55, 2261–2273 CrossRef CAS.
Footnote |
| † Electronic supplementary information (ESI) available: X-ray crystallographic data in CIF format, TGA, PXRD, luminescent spectra and tables. CCDC 1581287–1581289. For ESI and crystallographic data in CIF or other electronic format see DOI: 10.1039/c8ra09777a |
| This journal is © The Royal Society of Chemistry 2019 |

