Development of complex magnesium fluoro aluminates via the fluorolytic sol–gel synthesis
Florian
Schütz
,
Maximilian
Bäthge
,
Kerstin
Scheurell
,
Gudrun
Scholz
,
Michael
Feist
and
Erhard
Kemnitz
 *
*
Humboldt-Universität zu Berlin, Department of Chemistry, 12489, Germany. E-mail: erhard.kemnitz@chemie.hu-berlin.de
First published on 27th November 2017
Abstract
The diverse industry for optical applications demands materials with many exceptional properties, which often can only be ensured by the development of novel compounds. Specifically, the stability towards abrasion or moisture should go hand in hand with optical characteristics like a low refractive index or high transmittance. Hence, we present fluorolytic sol–gel syntheses of complex magnesium fluoro aluminates and examine resulting layer applicability. Using 19F static as well as 19F MAS NMR, XRD, and TG/DTA analysis, miscellaneous synthetic methods concerning different molar ratios between Mg and Al were discussed. We determine that two phases are predominantly in xerogels employing the sol–gel synthesis: MgAlF5·2H2O as well as MgAl2F8·2H2O. In addition, the formation of strongly disordered structures can be observed within the sol. Furthermore, thermal treatment induces a decomposition of the complex to the particular compounds, MgF2 and AlF3. Layers, which were applied by dip coating, show antireflective behavior and vastly increased stability towards moisture.
1. Introduction
The fluorolytic sol–gel process is a well-known synthetic method, enabling easy access to nanosized metal fluoride particles in a solvent.1 In contrast to the hydrolytic sol–gel synthesis, metal alkoxide precursors are reacted with anhydrous HF, leading to the formation of amorphous nanoparticles (eqn (1)). Bridging effects of the fluorine atoms between the metal centers can build up a three-dimensional network, and in addition, cause its stability.1| M(OR)x + yHF → MFy + xROH | (1) |
Interestingly, several complex magnesium fluoroaluminates, exhibiting a low refractive index and insolubility in water, are described in the literature.6E.g., MgAlF5·2H2O occurs as the mineral Leonardsenite and has been found as a new species from the Eldfell Volcano, Iceland.11 In addition, the water free counterpart MgAlF5 as well as MgAl2F8·2H2O, can be obtained by hydrothermal synthesis.12,13
So far, colloidal solutions (sols) of these complex compounds, as they are needed for AR-coating processes, have never been described, although there are several investigations concerning different MIIAlF5 analogs, especially experimental NMR data of Mg-containing fluoroaluminates, which all were obtained either via high temperature solid state or hydrothermal reactions.14–17 Thus, here we report for the first time about the successful access of clear sols of magnesium fluoroaluminates that can be applied for AR-coating processes.
2. Methods and experimental
2.1 Methods and instruments
Concerning the fact of missing availability of experimental NMR data, we decided to calculate 19F chemical shifts of the compounds by the superposition model. The calculation tool used was adapted by Bureau et al. and compared with obtained experimental data.18 All calculations were referred to pure fluorides; therefore, Sl had been determined empirically (Table 1).19 In addition to that, all bond lengths of the compounds were taken from WEIL et al. (Table 2).11–13 Due to missing information about Al and αl, the influence of protons of hydrate containing analogs were neglected.| # | Mn+ | d PureF(M–F) [Å] | A l (× 10−3) | α l | δ exp. (19F, CCl3F) [ppm] | S l |
|---|---|---|---|---|---|---|
| 1 | Mg2+ | 1.991 | 159 | 3.428 | −196.1 | −32.5 |
| 2 | Al3+ | 1.797 | 114 | 3.521 | −171.6 | −61.0 |
| # | Compound | M–Fx | Bond length [Å] |
|---|---|---|---|
| 1 | MgAlF5·2H2O | Al–F1 | 1.7787 |
| 2 | Al–F2 | 1.8422 | |
| 3 | Mg–F1 | 1.9814 | |
| 4 | MgAlF5 | Al–F1 | 1.7443 |
| 5 | Al–F2 | 1.7715 | |
| 6 | Al–F3 | 1.7757 | |
| 7 | Mg–F1 | 1.8897 | |
| 8 | Mg–F3 | 2.1890 | |
| 9 | MgAl2F8·2H2O | Al–F1 | 1.7830 |
| 10 | Al–F2 | 1.8224 | |
| 11 | Al–F3 | 1.8173 | |
| 12 | Mg–F1 | 1.9581 |
19F solid state NMR data were measured with a Bruker Advance 400 MHz spectrometer. All dried powder samples were filled into 2.5 mm ZrO2 rotors and the main rotation frequency was applied at 20 kHz. Referred to δ = 0 ppm of CFCl3 (using α-AlF3 as the secondary standard for calibration) and with a D1 time of 5 s, every spectrum consists of 32 scans. Non-rotating samples of liquid sols were measured in 4 mm rotors and referred to δ = 0 ppm of CFCl3 as well (using C6F6 as the secondary standard for calibration). Depending on necessity, 19F MAS NMR spectra were simulated using the dmfit program.24 Powder diffraction analysis was done by a Seifert XRD 3003 TT with rotating sample holder using Cu radiation (Cu Kα1,2; λ = 1.54 Å; U = 40 kV; I = 40 mA; Ni filter). All samples were measured in Bragg–Brentano geometry and results compared to powder diffraction files of COD-inorganic. To understand thermal behavior more precisely, a Netzsch STA 409 C was used to determine mass loss as well as phase transitions/decomposition within the complexes. Therefore, a DTA/TG sample holder system (Pt/PtRh10 thermal element) with a constant stream of synthetic air was used during thermal treatment up to 1200 °C.
To fabricate thin films from nanoscopic dispersions, float glasses (40 mm × 20 mm × 3 mm) were coated by dip coating. Obtained layers were heated up to 450 °C with a heating rate (HR) of 10 K min−1, and kept at this temperature for 15 min. Afterwards, layer thickness (d), reflection (Rmin), transmission (Tmax), and refractive index n, using a FILMetrics Thin Film Analyzer F10-RT, were determined. Spectra were measured in a wavelength range of λ = 400–1050 nm. The F10-RT uses a collimated light beam of 6 mm in perpendicular incidence and reflection is measured specular. Without using an integrating sphere, transmission is determined directly by light passing the sample at an angle of 0°.
2.2 Experimental
| Compound | Concentration/purity | Supplier |
|---|---|---|
| Mg(OEt)2 | 99.8% | EVONIK Industries |
| MgCl2 | Anhydrous, ≥98% | Aldrich |
| Al(OiPr)3 | ≥98% | Aldrich |
| HF | Anhydrous, pure | Solvay |
| MeOH | ≥99.6% | Aldrich |
| HFMeOH | 20.53 mol l−1 | — |
Sol. 100 ml MeOH and 9.74 ml HFMeOH (0.2 mol) were added in a 250 ml PP bottle. 8.17 g Al(OiPr)3 (0.04 mol) were added under stirring. After 5 min, a clear solution of Hx[AlFy] was obtained. In an extra PP bottle, 3.89 g Mg(OEt)2 (0.034 mol) and 0.57 g MgCl2 (0.006 mol) were dissolved in 77 ml MeOH. The grey solution of the Mg precursors was transferred into the Hx[AlFy] solution under heavy stirring. Within a few seconds, a clear and colorless sol with low viscosity (η = 0.844 mPa s) was obtained.
Xerogel. 40 ml of MgAlF5 sol were put into a glass flask. The solvent was removed under vacuum and the obtained powder was divided into four parts, which were thermally treated at different temperatures.
Sol. 100 ml MeOH and 9.09 ml HFMeOH (0.19 mol) were added in a 250 ml PP bottle. 5.45 g Al(OiPr)3 (0.027 mol) were added under stirring. After 5 min, a clear solution of Hx[AlFy] was obtained. In an extra PP bottle, 5.19 g Mg(OEt)2 (0.045 mol) and 0.76 g MgCl2 (0.008 mol) were dissolved in 77 ml MeOH. The grey solution of the Mg precursors was transferred into the Hx[AlFy] solution under heavy stirring. Within a few seconds, a clear and colorless sol with low viscosity (η = 1.038 mPa s) was obtained.
Xerogel. 40 ml of MgAlF5 sol were put into a glass flask. The solvent was removed under vacuum and the obtained powder was divided into four parts, which were thermally treated at different temperatures.
Sol. 100 ml MeOH and 10.39 ml HFMeOH (0.21 mol) were added in a 250 ml PP bottle. 10.89 g Al(OiPr)3 (0.053 mol) were added under stirring. After 5 min, a clear solution of Hx[AlFy] was obtained. In an extra PP bottle, 2.59 g Mg(OEt)2 (0.023 mol) and 0.38 g MgCl2 (0.004 mol) were dissolved in 77 ml MeOH. The grey solution of the Mg precursors was transferred into the Hx[AlFy] solution under heavy stirring. Within a few seconds, a clear and colorless sol with low viscosity (η = 1.865 mPa s) was obtained.
Xerogel. 40 ml of MgAlF5 sol were put into a glass flask. The solvent was removed under vacuum and the obtained powder was divided into four parts, which were thermally treated at different temperatures.
3. Results and discussion
3.1 General results
Concerning to the theoretical equation of the fluorolytic sol–gel synthesis, reactions can be described as follows:| Al(OiPr)3 + 0.7Mg(OEt)2 + 0.3MgCl2 + 5HF → MgAlF5 + 3iPrOH + 1.4EtOH + 0.6HCl |
| Al(OiPr)3 + 1.4Mg(OEt)2 + 0.6MgCl2 + 7HF → Mg2AlF7 + 3iPrOH + 2.8EtOH + 1.2HCl |
| 2Al(OiPr)3 + 0.7Mg(OEt)2 + 0.3MgCl2 + 8HF → MgAl2F8 + 6iPrOH + 1.7EtOH + 0.3HCl |
The obtained sols of magnesium fluoro aluminates of different molar Mg![[thin space (1/6-em)]](https://www.rsc.org/images/entities/char_2009.gif) :
:![[thin space (1/6-em)]](https://www.rsc.org/images/entities/char_2009.gif) Al-ratios (Mg
Al-ratios (Mg![[thin space (1/6-em)]](https://www.rsc.org/images/entities/char_2009.gif) :
:![[thin space (1/6-em)]](https://www.rsc.org/images/entities/char_2009.gif) Al; 1
Al; 1![[thin space (1/6-em)]](https://www.rsc.org/images/entities/char_2009.gif) :
:![[thin space (1/6-em)]](https://www.rsc.org/images/entities/char_2009.gif) 1, 2
1, 2![[thin space (1/6-em)]](https://www.rsc.org/images/entities/char_2009.gif) :
:![[thin space (1/6-em)]](https://www.rsc.org/images/entities/char_2009.gif) 1, 1
1, 1![[thin space (1/6-em)]](https://www.rsc.org/images/entities/char_2009.gif) :
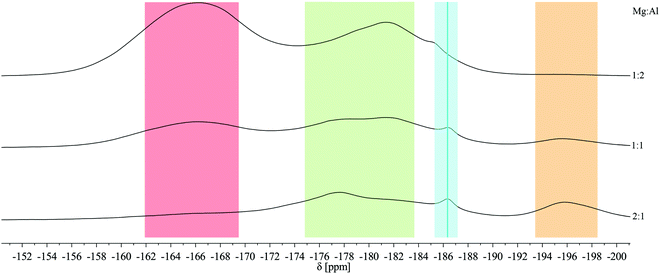
:![[thin space (1/6-em)]](https://www.rsc.org/images/entities/char_2009.gif) 2) show similarities in the static 19F solid state NMR spectra in comparison with the pure fluorides AlF3 (red) and MgF2 (orange) (Fig. 1). In addition, signals in the range between −175 ppm and −184 ppm (green) appear and can be assigned to fluorine sites surrounded by both, magnesium and aluminum. This leads to the conclusion that a formation of complex species has taken place and that fluorine centers like FMg6−yAly (y = 1, 2, 3) are present within the structure.20 Moreover, the chemical shift is also influenced by oxygen in the nearest coordination sphere, which is often observed by using metal alkoxides as precursors.1,21 A tiny signal of adsorbed HF molecules can additionally be found at −186.4 ppm (light blue).9
2) show similarities in the static 19F solid state NMR spectra in comparison with the pure fluorides AlF3 (red) and MgF2 (orange) (Fig. 1). In addition, signals in the range between −175 ppm and −184 ppm (green) appear and can be assigned to fluorine sites surrounded by both, magnesium and aluminum. This leads to the conclusion that a formation of complex species has taken place and that fluorine centers like FMg6−yAly (y = 1, 2, 3) are present within the structure.20 Moreover, the chemical shift is also influenced by oxygen in the nearest coordination sphere, which is often observed by using metal alkoxides as precursors.1,21 A tiny signal of adsorbed HF molecules can additionally be found at −186.4 ppm (light blue).9
Although the formation of non-hydrated, water-free MgAlF5 is expected to occur in the absence of water within the sol, we could not prove this by comparing experimental with simulated spectra due to insufficient evidence. The structure of MgAlF5 consists of corner-shared [AlF6] and [MgF6] octahedrons (Fig. 2).12 This leads to alternating stacked layers and three different F sites within the structure (Table 1).12 The calculated signals at −158.6 ppm (F2), −174.3 ppm (F1), and −195.0 ppm (F3) do not fit well to experimental data, especially compared to the ratio Mg![[thin space (1/6-em)]](https://www.rsc.org/images/entities/char_2009.gif) :
:![[thin space (1/6-em)]](https://www.rsc.org/images/entities/char_2009.gif) Al 1
Al 1![[thin space (1/6-em)]](https://www.rsc.org/images/entities/char_2009.gif) :
:![[thin space (1/6-em)]](https://www.rsc.org/images/entities/char_2009.gif) 1 (Fig. 3). Nevertheless, a formation of strongly disordered MgAlF5 cannot be excluded though.
1 (Fig. 3). Nevertheless, a formation of strongly disordered MgAlF5 cannot be excluded though.
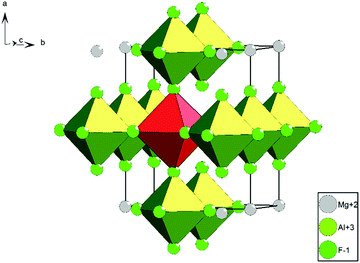 | ||
| Fig. 2 Crystal structure of MgAlF5; green = [AlF6]; red = [MgF6].12 | ||
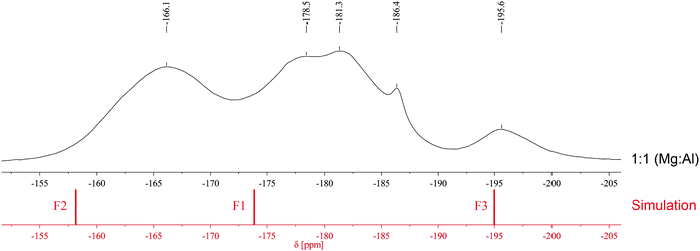 | ||
Fig. 3 Comparison of experimental (black, molar ratio 1![[thin space (1/6-em)]](https://www.rsc.org/images/entities/char_2009.gif) : :![[thin space (1/6-em)]](https://www.rsc.org/images/entities/char_2009.gif) 1) and calculated (red) 19F solid state NMR spectra of MgAlF5. 1) and calculated (red) 19F solid state NMR spectra of MgAlF5. | ||
3.2 Xerogels of molar ratio 1![[thin space (1/6-em)]](https://www.rsc.org/images/entities/h3_char_2009.gif) :
:![[thin space (1/6-em)]](https://www.rsc.org/images/entities/h3_char_2009.gif) 1 (Mg
1 (Mg![[thin space (1/6-em)]](https://www.rsc.org/images/entities/h3_char_2009.gif) :
:![[thin space (1/6-em)]](https://www.rsc.org/images/entities/h3_char_2009.gif) Al)
Al)
To get a more precise insight of structural information, xerogels were prepared by evaporating the solvents. Measured 19F MAS NMR data of the non-annealed (“as prepared”) xerogel (xerogel 1) does not fit very well to calculated 19F NMR spectra of MgAlF5, but to MgAlF5·2H2O. In general, the structure of MgAlF5·2H2O contains chains of slightly distorted [AlF6] octahedrons which are connected via [Mg(H2O)2F4] octahedrons (Fig. 4), and thus, there are two different F sites.11 As mentioned before, we neglected the influence of the protons in our calculations. Moreover, the deshielding effects of the cations in structures like AIIBIIIX2A+3B depend on both, the electronic overlap as well as the cation–cation interaction.22 In contrast to simulations of other compounds in the literature, we did not adjust Δ values to fit the simulation. Therefore, 19F chemical shifts differ from the measured spectra in a range of 22 ppm and were moved for a graphical description (Fig. 5a). The two main signals occur at −173.2 ppm (F1, calc.: −173.1 ppm) and −164.3 ppm (F2, calc.: −167.1) (Table 4 and Fig. 5a, xerogel 1). In addition to the position of the signals, integrals are nearly comparable as well (F2![[thin space (1/6-em)]](https://www.rsc.org/images/entities/char_2009.gif) :
:![[thin space (1/6-em)]](https://www.rsc.org/images/entities/char_2009.gif) F1 = 1
F1 = 1![[thin space (1/6-em)]](https://www.rsc.org/images/entities/char_2009.gif) :
:![[thin space (1/6-em)]](https://www.rsc.org/images/entities/char_2009.gif) 4). This finally shows, that neither MgAlF5 nor MgAlF5·2H2O are formed within the sol but formation of MgAlF5·2H2O is initiated by evaporating the solvent. However, it is necessary to state, that the presence of pure species or high ordered structures can almost be denied. This leads to ranges of broad signals close to both main signals (Fig. 5a, F2: light green, F1: dark green). Unfortunately, we were not able to get information from XRD because of the amorphous character of the unnealed xerogel.
4). This finally shows, that neither MgAlF5 nor MgAlF5·2H2O are formed within the sol but formation of MgAlF5·2H2O is initiated by evaporating the solvent. However, it is necessary to state, that the presence of pure species or high ordered structures can almost be denied. This leads to ranges of broad signals close to both main signals (Fig. 5a, F2: light green, F1: dark green). Unfortunately, we were not able to get information from XRD because of the amorphous character of the unnealed xerogel.
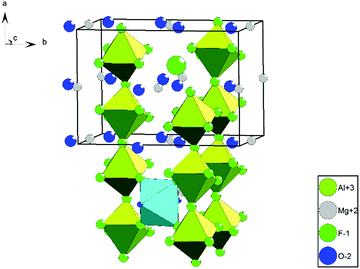 | ||
| Fig. 4 Crystal structure of MgAlF5·2H2O; green = [AlF6]; cyan = [Mg(H2O)2F4]; protons are not shown.12 | ||
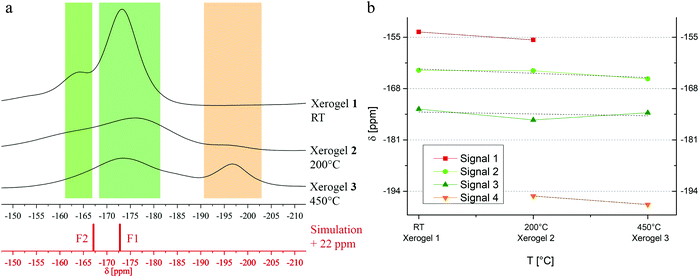 | ||
| Fig. 5 (a) Comparison between 19F MAS NMR spectra of xerogels 1–3 and simulation of the two main signals in MgAlF5·2H2O. (b) Progress of signal shifting in dependence of temperature in xerogels 1–3. | ||
| # | T treatm [°C] | Remark | δ exp. (19F) [ppm] | δ theor. (19F) [+22 ppm] |
|---|---|---|---|---|
| Xerogel 1 | — | Not annealed | −173.2 | −173.1 |
| −164.3 | −167.1 | |||
| (−153.7) | ||||
| Xerogel 2 | 200 | — | −175.8 | −173.1 |
| −163.0 | −167.1 | |||
| (−195.6) | ||||
| (−153.4) | ||||
| Xerogel 3 | 450 | — | −173.9 | −173.1 |
| −163.3 | −167.1 | |||
| (−197.4) | ||||
Consequently, xerogels were thermally treated at 200 °C (xerogel 2) to enforce crystallization and at 450 °C (xerogel 3) to estimate and to compare to fluoride phases within AR-layers. Concerning thermal impact, we could not find structural changes at 200 °C, meaning, main signals in 19F MAS NMR do not alter significantly (Fig. 5a, xerogel 2). If however, temperature increases up to 450 °C, an intense signal at −197.4 ppm appears, pointing out the formation of MgF2, thus indicating a beginning thermal decomposition of the complex into AlF3 and MgF2 (Fig. 5a, xerogel 3, orange). To trace the progress of signal shifting or evolution, the particular signals are plotted with the help of dmfit (Fig. 5b). In addition to the main signals at −173.2 ppm and −164.3 ppm, a small but broad signal can be observed at −153.7 ppm (xerogel 1, red) indicating fluorine containing species like AlFx(OiPr)3−x.23 With increasing temperature, the signal shifts towards a lower frequency, which is caused by less oxygen in the nearest coordination sphere (xerogel 2).23 At 450 °C, a partly fluorinated aluminum center cannot be determined any longer. This low-frequency-shifting evolution can also be found while comparing xerogel 2 and 3. Illustrating the formation of an [FMg3]OxFy species at −195.2 ppm (xerogel 2, orange) the observed signal is shifted to −197.4 ppm at 450 °C.20 The position of the two main signals remains constant in a rough estimation (light green, dark green).
Fortunately, annealed samples show increased crystallinity and, hence, structural information can be gained from XRD (Fig. 6a). To ensure a good comparability, samples were matched with powder the diffraction file of ZnFeF5·2H2O (pdf: 78-2142, calc.), which is isostructural to MgAlF5·2H2O. It can be seen, that MgAlF5·2H2O is the predominant phase in xerogel 2 and 3. Small shifts in the signal position can be traced back to differences in cell unit volumes (V(MgAlF5·2H2O) = 485.73 Å3, V(ZnFeF5·2H2O) = 530.66 Å3). In comparison to 19F MAS NMR spectra of xerogel 3, the observed decomposition could not be confirmed by XRD. This might be due to the amorphousness of MgF2 whereby its signal is suppressed by the intensity of the complex and cannot be seen. To understand the thermal decomposition more precisely, we decided to trace the evolution of the complex in dependence of the temperature via DTA/TG (Fig. 6c). Within the first 200 °C, a mass loss of almost 25% can be observed, which is caused by the evaporation of organic residues, like EtOH or iPrOH. Since alkoxides were used in synthesis, partly unconverted alkoxide groups and/or alkohol molecules might be incorporated into the nanoparticles as was shown e.g. for nanoscopic AlF3.23 This leads to a delayed evaporation (θevap. (M-OEt) = 126 °C, θevap. (M-OiPr) = 210 °C) than it would usually take place with pure solvents (θevap. (EtOH) = 78 °C, θevap. (iPrOH) = 83 °C). In contrast to the literature, a distinct endothermic signal for the evaporation of crystal water (3 mass%) at 300 °C was not found or might be a part of overall loss.12 At 522 °C and 557 °C, two DTA signals without mass loss occur. It can be assumed that this points out the decomposition of the complex. Therefore, a XRD-characterization of the sample after DTA/TG-treatment was performed which only shows signals for the decomposition products AlF3 and MgF2 (Fig. 6b, xerogel 4). In contrast to previously said, the decomposition products became more crystaline due to higher thermal impact (600 °C versus 450 °C), and thus show reflexes after DTA/TG.
3.3 Xerogels of molar ratio 1![[thin space (1/6-em)]](https://www.rsc.org/images/entities/h3_char_2009.gif) :
:![[thin space (1/6-em)]](https://www.rsc.org/images/entities/h3_char_2009.gif) 2 (Mg
2 (Mg![[thin space (1/6-em)]](https://www.rsc.org/images/entities/h3_char_2009.gif) :
:![[thin space (1/6-em)]](https://www.rsc.org/images/entities/h3_char_2009.gif) Al)
Al)
MgAl2F8·2H2O is described in literature, thus, we tried to obtain it via the fluorolytic sol gel approach and pursued the same characterization process like for MgAlF5·2H2O samples.13 In comparison to MgAlF5 or MgAlF5·2H2O the structural properties of MgAl2F8·2H2O are likely in-between of the former: layers consisting of vertex linked [AlF6] octahedrons are connected via [Mg(H2O)2F4] octahedrons and three crystallographically different F sites are present (Fig. 7).13 As already mentioned in 3.1, a formation of MgAl2F8 within the sol was not observed. Although the measured 19F MAS NMR data of the corresponding xerogels 5–7 do not show good accordances towards calculated 19F chemical shifts, several signals in the range between −160 ppm (light green) and −180 ppm (dark green) might be assigned to signals of fluorine sites in MgAl2F8·2H2O in a strongly disordered environment (Fig. 8a and Table 5). Additionally, fluorine centers surrounded by Al(OiPr)3 groups, like AlFx(OiPr)3−x, lead to the low field shifted widening in the range above −160 ppm.23 The tiny topping signal at −153.8 ppm shows a [BF4]− species, which might have been formed by the reaction of remaining HF with the glass flask. Moreover, the high field shifted widening below −180 ppm leads to the supposition that magnesium-containing fluorine centers, like [FMg4]OxFy are present in the xerogel as well (Fig. 8a, orange).20 Thermal treatments in xerogel 6 and 7 expedite the formation of fluorine centers with fewer numbers of magnesium, like [FMg3]OxFy and a decrease of surrounding oxygen in the second coordination sphere, especially at fluorine centers surrounded by aluminum. Both suggestions lead to a change in the ratio between signal intensities and the overall high field shifting in signal positions (Fig. 8b). In comparison to MgAlF5·2H2O xerogels (Fig. 5b), signal shiftings of xerogel 5–7 are more pronounced, which might be caused by the higher amount of aluminum and the corresponding effect of its isopropoxide groups.23
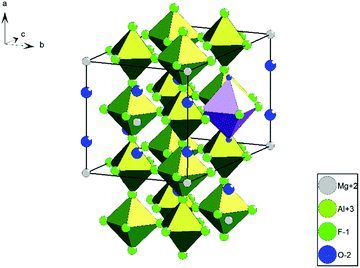 | ||
| Fig. 7 Crystal structure of MgAl2F8·2H2O; green = [ALF6]; purple = [Mg(H2O)2F4]; protons are not shown.13 | ||
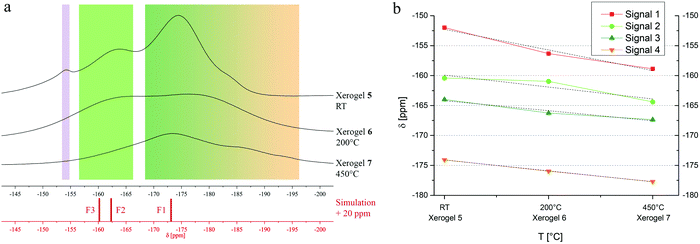 | ||
| Fig. 8 (a) 19F MAS NMR spectra of xerogel 5–7. (b) Progress of signal shifting in dependence of temperature in xerogels 5–7. | ||
| # | T treatm [°C] | Remark | δ exp. (19F) [ppm] | δ theor. (19F) [+20 ppm] |
|---|---|---|---|---|
| n.c. = not comparable. | ||||
| Xerogel 5 | — | Not annealed | −153.9 | n.c. |
| −158.0 to −166.0 | n.c. | |||
| −168.0 to −181.0 | n.c. | |||
| Xerogel 6 | 200 | — | −158.0 to −166.0 | n.c. |
| −168.0 to −181.0 | n.c. | |||
| Xerogel 7 | 450 | — | −158.0 to −166.0 | n.c. |
| −168.0 to −181.0 | n.c. | |||
| −185.0 to −195.0 | n.c. | |||
| Xerogel 8 | — | Desiccator | (−152.8) | [BF4]− |
| −160.6 | −160.1 | |||
| −162.6 | −162.1 | |||
| −174.3 | −173.2 | |||
Consequently, the non-annealed xerogel 5 was stored in a desiccator providing a constant partial pressure of water in the atmosphere in order to enable the formation of pure MgAl2F8·2H2O (xerogel 8). The measured 19F MAS NMR of xerogel 8 shows a significant change in the position of the signals, and integrals as well (Fig. 9). The possibility to separate two sharp signals at −160.6 ppm (F3, light green) and −162.6 ppm (F2, medium green) allows to compare the measured with the calculated spectrum. As before, also in this case, the calculated 19F NMR values were displaced by 20 ppm for graphical description. It can be seen, that all three main signals fit well to the simulation. It is to note that the only fluorine site (F1, dark green) connected to a [Mg(H2O)2F4] octahedron shows a broad shape which might be caused by the influence of oxygen containing water molecules. Concerning the fact that xerogel 8 is formerly xerogel 5 it is not surprisingly, that the tiny peak at −153.8 (purple, [BF4]−) can be observed again (Fig. 9).
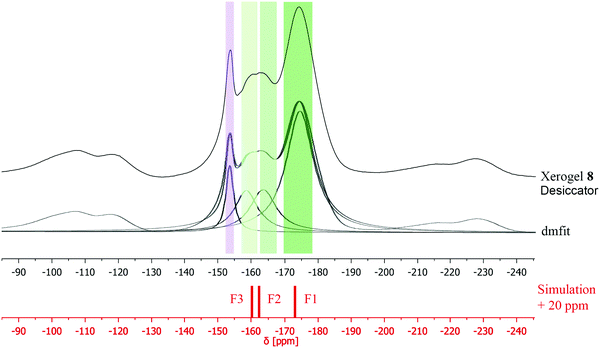 | ||
| Fig. 9 Comparison between 19F MAS NMR spectra of xerogel 8, dmfit, and simulation of the three main signals in MgAl2F8·2H2O. | ||
In addition to the 19F MAS NMR data, the alignment of obtained XRD data and available powder diffraction file also allows confirming the formation of MgAl2F8·2H2O (pdf: 44-773, doubt) (Fig. 10a). While the non-annealed xerogel 5 might be totally amorphous, annealed xerogels 6–7 show acceptable similarities. However, both MgAlF5·2H2O (used pdf: ZnFeF5·2H2O) and MgAl2F8·2H2O exhibit nearly equal XRD-pattern, thus, a definite attribution to the presence of MgAl2F8·2H2O in xerogel 5, 6, and 7 cannot be deduced. On the other hand, the signal positions of xerogel 8 that was stored in a controlled moisture atmosphere in a desiccator fits perfectly with the powder diffraction file. The thermal analysis of the obtained compound yielded a TG curve that indicates a mass loss of almost 32% up to 300 °C (Fig. 10b). In comparison to 3.2, MgAl2F8 xerogels consist of a higher number of isopropoxide groups when the amount of aluminum increases. In addition, an exothermic effect at 425 °C can be observed by DTA. In contrast to the literature, DSC investigations in N2 atmosphere report an endothermic effect at 520 °C.13 It is known though, that different atmospheres at thermal analyses may cause complementary effects. However, more probably the signal at 533 °C may indicate the thermal decomposition of the complex because XRD analysis of the samples after DTA/TG investigation reveals the decomposition products AlF3 and MgF2 (not shown).
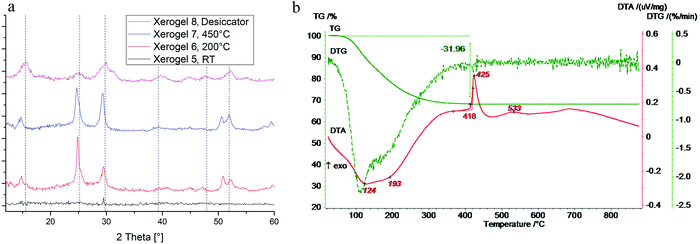 | ||
| Fig. 10 (a) XRDs of xerogels 5–8, dashed lines: MgAl2F8·2H2O (pdf: 44-773, doubt, less intense signals not shown). (b) DTA/TG analysis of xerogel 5. | ||
3.4 Xerogels of molar ratio 2![[thin space (1/6-em)]](https://www.rsc.org/images/entities/h3_char_2009.gif) :
:![[thin space (1/6-em)]](https://www.rsc.org/images/entities/h3_char_2009.gif) 1 (Mg
1 (Mg![[thin space (1/6-em)]](https://www.rsc.org/images/entities/h3_char_2009.gif) :
:![[thin space (1/6-em)]](https://www.rsc.org/images/entities/h3_char_2009.gif) Al)
Al)
To complete our conceptual procedure, we additionally investigated xerogels of a molar ratio 2![[thin space (1/6-em)]](https://www.rsc.org/images/entities/char_2009.gif) :
:![[thin space (1/6-em)]](https://www.rsc.org/images/entities/char_2009.gif) 1 (Mg
1 (Mg![[thin space (1/6-em)]](https://www.rsc.org/images/entities/char_2009.gif) :
:![[thin space (1/6-em)]](https://www.rsc.org/images/entities/char_2009.gif) Al). In general, a compound like Mg2AlF7 is not described in literature yet. Having a first look at the measured 19F MAS NMR spectra and comparing them to previously discussed xerogel 1 and 3, similarities in existing signals can be observed. Thus, it can be assumed that a formation of MgAlF5·2H2O (F2, light green, F1 dark green) and MgF2 (orange) took place simultaneously. Calculated spectra of MgAlF5·2H2O and MgF2 fit well and provide evidence for our assumption (Fig. 11 and Table 6).
Al). In general, a compound like Mg2AlF7 is not described in literature yet. Having a first look at the measured 19F MAS NMR spectra and comparing them to previously discussed xerogel 1 and 3, similarities in existing signals can be observed. Thus, it can be assumed that a formation of MgAlF5·2H2O (F2, light green, F1 dark green) and MgF2 (orange) took place simultaneously. Calculated spectra of MgAlF5·2H2O and MgF2 fit well and provide evidence for our assumption (Fig. 11 and Table 6).
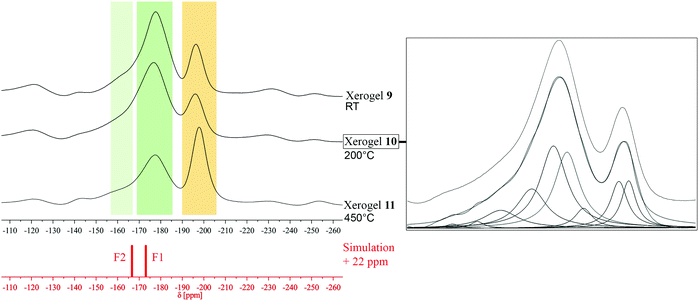 | ||
| Fig. 11 Comparison between 19F MAS NMR spectra of xerogels 9–11, simulation of the signals in MgAlF5·2H2O, and dmfit analysis of xerogel 10. | ||
| # | T treatm [°C] | Remark | δ exp. (19F) [ppm] | δ theor. (19F) [+22 ppm] |
|---|---|---|---|---|
| Xerogel 9 | — | Not annealed | (−196.2) | MgF2 |
| −177.5 | −173.1 | |||
| −162.5 | −167.1 | |||
| Xerogel 10 | 200 | — | (−195.9) | MgF2 |
| −176.7 | −173.1 | |||
| −163.2 | −167.1 | |||
| Xerogel 11 | 450 | — | (−197.5) | MgF2 |
| −177.0 | −173.1 | |||
| −163.5 | −167.1 | |||
Moreover, dmfit analyses of xerogel 10 show an increased amount of interfered signals with higher intensities in comparison to molar ratios 1![[thin space (1/6-em)]](https://www.rsc.org/images/entities/char_2009.gif) :
:![[thin space (1/6-em)]](https://www.rsc.org/images/entities/char_2009.gif) 1 and 1
1 and 1![[thin space (1/6-em)]](https://www.rsc.org/images/entities/char_2009.gif) :
:![[thin space (1/6-em)]](https://www.rsc.org/images/entities/char_2009.gif) 2 (Mg
2 (Mg![[thin space (1/6-em)]](https://www.rsc.org/images/entities/char_2009.gif) :
:![[thin space (1/6-em)]](https://www.rsc.org/images/entities/char_2009.gif) Al, Fig. 11). With a molar ratio of 2
Al, Fig. 11). With a molar ratio of 2![[thin space (1/6-em)]](https://www.rsc.org/images/entities/char_2009.gif) :
:![[thin space (1/6-em)]](https://www.rsc.org/images/entities/char_2009.gif) 1 (Mg
1 (Mg![[thin space (1/6-em)]](https://www.rsc.org/images/entities/char_2009.gif) :
:![[thin space (1/6-em)]](https://www.rsc.org/images/entities/char_2009.gif) Al) there are much more possibilities of fluorine centers surrounded by magnesium, like [FMg3]OxFy, [FMg4]OxFy, and [FMg5]OxFy. Moreover, the formation of various AlFx(OiPr)3−x species is not inhibited by fewer amounts of aluminum, which leads to a low field widening within the spectra as well. Based on our previously reported data, we are able to assign the signals/ranges to different fluorinated species (Fig. 12a).20,23 It can be assumed that numerous AlFx(OiPr)3–x species dominate the range of −160 ppm and above (red).23 The two main signals of MgAlF5·2H2O can be found subsequently right handed to this area (light green, dark green). The range between −175 ppm and −200 ppm, shows approximately four single signals for various magnesium connected fluorine centers (light orange to dark orange).20 In contrast to xerogels of molar ratios 1
Al) there are much more possibilities of fluorine centers surrounded by magnesium, like [FMg3]OxFy, [FMg4]OxFy, and [FMg5]OxFy. Moreover, the formation of various AlFx(OiPr)3−x species is not inhibited by fewer amounts of aluminum, which leads to a low field widening within the spectra as well. Based on our previously reported data, we are able to assign the signals/ranges to different fluorinated species (Fig. 12a).20,23 It can be assumed that numerous AlFx(OiPr)3–x species dominate the range of −160 ppm and above (red).23 The two main signals of MgAlF5·2H2O can be found subsequently right handed to this area (light green, dark green). The range between −175 ppm and −200 ppm, shows approximately four single signals for various magnesium connected fluorine centers (light orange to dark orange).20 In contrast to xerogels of molar ratios 1![[thin space (1/6-em)]](https://www.rsc.org/images/entities/char_2009.gif) :
:![[thin space (1/6-em)]](https://www.rsc.org/images/entities/char_2009.gif) 1 and 1
1 and 1![[thin space (1/6-em)]](https://www.rsc.org/images/entities/char_2009.gif) :
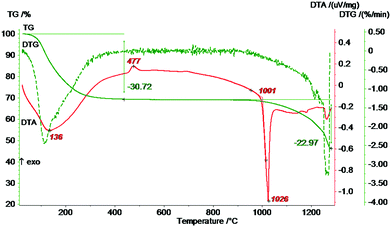
:![[thin space (1/6-em)]](https://www.rsc.org/images/entities/char_2009.gif) 2, a decrease of the signals as result of calcination cannot be observed, which might be caused by errors in dmfit analysis and the difficulty of a clear separation. Nevertheless, the variety of signals, which implicates a highly distorted material, goes hand in hand with the measured XRD diffractograms (Fig. 12b), in which not even one of the complex phases can clearly be determined but MgF2 (pdf: 6-290, calc.). To track thermal behavior, DTA/TG analysis was performed showing similarities to DTA/TG curves of xerogel 1 and 5 (Fig. 13). A mass loss of 30% occurs up to 300 °C. Moreover, a small exothermic effect can be found at 477 °C and indicates a thermal decomposition, which can be evidenced by XRD after DTA/TG measurements (not shown). Finally, at 1026 °C a huge endothermic peak occurs and pointing out melting of the compound.
2, a decrease of the signals as result of calcination cannot be observed, which might be caused by errors in dmfit analysis and the difficulty of a clear separation. Nevertheless, the variety of signals, which implicates a highly distorted material, goes hand in hand with the measured XRD diffractograms (Fig. 12b), in which not even one of the complex phases can clearly be determined but MgF2 (pdf: 6-290, calc.). To track thermal behavior, DTA/TG analysis was performed showing similarities to DTA/TG curves of xerogel 1 and 5 (Fig. 13). A mass loss of 30% occurs up to 300 °C. Moreover, a small exothermic effect can be found at 477 °C and indicates a thermal decomposition, which can be evidenced by XRD after DTA/TG measurements (not shown). Finally, at 1026 °C a huge endothermic peak occurs and pointing out melting of the compound.
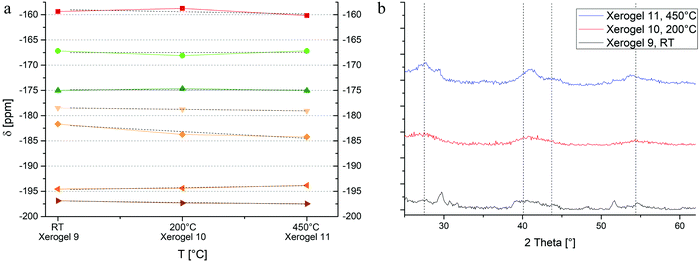 | ||
| Fig. 12 (a) Progress of signal shifting with temperature in xerogels 9–11. (b) XRDs of xerogels 9–11, dashed lines: MgF2 (pdf: 6-290, calc., less intense signals not shown). | ||
3.5 Optical properties of coatings
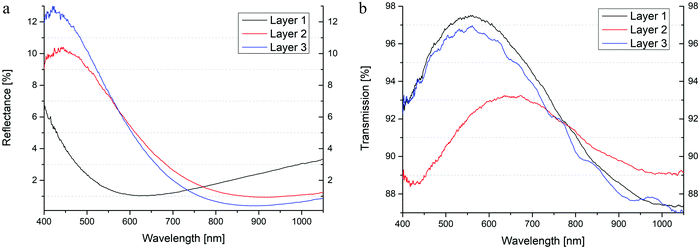
Coming back to our original objective, the development of antireflective coatings with increased stability towards mechanical abrasion and moisture, layers on glasses were fabricated via dip-coating. Reflection and transmission data were determined, and finally, mechanical stability was investigated by crock meter test and a water stability of the AR-layers tested by depositing the glass slides in a water bath. Concerning the λ/4 relationship, which points out a connection between layer thickness and the position of the reflective minima in transmission spectroscopy, equal layer thicknesses was assured by adjusting extraction speed for dip coating. Thus, thin films with a reflective minimum within a wavelength range of 600 nm to 900 nm were fabricated (Table 7 and Fig. 14a, b). The mentioned values for R and T show the lowest and the highest points within the whole spectra, respectively. It can be seen, that the layers of all three ratios ensure antireflective behavior of almost less than 1%, in which especially molar ratio of 2![[thin space (1/6-em)]](https://www.rsc.org/images/entities/char_2009.gif) :
:![[thin space (1/6-em)]](https://www.rsc.org/images/entities/char_2009.gif) 1 (Mg
1 (Mg![[thin space (1/6-em)]](https://www.rsc.org/images/entities/char_2009.gif) :
:![[thin space (1/6-em)]](https://www.rsc.org/images/entities/char_2009.gif) Al) exhibit a reflection less than 0.5%. Layer 1, which consists of the compound with molar ratio 1
Al) exhibit a reflection less than 0.5%. Layer 1, which consists of the compound with molar ratio 1![[thin space (1/6-em)]](https://www.rsc.org/images/entities/char_2009.gif) :
:![[thin space (1/6-em)]](https://www.rsc.org/images/entities/char_2009.gif) 1, shows the highest transmission of all layers. Absorbance and scattering cause the gap between R, T, and 100% of incoming light, in which layer 2 seems to provide the largest amount of absorbance and scattering. Moreover, the calculated values for n632,8nm point out the convergence to 1.22, which would fit R = 0 within the λ/4 relationship.
1, shows the highest transmission of all layers. Absorbance and scattering cause the gap between R, T, and 100% of incoming light, in which layer 2 seems to provide the largest amount of absorbance and scattering. Moreover, the calculated values for n632,8nm point out the convergence to 1.22, which would fit R = 0 within the λ/4 relationship.
| Layer | Ratio (Mg![[thin space (1/6-em)]](https://www.rsc.org/images/entities/char_2009.gif) : :![[thin space (1/6-em)]](https://www.rsc.org/images/entities/char_2009.gif) Al) Al) |
T [°C] | t [min] | dT [°C min−1] | d [nm] | R [%] | T [%] | n 632,8nm |
|---|---|---|---|---|---|---|---|---|
| 1 | 1![[thin space (1/6-em)]](https://www.rsc.org/images/entities/char_2009.gif) : :![[thin space (1/6-em)]](https://www.rsc.org/images/entities/char_2009.gif) 1 1 |
450 | 15 | 10 | 111.4 | 1.02 | 97.51 | 1.32 |
| 2 | 1![[thin space (1/6-em)]](https://www.rsc.org/images/entities/char_2009.gif) : :![[thin space (1/6-em)]](https://www.rsc.org/images/entities/char_2009.gif) 2 2 |
450 | 15 | 10 | 172.3 | 0.93 | 93.20 | 1.30 |
| 3 | 2![[thin space (1/6-em)]](https://www.rsc.org/images/entities/char_2009.gif) : :![[thin space (1/6-em)]](https://www.rsc.org/images/entities/char_2009.gif) 1 1 |
450 | 15 | 10 | 171.2 | 0.39 | 96.96 | 1.27 |
After determining the optical properties of obtained layers, we investigated their stability towards mechanical abrasion and water. All layers were treated with 25 strokes of steel wool (Fig. 15). Concerning layer 1, intensive scratches can be observed. In comparison to that, layer 2 shows tiny ruts only within the surface, whereas layer 3 does not show any furrows at all.
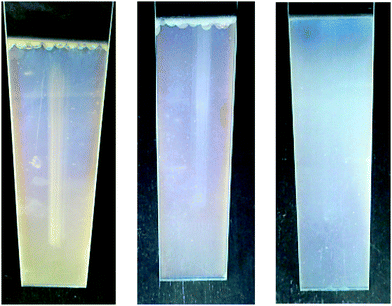
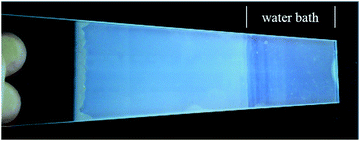
In addition, freshly prepared glasses of all ratios were thermally densified at 450 °C for 15 minutes and were put into a water bath of deionized water. After 14 days, glasses were removed and were dried at room temperature. Although all of them showed a satisfying stability towards water and could not be rubbed off with a tissue, dried layers show an interesting similarity: the dulling of the non-wetted area above the water surface (Fig. 16). This might be caused by the porosity of the layers and can be compared with a chromatography column. The soaring water solves soluble residues and sweeps them along within the layer.
To understand the constitution of the layers more precisely, we investigated surface morphology of layer 3 with the help of AFM as well as cross-sectional SEM. The AFM measurements show a very rough surface with small dots on it (Fig. 17). The dots (green rectangle) may show parts of partial crystallization and express the reflectance of R = 0.39%, which is poor compared to pure MgF2.9 These crystalline and spatial oriented centers lead to an increased scattering within the layer and cause less good results.
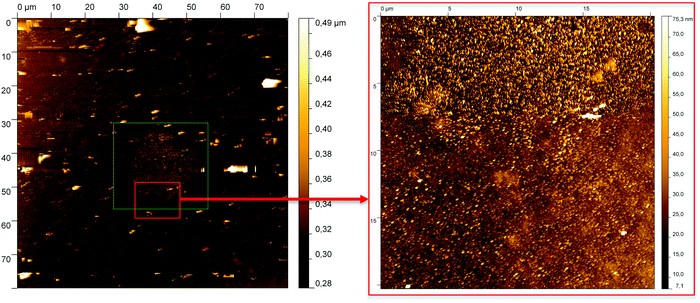 | ||
| Fig. 17 AFM measurements of layer 3; left: overall view with ghosting effects (white spots), roughness = 5.1 nm; right: zoomed view of red rectangle, roughness = 13.6 nm. | ||
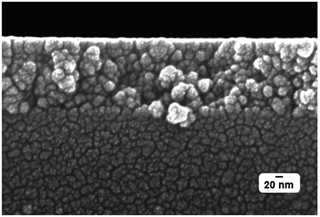
The cross-sectional SEM measurement visualizes that the original small nanoparticles in the course of calcination have assembled to larger agglomerates of different sizes thus constituting a porous layer. This porosity is the reason for the observed low refractive index of the layer which, fortunately, is still mechanically very robust (Fig. 18).
4. Summary
In the course of searching for new, novel compounds for antireflective coatings which have to be stable towards mechanical abrasion and moisture, we successfully developed syntheses approaches toward complex compounds of the general formula MgxAlyF2x+3y with molar ratios 1![[thin space (1/6-em)]](https://www.rsc.org/images/entities/char_2009.gif) :
:![[thin space (1/6-em)]](https://www.rsc.org/images/entities/char_2009.gif) 1, 1
1, 1![[thin space (1/6-em)]](https://www.rsc.org/images/entities/char_2009.gif) :
:![[thin space (1/6-em)]](https://www.rsc.org/images/entities/char_2009.gif) 2, and 2
2, and 2![[thin space (1/6-em)]](https://www.rsc.org/images/entities/char_2009.gif) :
:![[thin space (1/6-em)]](https://www.rsc.org/images/entities/char_2009.gif) 1 (x
1 (x![[thin space (1/6-em)]](https://www.rsc.org/images/entities/char_2009.gif) :
:![[thin space (1/6-em)]](https://www.rsc.org/images/entities/char_2009.gif) y) via the fluorolytic sol–gel synthesis. Despite the description of MgAlF5, MgAlF5·2H2O, and MgAl2F8·2H2O in the literature, NMR data were not reported so far.11–13 Thus, we calculated NMR data with the help of the superposition model by Bureau et al.18
y) via the fluorolytic sol–gel synthesis. Despite the description of MgAlF5, MgAlF5·2H2O, and MgAl2F8·2H2O in the literature, NMR data were not reported so far.11–13 Thus, we calculated NMR data with the help of the superposition model by Bureau et al.18
By using the fluorolytic sol–gel synthesis, we were able to obtain colorless and clear colloidal dispersions of all three molar ratios. Comparing static solid-state NMR with calculated spectra, the formation of a pure phase, like MgAlF5 can be excluded. However, fluorine atoms connecting both, magnesium and aluminum, are evidently present beside the pure fluorides, MgF2 and AlF3. Removing the solvent from the sol led to the formation of more crystalline phases. Thus, MgAlF5·2H2O and MgAl2F8·2H2O were obtained from respective molar ratios of Mg- and Al-precursors. Although evidence for the formation of MgAlF5·2H2O and MgAl2F8·2H2O were provided by XRD, 19F MAS NMR and superposition model calculations, many other similar species are deduced effecting a broad widening of the signals within the spectra. Hereof, oxygen-containing fluorine centers like [FMgz]OxFy (z = 3–6) or AlFx(OiPr)3−x, can be found with different OR-contents depending on their respective molar ratios. In addition, we observed a signal shifting by thermal impacts, which can be explained by evaporation of oxygen-containing groups. Moreover, a thermal impact finally led to the decomposition of the complex into its pure fluorides, MgF2 and AlF3 above 500 °C.
As to our introductory remarks concerning industrial applicability of antireflective coatings, the obtained layers showed a reflection and transmittance of about 1% and 97%, respectively. Visual analysis of a selected surface show a distinct roughness and spots of partial crystallinity. Fortunately and in line with our expectation, the layers exposed a satisfying stability towards mechanical abrasion and a long time resistance in water bath test.
In summary, the nominal compound Mg2AlF7 combined antireflective properties (R ≈ 0.4%, T ≈ 97%) with a vastly increased stability in comparison to approved systems like MgF2 or SiO2.
Conflicts of interest
There are no conflicts to declare.Acknowledgements
The authors thank the research training network GRK 1582/2 “Fluorine as a Key Element” of DFG (Deutsche Forschungsgemeinschaft) for funding. This project was partly also funded by the German Federal Ministry of Economics and Technology (Grant 03ET1235C). In addition, we want to thank Kevin Bethke and Christoph Erdmann for measuring AFM and cross-sectional SEM, respectively.References
- E. Kemnitz and J. Noack, Dalton Trans., 2015, 44, 19411–19431 RSC.
- S. Rudiger and E. Kemnitz, Dalton Trans., 2008, 1117–1127, 10.1039/b716483a.
- C. J. Brinker, G. C. Frye, A. J. Hurd and C. S. Ashley, Thin Solid Films, 1991, 201, 97–108 CrossRef CAS.
- L. C. Klein, Sol-gel optics: processing and applications, Springer Science & Business Media, 2013 Search PubMed.
- K. Tadanaga, N. Katata and T. Minami, J. Am. Ceram. Soc., 1997, 80, 3213–3216 CrossRef CAS.
- M. J. Weber, Handbook of Optical Materials, CRC Press, 2003 Search PubMed.
- P. Nostell, A. Roos and B. Karlsson, Thin Solid Films, 1999, 351, 170–175 CrossRef CAS.
- A. R. Phani, M. Passacantando and S. Santucci, Mater. Chem. Phys., 2001, 68, 66–71 CrossRef CAS.
- T. Krahl, D. Brosske, K. Scheurell, B. Lintner and E. Kemnitz, J. Mater. Chem. C, 2016, 4, 1454–1466 RSC.
- W. Glaubitt and P. Lobmann, J. Eur. Ceram. Soc., 2012, 32, 2995–2999 CrossRef CAS.
- D. Mitolo, A. Garavelli, T. Balić-Žunić, P. Acquafredda and S. P. Jakobsson, Can. Mineral., 2013, 51, 377 CrossRef CAS.
- M. Weil and F. Werner, Monatsh. Chem., 2001, 132, 769–777 CrossRef CAS.
- M. Weil, F. Werner and F. Kubel, Monatsh. Chem., 2002, 133, 267–275 CrossRef CAS.
- M. Body, C. Legein, G. Silly and J. Y. Buzaré, J. Non-Cryst. Solids, 2007, 353, 2231–2236 CrossRef CAS.
- T. J. Kiczenski and J. F. Stebbins, J. Non-Cryst. Solids, 2002, 306, 160–168 CrossRef CAS.
- C. Martineau, C. Legein, J. Y. Buzare and F. Fayon, Phys. Chem. Chem. Phys., 2009, 11, 950–957 RSC.
- M. Weil, E. Zobetz, F. Werner and F. Kubel, Solid State Sci., 2001, 3, 441–453 CrossRef CAS.
- B. Bureau, G. Silly, J. Y. Buzaré and J. Emery, Chem. Phys., 1999, 249, 89–104 CrossRef CAS.
- G. Scholz, S. Breitfeld, T. Krahl, A. Düvel, P. Heitjans and E. Kemnitz, Solid State Sci., 2015, 50, 32–41 CrossRef CAS.
- G. Scholz, C. Stosiek, J. Noack and E. Kemnitz, J. Fluorine Chem., 2011, 132, 1079–1085 CrossRef CAS.
- S. K. Ruediger, U. Gross, M. Feist, H. A. Prescott, S. C. Shekar, S. I. Troyanov and E. Kemnitz, J. Mater. Chem., 2005, 15, 588–597 RSC.
- M. Gerken, J. A. Boatz, A. Kornath, R. Haiges, S. Schneider, T. Schroer and K. O. Christe, J. Fluorine Chem., 2002, 116, 49–58 CrossRef CAS.
- R. König, G. Scholz, R. Bertram and E. Kemnitz, J. Fluorine Chem., 2008, 129, 598–606 CrossRef.
- D. Massiot, F. Fayon, M. Capron, I. King, S. Le Calvé, B. Alonso, J. O. Durand, B. Bujoli, Z. Gan and G. Hoatson, Magn. Reson. Chem., 2002, 40, 70–76 CrossRef CAS.
| This journal is © The Royal Society of Chemistry 2018 |

