Ambient temperature aqueous synthesis of ultrasmall copper doped ceria nanocrystals for the water gas shift and carbon monoxide oxidation reactions†
Christopher D.
Curran
a,
Li
Lu
 b,
Christopher J.
Kiely
ab and
Steven
McIntosh
 *a
*a
aDepartment of Chemical and Biomolecular Engineering, Lehigh University, 111 Research Drive, Bethlehem, PA 18015, USA. E-mail: mcintosh@lehigh.edu
bDepartment of Materials Science and Engineering, Lehigh University, 5 East Packer Avenue, Bethlehem, PA 18015, USA
First published on 4th December 2017
Abstract
Ceria substitutionally doped with copper is a promising heterogeneous catalyst for a range of oxidation reactions. Herein we describe the aqueous phase, scalable, and direct precipitation of CuxCe1−xO2−δ (x = 0–0.35) solid solution oxide nanocrystals at room temperature without the need for calcination at elevated temperatures. This direct precipitation of the crystalline oxide is enabled through ligand exchange prior to pH adjustment to prevent the precipitation of the hydroxide phase. By producing particles at room temperature, dopant exsolution and particle growth by sintering can be minimized and/or controlled. Using our methodology, copper dopant concentrations of up to 35 mol% could be produced in 1.7 nm diameter ceria nanocrystals. The resulting materials showed high catalytic activity towards both the water gas shift reaction (WGS) and CO oxidation, with improved performance following the trend of increasing copper content. In comparison to pure ceria nanocrystals, the WGS activation energy decreased from 89.0 to 49.2 kJ mol−1 and the CO oxidation light-off temperature decreased from 262 to 159 °C at a space velocity of 25![[thin space (1/6-em)]](https://www.rsc.org/images/entities/char_2009.gif) 000 h−1 upon doping with 35 mol% copper.
000 h−1 upon doping with 35 mol% copper.
Introduction
Copper–cerium mixed oxide materials are of considerable interest in a variety of catalytic applications such as the water gas shift (WGS) and CO oxidation reactions.1–7 Both of these reactions have important significance in the industrial and automotive sectors. WGS catalysts are used for hydrogen and ammonia production at the industrial scale, and are an important component in fuel processors for proton-exchange membrane fuel cells, preventing CO poisoning at the anode.6,8,9 In automobiles and stationary combustion sources, CO oxidation catalysts are widely used to mitigate the environmental impact of CO emissions and are an essential part of three-way catalyst systems.10–12 Copper–cerium mixed oxide catalysts show high activity for these reactions due to the favorable redox properties of ceria and the active site created by incorporating copper. Additionally, the relatively low cost and earth-abundance of the constituent elements makes synthesis of these materials economical and scalable. While high copper dopant concentration and small particle size are desirable for enhancing this catalytic activity, the elevated temperatures associated with most synthesis procedures leads to exsolution of the dopant as well as particle growth. These two factors limit the accessible copper doping concentration and as-synthesized particle size. In this work, we describe a new synthesis protocol for the direct aqueous phase synthesis of ultrasmall highly doped copper–ceria nanocrystals and demonstrate their high activity towards the water gas shift and CO oxidation reactions.There is general agreement in the literature that both copper and ceria play important roles in catalysis. While researchers agree on the importance of the redox capability of ceria through the Mars–van-Krevelen mechanism,13,14 which has been demonstrated in ceria doped with other transition metals,15–17 the precise nature of the Cu active site for both CO oxidation and the water gas shift reaction over CuxCe1−xO2−δ catalysts is still a matter for ongoing debate.1,2 For example, Wang et al. and Gamarra et al. propose that CuOx clusters on the catalyst surface are critical for the selective oxidation of CO.1,3,4 However, Liu and Flytzani-Stephanopoulos have presented contradictory evidence showing that Cu(I) ions incorporated within the ceria lattice are the active sites.5,18 The oxidation state of the Cu species will be a strong function of reaction conditions, depending on whether one is dealing with total CO oxidation in excess O2 or selective CO oxidation in the presence of H2. Elias et al. proposed that Cu can exist at a higher oxidation state under reaction conditions of high oxygen partial pressure and that the active sites are oxygen vacancies formed adjacent to Cu-substituted surface sites in the mixed oxide nanoparticles.2
Despite this debate, there is some consensus that surface and near-surface enrichment of copper occurs under reaction conditions as the copper content in CuxCe1−xO2−δ increases, most likely leading to the formation of some CuOx phase. However, there seems to be some clear advantages of fabricating these samples initially as intimately mixed solid solutions rather than depositing Cu directly onto pre-formed CeO2. For example, Gamarra et al. specifically compared the CO selective oxidation activity of co-precipitated CuxCe1−xO2−δ catalysts to the activity of supported CuOx on CeO2.4 They noted that the high copper dispersion and initial presence of Cu in the co-precipitated catalyst leads to higher activity in the CO oxidation reaction.
Doped ceria materials are most commonly synthesized through flame aerosol pyrolysis,19 co-precipitation,20 or hydrothermal routes.21 These synthesis methods require high temperatures to generate crystalline products; however, exposure to high temperatures during synthesis can lessen the catalytic potential of the materials in two ways. Firstly, phase separation and migration of copper out of the ceria lattice can occur at high temperature, which limits the degree of interaction between copper and ceria. Secondly, high temperature processing can lead to increased crystallite size in the final doped ceria product which in turn decreases the oxygen mobility, an important factor for reactions involving the Mars–van-Krevelen mechanism as oxygen vacancy concentration tends to be highest in small ceria crystallites.22,23
As described in a classic paper by Livage et al.24 direct precipitation of the metal oxide from an aqueous phase metal nitrate or metal chloride precursor would require an elevated pH. As the pH of the reaction mixture increases, the interaction of the metal with the aqueous solution transitions from “aquo” (M–OH2) to “hydroxo” (M–OH) and finally to “oxo” (M–O). Addition of typical precipitants, such as sodium hydroxide or ammonium hydroxide, raises the pH into the “hydroxo” region, leading to dissociation of any weakly bound NO3− or Cl− ligands and precipitation of metal hydroxide particles. These then require a high temperature calcination step to form metal oxide particles. Ligands utilized in sol–gel processing, such as ethylenediaminetetraacetic acid (EDTA), can prevent hydroxide precipitation, however their strong binding also prevents oxide precipitation,25 once again requiring a calcination step to remove the ligand and transform to the metal oxide.
In this study, we demonstrate a facile method for direct formation of copper cerium oxide nanocrystals at room temperature in aqueous solution. This approach exchanges the nitrate ligands present in a mixed cerium nitrate and copper nitrate precursor solution for the intermediate strength lactate ligand, to shift the precipitation pH from the “hydroxo” to the “oxo” regime. Inducing precipitation via addition of ammonium hydroxide then leads to direct formation of <4 nm diameter CuxCe1−xO2−δ nanocrystals in the aqueous phase at room temperature. The Cu content can be tuned through the Cu nitrate/Ce nitrate ratios in the initial precursor solution to achieve as-synthesized Cu contents up to x = 35 in CuxCe1−xO2−δ. We demonstrate that these two factors make our nanoparticles excellent candidate materials for CO oxidation and water gas shift reaction catalysts.
Experimental methods
Particle synthesis
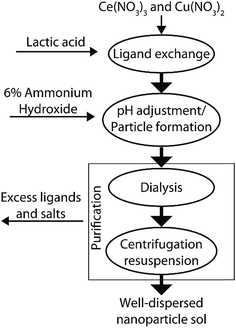
We synthesized ceria based nanoparticles using a modified base precipitation method as shown schematically in Fig. 1. 100 mL of aqueous solution was prepared with 100 mM Ce(NO3)3, 0–200 mM Cu(NO3)2 and a DL-lactic acid concentration equal to the total solution nitrate concentration ([CH3CHCOOH] = [NO3]). While stirring (500 rpm), nanoparticle growth was initiated by raising the pH to between 8.5 and 9 through the dropwise addition of 6% ammonium hydroxide solution. This pH was maintained for 2 h and the solution was allowed to stir overnight. After particle synthesis, excess lactic acid, nitric acid and ammonia were removed by dialysis using Thermo Snakeskin 3500 kDa tubing against deionized water, which caused aggregation of the mixed oxide particles. The solid product was washed three times by centrifugation (10![[thin space (1/6-em)]](https://www.rsc.org/images/entities/char_2009.gif) 000 RCF) and subsequent re-suspension in deionized water. The nanoparticles were finally re-dispersed and stored in dilute citric acid buffer (20 mM, pH 5.5) until required for use.
000 RCF) and subsequent re-suspension in deionized water. The nanoparticles were finally re-dispersed and stored in dilute citric acid buffer (20 mM, pH 5.5) until required for use.
Materials characterization
Samples for scanning electron microscopy (SEM) and energy dispersive X-ray (XEDS) analysis were prepared by drying the nanoparticle sols at room temperature, under vacuum overnight and attaching the dried film to an Al sample stub using adhesive carbon tape. The samples were examined in a Hitachi 4300SE SEM operating at an accelerating voltage of 20 keV, which was equipped with an EDAX silicon drift detector. XEDS spectrum quantification was conducted using EDAX Genesis software employing appropriate atomic number (Z), absorption (A) and fluorescence (F) corrections.26Synchrotron X-ray powder diffraction patterns obtained at beamline 11-BM of the Advanced Photon Source at Argonne National Labs, were utilized to determine the crystal structure and mean crystallite size of the as synthesized material. Rietveld refinement of this data was performed using the GSAS package27 with EXPGUI interface28 and the peak shapes were fitted to the Lorentzian isotropic crystallite size, LX, strain broadening, LY, and Lorentzian anisotropic crystallite size broadening, ptec, parameters in GSAS Profile 3. The mean crystallite size was then derived from the calculated LX parameter.
The phase stability of the crystallites at elevated temperature was determined using an Anton Paar DHS1100 domed hot stage attachment to a PANalytical Empyrean X-ray diffractometer. The sample holder was heated from 50–750 °C collecting spectra at 100 °C intervals with a 15 min dwell time at each temperature. Spectra were collected over a 30–100° 2θ angular range.
Raman spectra were collected at room temperature using a Witec alpha300 RA (Knoxville, TN, USA) confocal Raman microscope equipped with a 532 nm laser. The laser was focused to a ∼5 μm2 spot on the dried CuxCe1−xO2−δ sample using a 20× objective lens. Spectra were collected using a UHTS 400NIR spectrometer with a diffraction grating having 2400 lines per mm.
Samples for analysis by scanning transmission electron microscopy (STEM) were prepared by drop casting some diluted aqueous sol onto a carbon coated molybdenum mesh TEM grid (Electron Microscopy Sciences). The samples were analyzed in an aberration corrected JEOL ARM 200CF analytical electron microscope equipped with a JEOL Centurio XEDS system operating at 200 kV. Images were collected in high angle annular dark field (HAADF)-STEM and high-resolution HR-TEM modes. Fast Fourier Transforms (FFTs) derived from the HAADF-STEM and HR-TEM images were used to measure interplanar spacing and angles.
As-synthesized and dried CuxCe1−xO2−δ samples and those annealed at 300 °C for 15 min in air were analyzed by X-ray photoelectron spectroscopy (XPS). The samples were attached to the sample holder with conductive carbon tape. XPS spectra were collected using a Scienta ESCA-300 system with an excitation energy of 1486.6 eV (Al Kα). The operating pressure of the sample chamber is in the range of 10−8 Torr which may lead to a slight reduction of the sample materials. High resolution scans were collected from the Ce (3d), Cu (2p), O (1s) and C (1s) spectral regions, along with a lower resolution wide survey scan of the entire spectrum. All spectra were calibrated to the C (1s) line of adventitious carbon (284.8 eV). The relative concentrations of Ce(III) and Ce(IV) were calculated semi-quantitatively by integrating the area under the peaks associated with Ce(III) (u0, v0, u′, and v′) and Ce(IV) (u, v, u′′, v′′, u′′′, and v′′′) following the method proposed by Zhang et al.,29 in which, peak centers were set and only peak intensity and width were left as free parameters for peak fitting. The peak width and integrated area values obtained were found to be in good agreement with those reported in prior literature.29–32
Catalytic testing
CeO2−δ or Ce1−xCuxO2−δ nanoparticles were loaded onto 105–150 μm silica support particles (Sigma Aldrich) through incipient wetness impregnation from a washed solution of nanoparticles buffered in 20 mM citric acid at pH 5.5. The vacuum dried supported catalyst was packed into a 4 mm inner diameter quartz reactor tube and held in place with quartz wool plugs. Prior to any catalytic tests being performed, the reactor temperature was ramped at 10 °C min−1 from 30 to 450 °C in flowing air to remove residual water and citrate capping ligands from the catalyst particles. TGA analysis showed removal of water and citrate capping ligands to occur at 100 °C and 150–300 °C respectively (Fig. S1†).CO oxidation light-off curves were measured utilizing 500 mg of the supported catalyst (1% w/w) in a gas mixture of 2% CO, 8% O2 and 90% Ar at a total flow rate of 37.5 mL min−1. The reactor temperature was raised at 10 °C min−1 from 30–450 °C. Gas analysis was performed using a Cirrus 2 benchtop quadrupole mass spectrometer (MKS instruments) at the reactor outlet monitoring for m/z = 28, 32 and 44 signals which were assigned to CO, O2 and CO2 respectively.
Water gas shift reaction rate measurements were performed utilizing 500 mg of supported catalyst (7.5% w/w) in a gas mixture of 1.5% CO, 1.5% H2O, and 97% N2 at various flow rates chosen to be between 25 and 100 mL min−1. The inlet gas composition and flow rate were controlled by mass flow controllers and H2O was added to the stream by flowing a portion of the N2 gas through a sparger containing DI water at 25 °C. The gas composition at the reactor outlet was analyzed by an in-line model 8610C gas chromatograph (SRI Instruments) equipped with thermal conductivity and flame ionization detector. Samples were heated to 450 °C and the conversion measured stepwise at decreasing temperature intervals of 25 °C. Calculations for activation energy used only data collected where conversion level was less than 15%. The measured rates were normalized to the BET surface area of the catalysts as determined by N2 adsorption measurements at −196 °C using a homemade instrument.
Results
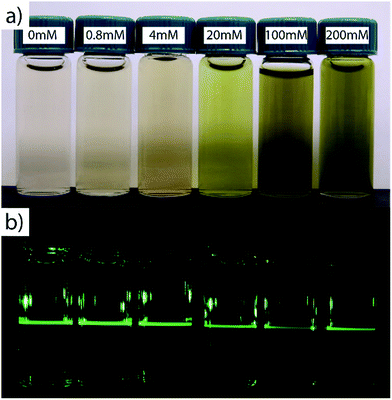
Direct formation of the oxide is possible due to the intermediate bond strength of the lactic acid ligand with the cerium ion. Lactic acid bonds to cerium with a binding constant (log(K1)) of 2.756 allowing the pH to be adjusted to 8.5–9.0 before solid formation.33 During particle synthesis, clear sols were formed after pH adjustment as shown in Fig. 2a. Laser light scattering, which is indicative of colloidal sol formation, became visible within minutes accompanied by a change in color, which was dependent on the copper content. Sols with low nominal copper contents (i.e., x = 0 to 0.01) transition from colorless to pale yellow whereas the samples with higher copper content (i.e., x = 0.05 to 0.35) transition from blue to deep green. Following synthesis, dialysis and washing, the nanoparticles were suspended in a dilute citric acid buffer solution (pH: 5.5, <20 mM) where they once again become clear with light scattering visible under laser illumination, Fig. 2b. A plot quantifying the relative proportions of precipitated-to-unprecipitated metal precursor for each sample composition prepared is shown in Fig. S2,† as determined by inductively coupled plasma mass spectrometry of the dialysis products.In contrast to ceria precipitation, attempting to form pure cuprous oxide nanoparticles using a similar approach led to the generation of a clear Cu(II) complex when the ammonium hydroxide base was added (Fig. S3†). While the solution color intensity changed, there was no indication of precipitation or sol formation, suggesting a simple exchange of the complex ligand, from lactate to ammonia. Interestingly, this by-passes the formation of a solid cupric hydroxide precipitate that is expected to occur in the intermediate pH range in the absence of lactic acid34 which supports the notion that the lactate ligand plays a stabilizing role in our synthesis procedure for Ce1−xCuxO2−δ.
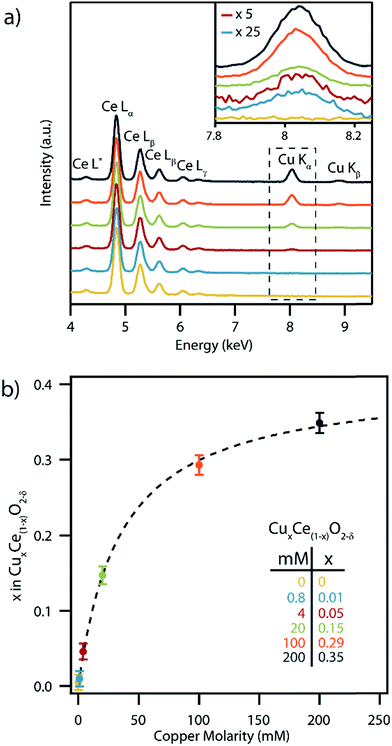
SEM-XEDS spectra were collected from dialyzed, washed and dried precipitated films of the as-synthesized nanocrystals, Fig. 3a. All of the samples showed a strong series of Ce L-series peaks. The intensity of the Cu Kα and Kβ peaks increased with increasing concentration of Cu nitrate in the synthesis solution. The corresponding copper concentrations in the set of CuxCe1−xO2−δ samples were determined on a metals basis using the standardless ZAF correction method,35Fig. 3b. The highest measured copper concentration corresponded to x = 0.35 which is amongst the highest reported to date in CuxCe1−xO2−δ.36–38 While XEDS and ICP-MS (Fig. S2†) shows that most of the copper is incorporated into the CuxCe1−xO2−δ precipitate for low concentration samples (i.e., x = 0.01, 0.05), the production of CuxCe1−xO2−δ particles with Cu higher concentrations required the copper precursor to be in excess, and thus much of the precursor remains unprecipitated. It should also be noted that if we calculate the expected composition of the nanocrystals utilizing the ratios of precipitated materials determined from the ICP-MS data, we arrive at Cu contents greater than those experimentally determined by XEDS. This is due to the precipitation of a separate copper hydroxide phase that is removed from the particles after synthesis by a triplicate washing procedure. The apparent saturation of Cu content at x = 0.35 in the nanoparticles for higher Cu nitrate precursor concentrations is consistent with prior research that suggested a maximum Cu content of x = ∼0.30 is sustainable within single phase Ce1−xCuxO2−δ.39
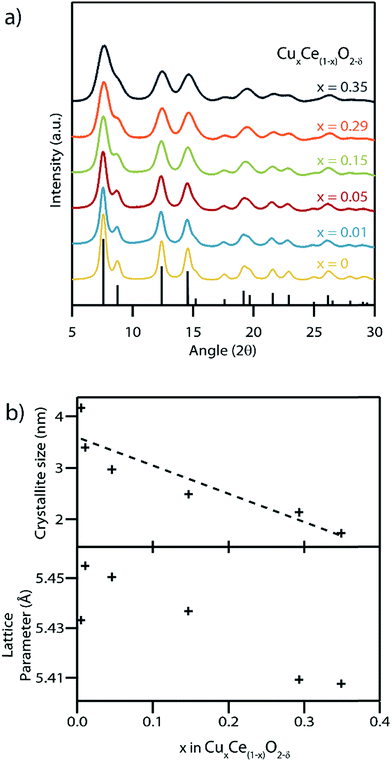
Rietveld refinement of synchrotron X-ray diffraction (XRD) patterns obtained from the as-synthesized material with varying Cu contents confirmed the presence of a single phase with the fluorite structure, space group Fm![[3 with combining macron]](https://www.rsc.org/images/entities/char_0033_0304.gif) m, in each sample (Fig. 4). There was no evidence of secondary CuO or Cu2O phases in any of the samples, Fig. S4.† The average crystallite size was found to decrease with increasing Cu content, with the 1.7 nm mean size measured for the x = 0.35 sample being amongst the smallest ever reported for either pure or doped ceria nanocrystals.6,40,41 The ability to access such small crystallite sizes is a direct consequence of the absence of any calcination step in our synthesis procedure, which removes the opportunity for sintering and growth processes to occur. Decreasing crystallite size typically leads to an increase in the lattice parameter in pure CeO2 particles.42 In the present case, this is counterbalanced by the expected decrease in lattice parameter upon increasing the concentration of the lower radius Cu(II) ions replacing the larger Ce(III) and Ce(IV) ions CuxCe1−xO2−δ.43 The Shannon ionic radii of Cu(II), Ce(III) and Ce(IV) in an octahedral coordination environment are 0.73, 1.01 and 0.87 Å respectively.44 In our systematic set of materials, the influence of copper concentration on lattice parameter is dominant which leads to a progressive decrease in lattice parameter except for the x = 0–0.01 Cu concentration range where the influence of size dominates and leads to a larger lattice parameter. Note that this result was confirmed by repeating the synthesis procedure and XRD measurements several times.
m, in each sample (Fig. 4). There was no evidence of secondary CuO or Cu2O phases in any of the samples, Fig. S4.† The average crystallite size was found to decrease with increasing Cu content, with the 1.7 nm mean size measured for the x = 0.35 sample being amongst the smallest ever reported for either pure or doped ceria nanocrystals.6,40,41 The ability to access such small crystallite sizes is a direct consequence of the absence of any calcination step in our synthesis procedure, which removes the opportunity for sintering and growth processes to occur. Decreasing crystallite size typically leads to an increase in the lattice parameter in pure CeO2 particles.42 In the present case, this is counterbalanced by the expected decrease in lattice parameter upon increasing the concentration of the lower radius Cu(II) ions replacing the larger Ce(III) and Ce(IV) ions CuxCe1−xO2−δ.43 The Shannon ionic radii of Cu(II), Ce(III) and Ce(IV) in an octahedral coordination environment are 0.73, 1.01 and 0.87 Å respectively.44 In our systematic set of materials, the influence of copper concentration on lattice parameter is dominant which leads to a progressive decrease in lattice parameter except for the x = 0–0.01 Cu concentration range where the influence of size dominates and leads to a larger lattice parameter. Note that this result was confirmed by repeating the synthesis procedure and XRD measurements several times.
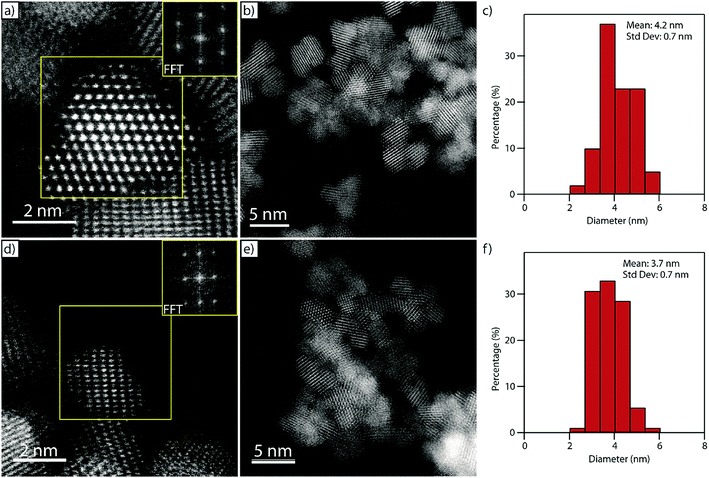
Fig. 5a and b show representative HAADF-STEM micrographs of the pure ceria material confirming the crystalline and nanoparticulate nature of the as-synthesized material. The measured interplanar spacing and angles derived from the corresponding fast Fourier transform (FFT, inset in Fig. 5a) match well with those expected for the [1![[1 with combining macron]](https://www.rsc.org/images/entities/char_0031_0304.gif) 0] projection on the CeO2 fluorite structure, Fig. S5.† The ceria particles have a relatively narrow size distribution with an average particle size of 4.2 ± 0.7 nm measured as a surface-equivalent spherical diameter (Fig. 5c) which matches well with the value derived from the XRD data (Fig. 4).
0] projection on the CeO2 fluorite structure, Fig. S5.† The ceria particles have a relatively narrow size distribution with an average particle size of 4.2 ± 0.7 nm measured as a surface-equivalent spherical diameter (Fig. 5c) which matches well with the value derived from the XRD data (Fig. 4).
Fig. 5d–f show the corresponding HAADF-STEM micrographs and particle size distribution of the nanocrystals in the Cu0.05Ce0.95O2−δ sample. As with the pure ceria material, the interplanar spacing and angles derived from the FFT inset in Fig. 5d match well with the fluorite structure; this time viewed along the [11![[2 with combining macron]](https://www.rsc.org/images/entities/char_0032_0304.gif) ] projection, Fig. S6.† The particle size distribution is narrow (Fig. 5f), with a mean particle size of 3.7 ± 0.7 nm, which again matches well with the corresponding value derived from XRD analysis (Fig. 4).
] projection, Fig. S6.† The particle size distribution is narrow (Fig. 5f), with a mean particle size of 3.7 ± 0.7 nm, which again matches well with the corresponding value derived from XRD analysis (Fig. 4).
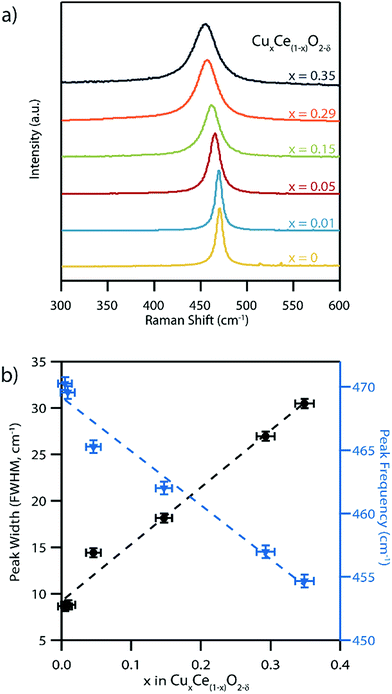
Raman spectra acquired from the pure CeO2−δ material exhibit a single peak centered at 470 nm−1, Fig. 6a, which is consistent with the reported position of the single allowed Raman mode of ceria with the fluorite structure.45,46 This F2g symmetry peak has previously been assigned to an oxygen anion breathing mode around the central cation.46 This peak was observed to both broaden and systematically shift to lower wavenumber in an approximately linear fashion as the Cu content in the series of CuxCe1−xO2−δ samples increases, Fig. 6b. The F2g peak position decreased to 455 cm−1 for the x = 0.35 Cu-doped sample. This is trend is fully consistent with the formation of a solid solution of copper within ceria.1,46 Peak broadening with increasing Cu content can be attributed to increased disorder due to the random distribution of both copper cations and oxygen vacancies in the material and their effect on neighboring Ce–O bond strength.4 A portion of this increased peak width can also be attributed to the observed decrease in crystallite size that typically increases the peak width in nanomaterials.47 Additionally, from wide-range Raman spectra (Fig. S7†) no Cu2O (150, 230, and 640 cm−1) or CuO (290, 340, and 625 cm−1) peaks were detected, further confirming that a single phase solid solution material forms upon doping CeO2 with Cu. Also visible in the wide range Raman spectra is a wide band peak at ∼600 cm−1, which can be attributed to oxygen vacancies in the samples.1
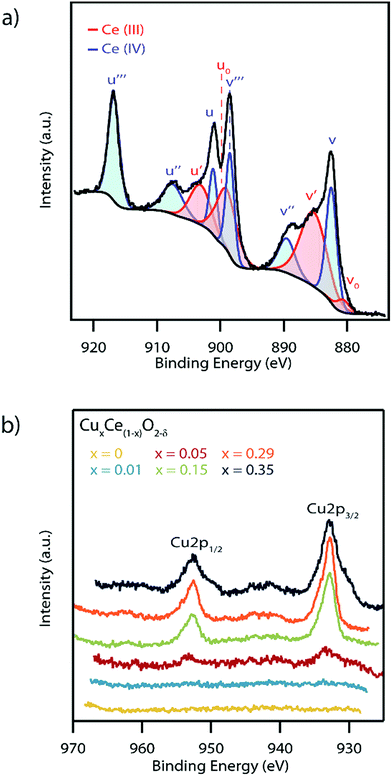
In order to further confirm the formation of a solid solution and the potential impact on catalytic activity, the influence of Cu doping on the Ce oxidation state and oxygen vacancy concentration in the as-synthesized materials was investigated by XPS. While this is typically described as a surface characterization technique, we can in this case consider the spectra to be representative of the bulk due to the mean nanoparticle diameter being smaller than the XPS penetration depth. A representative spectrum of the Ce (3d) region for the Cu0.29Ce0.71O2−δ sample is shown in Fig. 7a with the spectra for all of the other materials in the series presented in Fig. S8.† Cerium was found to exist in both the Ce(III) and Ce(IV) oxidation states which is typical of nanoscale ceria.42 The concentration of Ce(III) was determined semi-quantitatively by taking a ratio of the area under the curve of fitted Ce(III) peaks over that of the summed areas of the Ce(III) and Ce(IV) peaks, following a method previously described by Zhang et al.29 This analysis indicates a trend of decreasing Ce(III) concentration with increasing copper content, varying from 56% in pure CeO2−δ to 48% in the highest doped Cu0.35Ce0.65O2−δ sample, Table 1. The Ce(III) concentration values obtained were found to be in good agreement with those reported in prior literature.42,48
| Nominal copper concentrationa (mM) | Actual copper concentrationb (metals basis) | Mean crystallite sizec (nm) | Lattice parameterc (Å) | Ce(III) concentrationd (%) | Raman peak (cm−1) |
|---|---|---|---|---|---|
| a Concentration of Cu(NO3)2 used during synthesis. b Determined from XEDS measurements. c Calculated from Rietveld refinement of synchrotron powder XRD data. Standard deviations in the lattice parameter, obtained from GSAS, are an order of magnitude lower than the lowest reported digit. d Determined using XPS data from the Ce (3d) energy range, following the method proposed by Zhang et al.29 | |||||
| 0 | — | 4.2 | 5.433 | 56% | 470.3 |
| 0.8 | 0.01 | 3.4 | 5.455 | 56% | 469.6 |
| 4 | 0.05 | 3.0 | 5.450 | 54% | 465.3 |
| 20 | 0.15 | 2.5 | 5.437 | 50% | 462.0 |
| 100 | 0.29 | 2.1 | 5.409 | 46% | 457.0 |
| 200 | 0.35 | 1.7 | 5.408 | 48% | 454.7 |
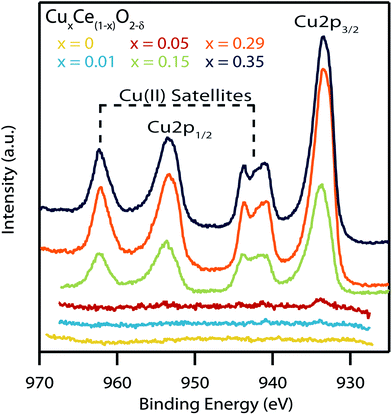
Fig. 7b shows the XPS spectra of the Cu (2p) region for the complete set of CuxCe1−xO2−δ samples. The x = 0.05, 0.15, 0.29, and 0.35 samples showed clear Cu 2p1/2 and Cu 2p3/2 peaks with only weak satellite peaks at ∼945 eV, indicative of primarily a Cu(I) oxidation state with only small quantities of Cu(II).49 The minor amount of Cu(II) may be indicative of a small amount of a segregated Cu-containing secondary phase in these highest Cu-content materials.50 As expected, no Cu (2p) peaks were observed in the x = 0 nanocrystals. Similarly, no Cu (2p) peaks were observed in the x = 0.01 sample due to the detection limit constraints of the XPS instrument.
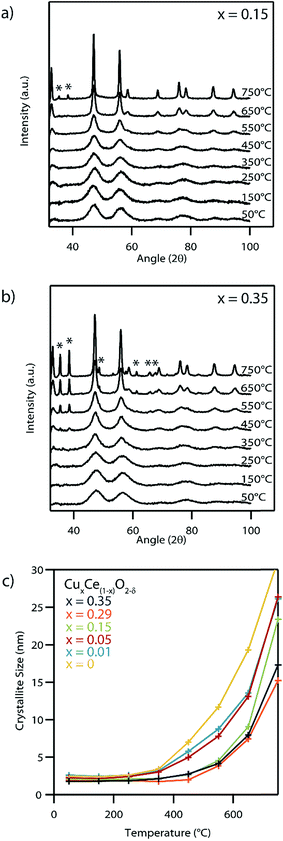
A key benefit of the lactic acid mediated synthesis approach employed in this study is the direct formation of the mixed CuxCe1−xO2−δ nanocrystals at room temperature, removing the need for a high temperature calcination step that can lead to unwanted crystallite growth and possible exsolution of Cu from the solid solution. However, many catalytic applications of these materials will typically require that they be exposed to elevated temperatures. High temperature XRD patterns obtained upon heating the CuxCe1−xO2−δ samples in air were analyzed to determine the extent of crystal growth and the stability of the mixed oxide phase as a function of calcination temperature. The Scherrer equation was used to estimate the average crystallite size from the (220) and (311) reflections of CeO2 using a shape factor of 0.9.51,52
Fig. 8a and b shows XRD of the systematic set of spectra for the Cu0.15Ce0.85O2−δ and Cu0.35Ce0.65O2−δ materials at a series of calcination temperatures beginning at 50 °C and increasing up to 750 °C at 100 °C intervals with a 15 min dwell time at temperature before taking any measurements. A distinct narrowing of the peaks characteristic of the fluorite structure was noted for each sample with increasing temperature due to crystallite growth at these elevated temperatures (Fig. 8c). The secondary set of XRD peaks at 750 °C and 450 °C respectively for Cu0.15Ce0.85O2−δ and Cu0.35Ce0.65O2−δ can be indexed to CuO, indicating an upper thermal limit of phase stability for these solid solutions. No CuO phase formation was observed for any of the other lower Cu content nanocrystals up to the maximum measurement temperature of 750 °C. The source of this CuO phase can be attributed either to the exsolution of Cu from these higher Cu-content CuxCe1−xO2−δ nanocrystals, or the subsequent crystallization of an amorphous Cu phase formed during synthesis. Such an amorphous Cu phase cannot be detected by XRD or by STEM, although we note the possible indication of the existence of some amorphous material in the as-XPS data acquired from the as-synthesized Cu0.29Ce0.81O2−δ sample (Fig. 7).
Fig. 9 shows the XPS spectra of the Cu (2p) region for the series of copper-doped ceria samples that have been calcined at 300 °C for 15 min. Samples with low copper concentrations show no significant Cu (2p) peaks. The heat-treated variants of the more highly doped samples show characteristic Cu 2p1/2 and Cu 2p3/2 peaks along with the Cu(II) satellites indicating the copper in the sample has changed oxidation state from Cu(I) to Cu(II). Likewise, there is an average shift in binding energy of +0.6 eV in the Cu 2p3/2 peaks after heat treatment, further indicating this switch in oxidation state.49 Such a change in oxidation state has been reported previously by Sciré et al. in copper-doped ceria materials that were heated from 200 to 400 °C.53 Taken together with our data this indicates that the transition from Cu(I) to Cu(II) occurs somewhere between 200–300 °C.
The CO oxidation reaction is typically used as an important benchmark for the catalytic activity of these Cu-doped ceria materials.54 The CO oxidation light-off curves shown in Fig. 10a exhibit the anticipated trend of lower light-off temperature, indicative of higher catalytic activity, with increasing copper content in the CuxCe1−xO2−δ structure. The exception to this trend occurs for the highest copper content material, i.e., Cu0.35Ce0.65O2−δ, which shows a slight decrease in the copper light-off temperature relative to the Cu0.29Ce0.71O2−δ sample, most likely due to the formation of some CuO secondary phase as indicated by our high temperature XRD experiments. The Cu0.29Ce0.71O2−δ catalyst showed 50% conversion at 145 °C with a gas hour space velocity of 25![[thin space (1/6-em)]](https://www.rsc.org/images/entities/char_2009.gif) 000 h−1. Hence the performance of our Cu0.29Ce0.71O2−δ material is in-line with other literature reports on copper-doped ceria CO oxidation catalysts.6,55
000 h−1. Hence the performance of our Cu0.29Ce0.71O2−δ material is in-line with other literature reports on copper-doped ceria CO oxidation catalysts.6,55
CO oxidation light-off experiments were repeated for the Cu0.29Ce0.71O2−δ sample following calcination at a series of elevated temperatures. The Cu0.29Ce0.71O2−δ sample was chosen for this experiment because it was the highest performing catalyst of the series and because it had been shown, through high temperature XRD, to develop CuO crystals after calcination at elevated temperatures. The CO oxidation performance of this particular catalyst was unaffected at calcination temperatures below 550 °C; however, a significant decrease in the activity was observed after calcination at 650 °C which was attributable to copper exsolution (Fig. 10b).
An Arrhenius plot of the reaction rate for the water gas shift reaction using the set of CuxCe1−xO2−δ samples is shown in Fig. 10c. These reaction rates have been normalized using the surface areas determined from BET isotherm analysis (Table 2). As with the CO oxidation light-off data, the catalytic activity generally increases with increasing Cu content in the CuxCe1−xO2−δ material, as shown in Fig. S9.† The measured decrease in activation energy was accompanied by an increase in overall reaction rate as x increased in CuxCe1−xO2−δ up to x = 0.29. Again, as with the CO light-off data, the overall rate of the x = 0.35 decreases when compared with the x = 0.29 sample, however the activation energy slightly decreases. This further indicates a decrease in accessibility of more active solid solution sites caused by exsolution of copper. Representative STEM micrographs of the Cu0.35Ce0.65O2−δ/SiO2 materials before and after the WGS oxidation reaction are shown in Fig. S10.† The images clearly show some evidence of crystallite growth in the post-reaction sample. Although, the presence of any thin amorphous layers of exsoluted copper rich material could not be detected in either sample, >10 nm segregated copper phase was detected in the post reaction sample. The measured activation energies and reaction rates for the WGS reaction are also competitive with previous literature reports for copper-doped ceria catalysts.56
| Samplea | Surface areab (m2 g−1) | CO light-off temperaturec (°C) | WGS activation energyd (kJ mol−1) |
|---|---|---|---|
| a Copper concentration calculated from XEDS measurements. b Calculated from N2 adsorption isotherms. c Temperature for 50% CO conversion. d Calculated by Arrhenius equation from data collected at under 15% conversion. | |||
| CeO2−δ | 155 | 262 | 89.0 ± 1.2 |
| Cu0.01Ce0.99O2−δ | 190 | 250 | 78.8 ± 2.4 |
| Cu0.05Ce0.95O2−δ | 145 | 212 | 80.0 ± 1.1 |
| Cu0.15Ce0.85O2−δ | 110 | 151 | 59.9 ± 0.6 |
| Cu0.29Ce0.71O2−δ | 90 | 145 | 51.6 ± 0.5 |
| Cu0.35Ce0.65O2−δ | 90 | 159 | 49.2 ± 0.9 |
Discussion
The nature of the precipitate formed upon raising the pH of a metal nitrate solution is qualitatively described in a classic paper by Livage et al.24 As the pH increases, the interaction of the metal with the aqueous solution transitions from “aquo” (M–OH2) to “hydroxo” (M–OH) and finally to “oxo” (M–O), with the precise pH required for a ‘transition’ being a function of the identity of the transition metal itself and the associated ligands in solution. In a typical ceria nanoparticle synthesis procedure, the pH of the precursor solution is raised to the point where it induces precipitation of insoluble cerium hydroxide nanocrystals by shifting into the ‘hydroxo’ region of Livage's construction. The hydroxide precipitate can then subsequently be transformed into cerium oxide by a suitable calcination treatment.Our results demonstrate that the addition of lactic acid into the precursor solution strongly influences the ligand associated with the cerium ion in solution. The binding constants (log(K1)) of nitrate and lactate ligands to Ce(III) are 0.21 and 2.756 (ref. 33) respectively, indicating a substantially stronger association of the lactic acid species to the Ce(III) cation.38 We suggest that the direct formation of the oxide in our lactic acid mediated synthesis route is due to the stronger ligand association that stabilizes the cation in solution as the pH increases upon the addition of ammonium hydroxide. This shifts the point of precipitation out of the ‘hydroxo’ region into the ‘oxo’ region in the Livage diagram.
The exact nature of the catalytically active site in CuxCe1−xO2−δ is still a matter of debate, however, there is general consensus that formation of a mixed Ce–Cu–O solid solution is critical to creating highly active sites. While it can be challenging to prove the formation of a true solid solution at very low dopant concentrations, all of the experimental evidence collected points to the formation of an intimately mixed CuxCe1−xO2−δ phase for x = 0.01 to 0.35 in our as-synthesized materials. The lattice parameter determined from the synchrotron XRD data (Fig. 4) shows a progressive decrease in lattice parameter of the fluorite-type with increasing Cu content as would be expected from a Vegard's law type relationship due to the smaller cationic radius of Cu. Furthermore, no secondary phases were observed in the as-synthesized materials prepared via our lactic acid mediated synthesis.
Further evidence for Cu–Ce–O solid solution formation comes from the approximately linear decrease in Ce–O breathing mode Raman frequency with increasing dopant level x in the CuxCe1−xO2−δ phase (Fig. 6). This is the result of the shift in phonon frequencies due to the decrease in lattice parameter, often referred to as the Grünier shift in Raman frequency.46 The concurrent broadening of the Raman peaks with increasing doping level is also indicative of solid solution formation, where such broadening is due to substitutional disorder on the cation sublattice upon Cu-doping leading to a distribution of cation–anion breathing frequencies.46 While the trends in lattice parameter, crystallite size and Raman spectra strongly indicate the formation of mixed oxide solid solution nanocrystals, we cannot fully rule out that some surface segregated amorphous copper-rich material exists in the as-synthesized CuxCe1−xO2−δ materials with x = 0.29 and 0.35.
We also note that the Ce(III) to Ce(IV) ratio in our materials shows a systematic trend of increasing Ce(IV) content with increasing Cu(I) doping level in CuxCe1−xO2−δ, suggesting some charge compensation occurs to stabilize the oxygen within the lattice upon doping. Finally, we found no evidence of secondary Cu–O phases in any of our HAADF-STEM imaging experiments on the as-synthesized materials (Fig. 5). When combined with the measured catalytic efficacy of the materials, all of the experimental evidence strongly supports the conclusion that the lactic acid mediated synthesis route forms solid solution CuxCe1−xO2−δ nanoparticles.
The nominal Cu content chosen during synthesis also has a strong influence on the resulting nanocrystal size, evidenced, for example, by the 29% decrease in crystallite size upon doping with only 5% Cu into the ceria nanocrystals. The only significant differences during the synthesis of these two materials relative to that of pure CeO2 is (i) the addition of 4 mM copper nitrate and (ii) a 5% increase in lactic acid concentration to maintain the lactic acid![[thin space (1/6-em)]](https://www.rsc.org/images/entities/char_2009.gif) :
:![[thin space (1/6-em)]](https://www.rsc.org/images/entities/char_2009.gif) cation ratio. Analysis of mean particle size as a function of lactic acid concentration used (Fig. S11†) demonstrates that the influence of this process parameter is negligible. The mean crystallite size however shows a near linear relationship with the amount of copper in solid solution (Fig. 4) and there are two possible reasons for this effect. As shown in Fig. S3,† rather than leading to precipitation of a cuprous oxide, addition of ammonium hydroxide to a precursor solution containing only copper nitrate stimulates the formation of a complex between the Cu(II) and ammonium ion. Such a strong ligand–cation interaction may retard particle growth when Cu is included as the ammonium covers the surface of the growing particle. Alternatively, this Cu-complex may serve to nucleate particle formation, leading to rapid formation of a large number of small nuclei. Further work with alternative cationic dopant species, such as Ni, Fe, or Co, is required to fully understand the effect of dopant identity upon nanocrystal nucleation and growth using our lactic acid mediated synthesis method.
cation ratio. Analysis of mean particle size as a function of lactic acid concentration used (Fig. S11†) demonstrates that the influence of this process parameter is negligible. The mean crystallite size however shows a near linear relationship with the amount of copper in solid solution (Fig. 4) and there are two possible reasons for this effect. As shown in Fig. S3,† rather than leading to precipitation of a cuprous oxide, addition of ammonium hydroxide to a precursor solution containing only copper nitrate stimulates the formation of a complex between the Cu(II) and ammonium ion. Such a strong ligand–cation interaction may retard particle growth when Cu is included as the ammonium covers the surface of the growing particle. Alternatively, this Cu-complex may serve to nucleate particle formation, leading to rapid formation of a large number of small nuclei. Further work with alternative cationic dopant species, such as Ni, Fe, or Co, is required to fully understand the effect of dopant identity upon nanocrystal nucleation and growth using our lactic acid mediated synthesis method.
The Cu0.35Ce0.65O2−δ material is comprised of particles with a mean size of 1.7 nm as determined by XRD, which is amongst the smallest ever reported for Cu doped-ceria material.6,40,41 The ability to form such small crystallites is most likely due to the direct formation of the oxide during the low temperature precipitation stage, removing the need for a calcination step at an elevated temperature, thus avoiding unnecessary sintering. The materials display high surface areas due to their ultra-small crystallite sizes, up to 190 m2 g−1 for the Cu0.01Ce0.99O2−δ sample, Table 2. There is an increase in surface area in the x = 0 to 0.01 copper concentration range due to a decrease in crystallite size from 4.2 to 3.4 nm respectively. The subsequent decrease in surface area at higher values of x may be attributed to an increased propensity for sintering of the higher Cu-content nanocrystals upon sample pre-treatment as evidenced by the narrowing of the XRD peak widths in Fig. 8.
While our experimental evidence points to the as-synthesized products being Cu–Ce–O solid solutions, these materials, particularly with the higher Cu dopant levels, become unstable at high temperature. XRD indicates phase separation upon calcination at ∼750 °C for lightly doped Cu0.15Ce0.85O2−δ formulation, whereas the second phase appeared more readily at ∼450 °C for the higher doped Cu0.35Ce0.65O2−δ material (Fig. 8). This indicates why high Cu dopant levels may be difficult to achieve using more traditional synthesis routes where an elevated temperature calcination step is required.
The XRD calcination series study also suggests slower ceria crystallite growth in samples containing higher copper concentrations, although this may be partly due to exsolution of the Cu to form secondary CuOx, leading to a loss of material from the parent CuxCe1−xO2−δ, nanoparticles.
The influence of copper doping level on the catalytic activity of CuxCe1−xO2−δ, is clearly observable for the both water–gas-shift and CO oxidation reactions (Fig. 10). For the water gas shift reaction, the overall reaction rate increases with increasing Cu loading up to x = 0.29 the Cu0.29Ce0.71O2−δ sample, but then decreases for the Cu0.35Ce0.65O2−δ composition. However, it should be noted that these materials were calcined at 450 °C prior to these catalytic tests, which is the temperature at which phase segregation of CuOx occurs from Cu0.35Ce0.65O2−δ, implying that the decrease in reaction rate is associated with this bulk phase segregation. This concept is reinforced by analyzing CO oxidation light-off curves for the Cu0.29Ce0.71O2−δ material with intermediate sintering steps of increasing temperature, Fig. 10b. The CO light-off temperature is stable until a calcination temperature of 650 °C is reached, at which point the subsequent light-off temperature then increases. This again corresponds to the temperature at which the formation of a distinct CuOx second phase is observed in the XRD pattern for Cu0.29Ce0.71O2−δ. This effect has been noted in a previous CO oxidation study using ceria doped with high concentrations of copper.57 It has also been shown that under certain conditions, copper has a tendency to segregate to the surface of nanoparticles when doped into ceria.2 Higher concentrations of copper on the particle surface will most likely lessen the accessibility to ceria, which is essential to provide oxygen for the reaction.
Conclusions
The facile lactic acid mediated approach for synthesizing Cu-doped ceria nanoparticles described here demonstrates the potential of using base precipitation as a synthesis route for controllably preparing nanoscale mixed oxide materials. By utilizing an intermediate binding strength ligand, intimately mixed Cu1−xCexO2−δ solid solution crystals can be formed directly at room temperature in aqueous solution with high dopant concentrations and crystallite sizes as low as 1.7 nm. The synthesis method outlined uses low cost, easily accessible precursors and can be easily be implemented in any chemistry lab or scaled-up for industrial production. Our synthesized particles also show competitive catalytic activity for the water gas shift and CO oxidation reactions when compared to more conventionally prepared counterpart materials that have been described in the literature.Conflicts of interest
There are no conflicts to declare.Acknowledgements
This material presented is the result of research work supported by the National Science Foundation under the EFRI-PSBR program, Grant No. 1332349 and the Lehigh University Accelerator program. Use of the Advanced Photon Source at Argonne National Laboratory was supported by the U. S. Department of Energy, Office of Science, Office of Basic Energy Sciences, under Contract No. DE-AC02-06CH11357. We are grateful to Dr Stephen C. Peters for his assistance with ICP-MS measurements.References
- W. Wang, P. Du, S. Zou, H. He, R. Wang, Z. Jin, S. Shi, Y. Huang, R. Si and Q. Song, ACS Catal., 2015, 5, 2088–2099 CrossRef CAS.
- J. S. Elias, N. Artrith, M. Bugnet, L. Giordano, G. A. Botton, A. M. Kolpak and Y. Shao-Horn, ACS Catal., 2016, 6, 1675–1679 CrossRef CAS.
- D. Gamarra, C. Belver, M. Fernández-García and A. Martínez-Arias, J. Am. Chem. Soc., 2007, 129, 12064–12065 CrossRef CAS PubMed.
- D. Gamarra, G. Munuera, A. B. Hungría, M. Fernández-García, J. C. Conesa, P. A. Midgley, X. Q. Wang, J. C. Hanson, J. A. Rodríguez and A. Martínez-Arias, J. Phys. Chem. C, 2007, 111, 11026–11038 CAS.
- W. Liu and M. Flytzani-Stephanopoulos, Chem. Eng. J., 1996, 64, 283–294 CAS.
- Y. Li, Q. Fu and M. Flytzani-Stephanopoulos, Appl. Catal., B, 2000, 27, 179–191 CrossRef CAS.
- X. Wang, J. A. Rodriguez, J. C. Hanson, D. Gamarra, A. Martnez-Arias and M. Fernndez-Garca, J. Phys. Chem. B, 2005, 109, 19595–19603 CrossRef CAS PubMed.
- D. S. Newsome, Catal. Rev.: Sci. Eng., 1980, 21, 275–318 CAS.
- N. Schumacher, A. Boisen, S. Dahl, A. A. Gokhale, S. Kandoi, L. C. Grabow, J. A. Dumesic, M. Mavrikakis and I. Chorkendorff, J. Catal., 2005, 229, 265–275 CrossRef CAS.
- V. Polshettiwar and R. S. Varma, Green Chem., 2010, 12, 743–754 RSC.
- G. Centi, P. Ciambelli, S. Perathoner and P. Russo, Catal. Today, 2002, 75, 3–15 CrossRef CAS.
- M. Cargnello, V. V. Doan-Nguyen, T. R. Gordon, R. E. Diaz, E. A. Stach, R. J. Gorte, P. Fornasiero and C. B. Murray, Science, 2013, 341, 771–773 CrossRef CAS PubMed.
- X. Wang, J. A. Rodriguez, J. C. Hanson, D. Gamarra, A. Martínez-Arias and M. Fernández-García, J. Phys. Chem. B, 2006, 110, 428–434 CrossRef CAS PubMed.
- J. Guzman, S. Carrettin and A. Corma, J. Am. Chem. Soc., 2005, 127, 3286–3287 CrossRef CAS PubMed.
- S. Sciré, S. Minico, C. Crisafulli, C. Satriano and A. Pistone, Appl. Catal., B, 2003, 40, 43–49 CrossRef.
- S. Golunski, R. Rajaram, N. Hodge, G. J. Hutchings and C. J. Kiely, Catal. Today, 2002, 72, 107–113 CrossRef CAS.
- A. Trovarelli, Catal. Rev.: Sci. Eng., 1996, 38, 439–520 CAS.
- W. Liu and M. Flytzani-Stephanopoulos, J. Catal., 1995, 153, 317–332 CrossRef CAS.
- W. J. Stark, L. Mädler, M. Maciejewski, S. E. Pratsinis and A. Baiker, Chem. Commun., 2003, 5, 588–589 RSC.
- V. S. Escribano, E. F. López, M. Panizza, C. Resini, J. M. G. Amores and G. Busca, Solid State Sci., 2003, 5, 1369–1376 CrossRef.
- J. Lee and S. Choi, Mater. Lett., 2004, 58, 390–393 CrossRef CAS.
- A. Migani, G. N. Vayssilov, S. T. Bromley, F. Illas and K. M. Neyman, Chem. Commun., 2010, 46, 5936–5938 RSC.
- S. Carrettin, P. Concepcin, A. Corma, J. M. Lpez Nieto and V. F. Puntes, Angew. Chem., Int. Ed., 2004, 43, 2538–2540 CrossRef CAS PubMed.
- J. Livage, M. Henry and C. Sanchez, Prog. Solid State Chem., 1988, 18, 259–341 CrossRef CAS.
- T. D. Golden and A. Q. Wang, J. Electrochem. Soc., 2003, 150, C624 CrossRef.
- H. Yakowitz, in Practical Scanning Electron Microscopy, ed. nonymous, Springer, U.S.A., 1975, pp. 327–372 Search PubMed.
- A. C. Larson and R. B. Von Dreele, General Structure Analysis System (GSAS), Los Alamos National Laboratory Report LAUR 86-748, 2000 Search PubMed.
- B. H. Toby, J. Appl. Crystallogr., 2001, 34, 210–213 CrossRef CAS.
- F. Zhang, P. Wang, J. Koberstein, S. Khalid and S. Chan, Surf. Sci., 2004, 563, 74–82 CrossRef CAS.
- A. Laachir, V. Perrichon, A. Badri, J. Lamotte, E. Catherine, J. C. Lavalley, J. El Fallah, L. Hilaire, F. Le Normand and E. Qumr, J. Chem. Soc., Faraday Trans., 1991, 87, 1601–1609 RSC.
- M. Romeo, K. Bak, J. El Fallah, F. Le Normand and L. Hilaire, Surf. Interface Anal., 1993, 20, 508–512 CrossRef CAS.
- F. Larachi, J. Pierre, A. Adnot and A. Bernis, Appl. Surf. Sci., 2002, 195, 236–250 CrossRef CAS.
- A. E. Martell and L. G. Sillen, Stability Constants Supplement No. 1, The Chemical Society, London, 1971 Search PubMed.
- L. Hidmi and M. Edwards, Environ. Sci. Technol., 1999, 33, 2607–2610 CrossRef CAS.
- S. Reed, Br. J. Appl. Phys., 1965, 16, 913 CrossRef CAS.
- W. Shan, W. Shen and C. Li, Chem. Mater., 2003, 15, 4761–4767 CrossRef CAS.
- S. Hočevar, U. O. Krašovec, B. Orel, A. S. Arico and H. Kim, Appl. Catal., B, 2000, 28, 113–125 CrossRef.
- M. Jobbgy, F. Marino, B. Schnbrod, G. Baronetti and M. Laborde, Chem. Mater., 2006, 18, 1945–1950 CrossRef.
- K. Pemartin-Biernath, A. V. Vela-Gonzlez, M. B. Moreno-Trejo, C. Leyva-Porras, I. E. Castaeda-Reyna, I. Jurez-Ramrez, C. Solans and M. Snchez-Domnguez, Materials, 2016, 9, 480 CrossRef PubMed.
- D. Andreeva, I. Ivanov, L. Ilieva, M. V. Abrashev, R. Zanella, J. W. Sobczak, W. Lisowski, M. Kantcheva, G. Avdeev and K. Petrov, Appl. Catal., A, 2009, 357, 159–169 CrossRef CAS.
- L. Yue and X. Zhang, J. Alloys Compd., 2009, 475, 702–705 CrossRef CAS.
- S. Deshpande, S. Patil, S. V. Kuchibhatla and S. Seal, Appl. Phys. Lett., 2005, 87, 133113 CrossRef.
- A. Aranda, E. Ayln, B. Solsona, R. Murillo, A. M. Mastral, D. R. Sellick, S. Agouram, T. Garca and S. H. Taylor, Chem. Commun., 2012, 48, 4704–4706 RSC.
- R. D. Shannon, Acta Crystallogr., Sect. A: Cryst. Phys., Diffr., Theor. Gen. Crystallogr., 1976, 32, 751–767 CrossRef.
- L. D. Jadhav, M. G. Chourashiya, A. P. Jamale, A. U. Chavan and S. P. Patil, J. Alloys Compd., 2010, 506, 739–744 CrossRef CAS.
- J. R. McBride, K. C. Hass, B. D. Poindexter and W. H. Weber, J. Appl. Phys., 1994, 76, 2435–2441 CrossRef CAS.
- G. Gouadec and P. Colomban, Prog. Cryst. Growth Charact. Mater., 2007, 53, 1–56 CrossRef CAS.
- S. Tsunekawa, K. Ishikawa, Z. Li, Y. Kawazoe and A. Kasuya, Phys. Rev. Lett., 2000, 85, 3440 CrossRef CAS PubMed.
- S. Poulston, P. M. Parlett, P. Stone and M. Bowker, Surf. Interface Anal., 1996, 24, 811–820 CrossRef CAS.
- M. Monte, G. Munuera, D. Costa, J. C. Conesa and A. Martnez-Arias, Phys. Chem. Chem. Phys., 2015, 17, 29995–30004 RSC.
- U. Holzwarth and N. Gibson, Nat. Nanotechnol., 2011, 6, 534 CrossRef CAS PubMed.
- P. Scherrer, Nachr. Ges. Wiss. Goettingen, Math.-Phys. Kl., 1912, 2, 98–100 Search PubMed.
- S. Sciré, C. Crisafulli, P. M. Riccobene, G. Patan and A. Pistone, Appl. Catal., A, 2012, 417, 66–75 CrossRef.
- H. Freund, G. Meijer, M. Scheffler, R. Schlögl and M. Wolf, Angew. Chem., Int. Ed., 2011, 50, 10064–10094 CrossRef CAS PubMed.
- S. Royer and D. Duprez, ChemCatChem, 2011, 3, 24–65 CrossRef CAS.
- E. T. Saw, U. Oemar, X. R. Tan, Y. Du, A. Borgna, K. Hidajat and S. Kawi, J. Catal., 2014, 314, 32–46 CrossRef CAS.
- F. Wang, R. Büchel, A. Savitsky, M. Zalibera, D. Widmann, S. E. Pratsinis, W. Lubitz and F. Schüth, ACS Catal., 2016, 6, 3520–3530 CrossRef CAS.
Footnote |
| † Electronic supplementary information (ESI) available: TGA analysis demonstrating vaporization of moisture and capping ligands; elemental analysis of residual precursor after precipitation; photograph of the Cu/lactic acid/ammonia system at various pH values; XRD spectra and GSAS fitting of the Cu0.35Ce0.65O2−δ sample; interplanar spacing and angles as determined through HAADF-STEM FFT analysis; Raman spectra of Cu1−xCexO2−δ samples; XPS spectra of as-synthesized copper doped ceria samples; lightoff curves for WGS reaction with copper–ceria catalysts; HAADF-STEM micrographs of supported Cu0.35Ce0.65O2−δ particles; XRD of pure ceria nanoparticles produced with varying lactic acid concentration. See DOI: 10.1039/c7ta07665g |
| This journal is © The Royal Society of Chemistry 2018 |

