One-pot synthesis of g-C3N4/MnO2 and g-C3N4/SnO2 hybrid nanocomposites for supercapacitor applications
Jithesh
Kavil
a,
P. M.
Anjana
b,
Pradeepan
Periyat
*a and
R. B.
Rakhi
 *b
*b
aDepartment of Chemistry, University of Calicut, Kerala, India-673635. E-mail: rakhiraghavanbaby@niist.res.in
bChemical Sciences and Technology Division, CSIR-National Institute of Interdisciplinary Sciences (CSIR-NIIST), Thiruvananthapuram, 695019, Kerala, India. E-mail: pperiyat@uoc.ac.in
First published on 27th July 2018
Abstract
Carbon materials with layered structures with their unique surface area and charge transport properties have been attracting significant attention as electrode materials in renewable energy storage devices. The rapid agglomeration of layered materials during electrochemical processes reduces their shelf life and specific capacitance, which can be prevented by the introduction of suitable spacers between the layers. Herein, we report the electrochemical performance of MnO2 and SnO2 metal oxide spacers incorporated layered graphitic carbon nitride g-C3N4 in a symmetric two electrode configuration. The as-prepared g-C3N4/MnO2 and g-C3N4/SnO2 hybrid nanocomposites act as efficient electrode materials for symmetric supercapacitors. The performance of the electrode materials is compared with that of bare g-C3N4. A remarkable increase in specific capacitance was obtained for the g-C3N4/MnO2 composite electrode (174 F g−1) when compared to the bare g-C3N4 electrode (50 F g−1) and g-C3N4/SnO2 electrode (64 F g−1). At a constant power density of 1 kW kg−1 the symmetric supercapacitors based on g-C3N4, g-C3N4/SnO2, and g-C3N4/MnO2 electrodes exhibited energy densities of 6.9, 8.8 and 24.1 W h kg−1 respectively.
1. Introduction
The storage of renewable energy and its release upon demand has been a significant technological matter of contention in recent years.1,2 Lithium-ion (Li-ion) batteries have been successful for the storage of renewable energy with high energy density.3,4 However, next generation hybrid vehicles, regenerative braking systems, and high power electronic devices demand high power density, large cycle life, and remarkably high safety and low cost. Supercapacitors have been widely employed as an alternative or in support of Li-ion batteries to address these demands.5,6 Supercapacitors possess much higher power density, excellent cycle stability, a wide temperature range of performance, intrinsically safe charge storage mechanism and they can be charged and discharged in seconds.7,8 Supercapacitors store charges either non-faradaically (EDLC capacitors) or faradaically (pseudocapacitors).9Nanocarbon materials such as activated carbon, carbon nanotubes, reduced graphene oxide and graphene oxide are widely used as electrode materials in EDLCs due to their high surface area and electronic conductivity.10 Nitrogen or sulphur doping in carbon-based materials is usually carried out to increase the wettability of the electrode surface with the electrolyte.11,12 However, nonmetal doping creates chemical inhomogeneity and thereby reduces the shelf life of the electrode material.
Graphitic carbon nitride g-C3N4 has emerged as an alternative for purely carbon-based EDLC electrode materials owing to its low cost, chemical and mechanical stability and intrinsically high nitrogen content.13 The lone pair of electrons present in the N atom of the ring structure of g-C3N4 induces more polarity in the molecule and enhances the wettability and the charge carrier mobility of the material.14
Bulk g-C3N4 exhibits a very low EDLC specific capacitance of 71 F g−1 and 81 F g−1 at a current density of 0.5 A g−1 and 0.2 A g−1 respectively due to its inherently low specific surface area and conductivity.15 Reports suggest that the electrochemical properties of bulk g-C3N4 can be enhanced dramatically by the incorporation of pseudocapacitive phases into the matrix of bare g-C3N4 which will facilitate the charge transport by a synergistic effect between faradaic and non-faradaic processes of electron transport.13,14
Transition metal oxides (TMOs) such as, RuO2, MnO2, V2O5, TiO2, SnO2etc. and Prussian blue (PB) are widely used as pseudocapacitive electrode materials. An ultralong V2O5@conducting polypyrrole composite exhibited enhanced supercapacitor performance along with superior rate capability and improved cycling stability.16 A challenging fabrication technique was reported on the synthesis of PB and its analogues (PBAs) which exhibit a high specific capacitance of 292 F g−1 in the neutral Na2SO4 aqueous electrolyte.17 Among the different pseudocapacitive materials MnO2 is of particular interest due to its high electrochemical activity, environmental compatibility, low cost and abundant availability on earth. Wang et al. reported the latest progress in MnO2-based nanocomposite electrodes to provide guidance for the design, manufacturing, and assembly of high-performance pseudocapacitive materials for supercapacitors.18
Various reports are available on the synthesis and electrochemical performance studies of transition metal oxide incorporated g-C3N4 nanocomposite electrodes. For a carbon-doped graphitic carbon nitride@MnO2 (CCNM) composite, Shan et al. reported a specific capacitance of 324 F g−1 in a three-electrode system at a current density of 0.2 A g−1 with capacitance retention of 80.2% after 1000 cycles.19 In another report, the same group evaluated the electrochemical performance of a single atom (K/Na) doped graphitic carbon nitride@MnO2 electrode in a three-electrode configuration.20 Chang et al. reported a maximum specific capacitance of 211 F g−1 at a current density of 1 A g−1 in a 0.5 M Na2SO4 electrolyte solution for the MnO2/g-C3N4 nanocomposite in a three electrode assembly.21 Recently Chen et al. reported the synthesis of a two dimensional hybrid structure of g-C3N4/CoS which exhibited a specific capacitance value of 668 F g−1 at a current density of 2 A g−1 which is higher than that of the individual components in a three electrode cell assembly.22 Ni (OH)2 nanoflowers were grown on sandwiched layers of g-C3N4 and reduced graphene oxide by Li et al.23 and this hybrid sample has shown an excellent specific capacitance of 1785 F g−1. In a recent report by Ansari et al.24 commercially purchased MoS2 and g-C3N4 were used for the preparation of a MoS2/g-C3N4 heterostructure and was used as a supercapacitor electrode in a three electrode cell. The hybrid sample delivered a high specific capacitance of 240 F g−1 compared to the bare MoS2 (48.77 F g−1) with good cyclic stability. Zhao et al.25 reported a g-C3N4 hybridised TiO2 nanoparticle assembly by a hydrothermal method which exhibited a high specific capacitance of 125.1 F g−1 at 1 A g−1 which can be attributed to the enhanced charge transport properties provided by g-C3N4 sheets. The results show that the electrochemical performance of g-C3N4 can be tailored by fabricating heterojunction materials with transition metal oxides and sulphides. Moreover, recent studies show that technocrats are keen on developing low cost and environmental friendly transition metal oxide hybrid materials as an alternative for RuO2 based supercapacitors owing to the exorbitant rate and toxicity of RuO2.26 Guan et al. studied the effect of morphology on the supercapacitance of a nanostructured NiCo2O4/graphitic carbon nitride nanocomposite in a three electrode configuration.27 Among the low cost and green electrodes, MnO2 and SnO2 based hybrid materials occupy special attention due to their excellent electrochemical performance.19
In all these reports, the electrochemical performances of the samples were measured in a three electrode configuration which is far different from the performance of the electrodes under actual device conditions. Compared to the three electrode configuration, measurements in a two electrode configuration are more suitable for evaluating the performance of supercapacitor test cells as they mimic the physical configuration and charge transfer that occur in real supercapacitor applications and thus provide the best indication of an electrode material's performance.
In the present work MnO2 and SnO2 were chemically grown directly over a 2D support of g-C3N4 to develop g-C3N4/MnO2 and g-C3N4/SnO2 nanohybrid materials. Symmetrical supercapacitors were fabricated using the synthesized composites and their electrochemical performances were compared with that of bare g-C3N4 in a two electrode cell assembly and the results are discussed.
2. Experimental
2.1. Synthesis of g-C3N4
Graphitic carbon nitride was synthesized by the simple pyrolysis of thiourea in a self-supported atmosphere in a covered crucible. In a typical procedure, 5 g of thiourea was dried at 80 °C/24 h and heated at 550 °C/3 h in a muffle furnace at a heating rate of 2 °C min.28 This method circumvents the requirement of the laborious experimental set up conventionally used for C3N4 synthesis. The yellow colored g-C3N4 so obtained was washed with 0.1 M HNO3 solution followed by several washings with deionised water to remove any residual alkaline species, then dried at 80 °C for 24 h in a hot air oven.2.2. Synthesis of the g-C3N4/MnO2 nanohybrid material
The MnO2 nanoflowers/g-C3N4 hybrid material was prepared by the oxidation reduction reaction between Mn2+ ion and Mn7+ ions.19 In a typical method, 200 mg of as prepared g-C3N4 powder was dispersed in 40 ml of deionised water containing 40 mM MnSO4 using a probe sonicator. The suspension was kept at a temperature of 80 °C/30 min under magnetic stirring in order to infuse Mn2+ ions on the surface of g-C3N4 layers. 150 ml of 33 mM KMnO4 solution which was previously kept at a temperature of 80 °C was added carefully to the above suspension under stirring. The stirring was continued for another 20 minutes by keeping the suspension at a temperature of 80 °C. The product obtained was washed with water, ethanol and dried in an air oven at a temperature of 100 °C for 8 h.2.3. Synthesis of the g-C3N4/SnO2 nanohybrid material
The g-C3N4/SnO2 composite sample was prepared by the chemical reduction method.19 200 mg of as-synthesized g-C3N4 was dispersed in deionised water by using an ultrasonicator for 20 minutes. 1 ml of 38% HCl was added to the above suspension just before the addition of 0.72 g tin(II) chloride (g-C3N4![[thin space (1/6-em)]](https://www.rsc.org/images/entities/char_2009.gif) :
:![[thin space (1/6-em)]](https://www.rsc.org/images/entities/char_2009.gif) SnO2 = 1
SnO2 = 1![[thin space (1/6-em)]](https://www.rsc.org/images/entities/char_2009.gif) :
:![[thin space (1/6-em)]](https://www.rsc.org/images/entities/char_2009.gif) 2). The sonication was continued for another 10 minutes and the solution was magnetically stirred at normal temperature for 2 hours. The product obtained was washed with water and ethanol, and dried in an air oven at 100 °C for 8 h. The dried powder sample was calcined at 350 °C for 2 h, for the development of the crystalline SnO2 phase on g-C3N4.
2). The sonication was continued for another 10 minutes and the solution was magnetically stirred at normal temperature for 2 hours. The product obtained was washed with water and ethanol, and dried in an air oven at 100 °C for 8 h. The dried powder sample was calcined at 350 °C for 2 h, for the development of the crystalline SnO2 phase on g-C3N4.
2.4. General characterization of the composites
The crystalline phase formation of the synthesized samples was analyzed with a Bruker X-ray diffractometer using copper Kα radiation (λ = 0.1546 nm) and a Jasco-FT/IR-4100 FTIR spectrometer. The surface morphology of the materials was analyzed using a JEOL/JEM 2100 transmission electron microscope and Carl-Zeiss Gemini-300 field emission scanning electron microscope. Surface area measurements were carried out on a BET surface area analyzer (Gemini 2375, Micromeritics, USA) after degassing the samples at 150 °C for 2 h.2.5. Electrode preparation and electrochemical measurements
Supercapacitor electrodes in 1.6 cm circular dimension were fabricated using g-C3N4, g-C3N4/MnO2, or g-C3N4/SnO2 by the following procedure. In a typical method the samples were mixed with PTFE in the ratio 95![[thin space (1/6-em)]](https://www.rsc.org/images/entities/char_2009.gif) :
:![[thin space (1/6-em)]](https://www.rsc.org/images/entities/char_2009.gif) 5 and dispersed in ethanol by ultrasonication. The slurry was coated on a conductive carbon cloth substrate (ELAT, NuVant Systems Inc.) and dried at 100 °C/6 h in a vacuum oven. Each electrode contained 4 mg of electroactive material and 0.2 g of PTFE binder, and the mass of the substrate material was 26 mg; thus the total mass of the electrode including the mass of the substrate was 30.2 mg. The electrodes were separated by a polymer separator (Celgard 3400) which was previously dipped in a 30% solution of KOH and were sandwiched on a supercapacitor test cell (ECC-std, EL-Cell GmbH). The electrochemical performances of the electrode materials were measured in a two-electrode configuration by cyclic voltammetry (CV), galvanostatic charge–discharge (CD) and electrochemical impedance spectroscopy (EIS) by using an electrochemical workstation (VMP3 Biologic). The measured capacitance is half of the capacitance of the freestanding electrode since the measurements are carried out in symmetric assemblies based on the basic circuit relationship of the series capacitors. The cell capacitance C can be obtained from the cyclic voltammogram and charge–discharge curve using the relationship:
5 and dispersed in ethanol by ultrasonication. The slurry was coated on a conductive carbon cloth substrate (ELAT, NuVant Systems Inc.) and dried at 100 °C/6 h in a vacuum oven. Each electrode contained 4 mg of electroactive material and 0.2 g of PTFE binder, and the mass of the substrate material was 26 mg; thus the total mass of the electrode including the mass of the substrate was 30.2 mg. The electrodes were separated by a polymer separator (Celgard 3400) which was previously dipped in a 30% solution of KOH and were sandwiched on a supercapacitor test cell (ECC-std, EL-Cell GmbH). The electrochemical performances of the electrode materials were measured in a two-electrode configuration by cyclic voltammetry (CV), galvanostatic charge–discharge (CD) and electrochemical impedance spectroscopy (EIS) by using an electrochemical workstation (VMP3 Biologic). The measured capacitance is half of the capacitance of the freestanding electrode since the measurements are carried out in symmetric assemblies based on the basic circuit relationship of the series capacitors. The cell capacitance C can be obtained from the cyclic voltammogram and charge–discharge curve using the relationship: | (1) |
 | (2) |
3. Results and discussion
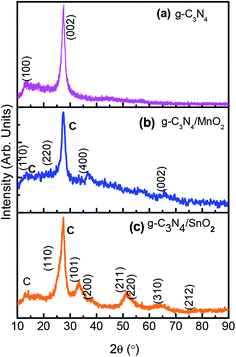
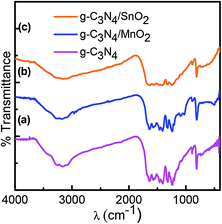
The X-ray diffraction pattern was used to confirm the crystalline phase analysis of the synthesized electrode materials. As observed in Fig. 1a, the sharp peak at 27.1 with an interplanar distance of 0.326 nm (002) originated from the layer stacking arrangement of conjugated aromatic systems in g-C3N4 and the peak at 13.1 is from the (100) plane formed in the crystal due to the presence of in-planar tri-s-triazine units.20 The crystalline phase of SnO2 in composite sample g-C3N4/SnO2 was confirmed by the presence of peaks at 2θ values at 26.8, 33.6, 38.1, 51.6, 53.4 and 63.6 which correspond to the reflection from (110), (101), (200), (211), (220), and (310) planes of tetragonal SnO2 (JCPDS card no. 41-1445). The XRD peaks of g-C3N4/MnO2 show four characteristic peaks situated at 2θ values which correspond to the lattice reflection from (110), (220), (400) and (002) planes of α-MnO2 having tetragonal symmetry (JCPDS card no. 44-0141). Compared to the g-C3N4/SnO2 hybrid material, g-C3N4/MnO2 has shown a partially crystalline nature as evidenced from the XRD spectrum. The amorphous nature of the material has been considered to be more beneficial for supercapacitor electrode application since it facilitates the wettability at the electrode–electrolyte interface and thereby increases the charge transport properties. Confirmation of the g-C3N4 phase in the composite samples is marked as (c) in the XRD spectrum.FTIR spectra of bare g-C3N4, g-C3N4/MnO2, and g-C3N4/SnO2 composite samples are depicted in Fig. 2. g-C3N4 (Fig. 2a) exhibits several peaks in the region 1200–1600 cm−1 representing the CN stretching vibrations of the heterocyclic ring. The peak at 810 cm−1 originates from the characteristic in-plane breathing vibrational mode of s-triazine units.30 The peak at 500–700 cm−1 in Fig. 2b was derived from the stretching vibrational modes of Mn–O and Mn–O–Mn bonds of MnO2 present in the composite sample. The peaks at 1100–1040 cm−1 in Fig. 2b originated from the bending vibrational modes of –OH groups attached to the surface of MnO2 molecules which indicates that the MnO2 in the composite sample g-C3N4/MnO2 was highly hydroxylated compared to other samples.31 The –OH bending vibrational modes at 1631 cm−1 and 1392 cm−1 in the figure were intermixed with the peaks of g-C3N4. The FTIR spectra of the g-C3N4/SnO2 composite (Fig. 2c) samples also show a distinct nanohybrid structure formed between the constituent phases. In addition to g-C3N4 peaks, the peaks at 450 cm−1 to 650 cm−1 indicate the characteristic vibrational modes of Sn–O bonds in SnO2.32 The broad peaks in all the samples at around 3200–3600 cm−1 can be attributed to the symmetric stretching vibrations of surface adsorbed H2O molecules.
The morphology and the microstructure of the composite samples were analyzed using transmission electron microscopy (TEM) and field emission scanning electron microscopy (FESEM). From Fig. 3a it is clear that MnO2 phases with flower type morphology was uniformly distributed in the g-C3N4 phase. While growing the MnO2 phase on the g-C3N4 sheets MnO2 crystallizes in the nanoflake morphology. These nanoflakes with high surface energy undergo molecular self-assembly to form more stable MnO2 nanoflowers on the surface of the g-C3N4 sheets. The SAED pattern with concentric rings indicates that the MnO2 phases were not formed in the perfect crystalline state, however they are in a partially crystalline state as observable from the XRD patterns. The SnO2 phases were precipitated over the g-C3N4 phase in spherical morphology and compared to the MnO2 phase they are more crystalline as observable from the SAED pattern in the figure. The surface morphology and the interaction between the constituent phases in the composite samples, g-C3N4/MnO2 and g-C3N4/SnO2 were further confirmed from the FESEM images represented in Fig. 3e and f respectively. The SEM images indicate the proper mixing of metal oxide nanostructures on the g-C3N4 phase.
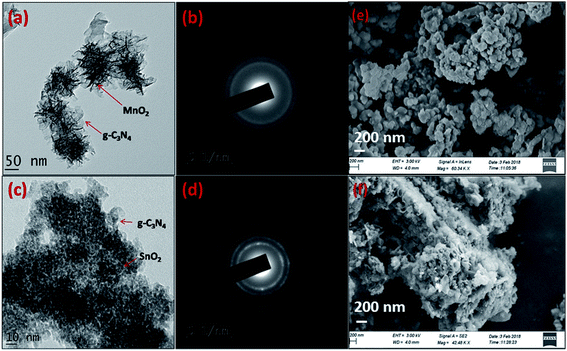 | ||
| Fig. 3 TEM images of (a) g-C3N4/MnO2 and (c) g-C3N4/SnO2; (b) & (d) corresponding SAED patterns and FESEM images of the composites (e) g-C3N4/MnO2, (f) g-C3N4/SnO2. | ||
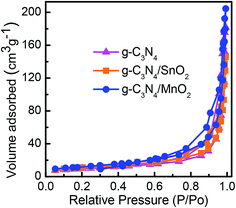
Nitrogen adsorption–desorption isotherms of various electrode samples are given in Fig. 4. All the samples exhibited a distinct type IV physisorption curve with a H3 hysteresis loop which according to IUPAC is the characteristic feature of mesoporous materials with pore size between 2 and 50 nm. The calculated surface area values from the isotherms were found to be 32.8 m2 g−1, 38.2 m2 g−1 and 70.2 m2 g−1 respectively for g-C3N4, g-C3N4/SnO2 and g-C3N4/MnO2 samples. The high BET surface area of g-C3N4/MnO2 can be attributed to the effective spacer effect of MnO2 nanoflowers in between the 2D layers of g-C3N4. The average BJH adsorption pore volume and the BJH desorption pore size values are given in Table 1. The average pore size value of g-C3N4 gets reduced while adding a metal oxide; this can be attributed to the incorporation of metal oxide particles in between the pores or the layers of lamellar g-C3N4. The average pore volume of MnO2 loaded samples increased effectively due to the porous nature of the MnO2 nanostructure as evidenced from the TEM images. The high surface area and pore volume of g-C3N4/MnO2 enable them to effectively interact with a large number of electrolyte ions for achieving better electrochemical performance than g-C3N4/SnO2 samples.
| Sample | BET surface area/m2 g−1 | Pore volume/cm3 g−1 | BJH desorption pore size/nm |
|---|---|---|---|
| g-C3N4 | 32 | 0.29 | 25.9 |
| g-C3N4/SnO2 | 38 | 0.23 | 20.7 |
| g-C3N4/MnO2 | 70 | 0.34 | 19.6 |
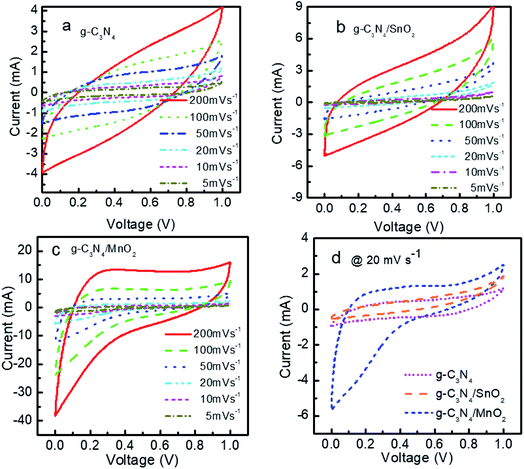
The electrochemical performance of the prepared electrode materials was measured in a symmetric two electrode configuration within the potential range from 0 to 1 V. The cyclic voltammograms of the symmetric supercapacitors based on g-C3N4, g-C3N4/SnO2 and g-C3N4/MnO2 electrodes at 5, 10, 20, 50, 100 and 200 mV s−1 are given in Fig. 5. All the three devices exhibited nearly rectangular CV curves. The enhanced current value in the CV loops of g-C3N4/MnO2 electrodes as compared to the other two devices indicates higher level of charge storage. Two types of mechanisms can be proposed for the pseudocapacitive charge storage in the MnO2 system. The first one is by the intercalation and extraction of a proton or metal cation into the oxide layers and the second is by the surface adsorption and desorption of the electrolyte cation or proton through the reaction denoted as33
| MnO2 + M+ + e− → MnOOM | (3) |
| MnO2(surface) + M+ + e− → MnOOM(surface) where (M+ = Na+, K+, H3O+) | (4) |
The absence of any redox peaks in the CV loops indicates that the charging and discharging of the electrodes occur at a pseudoconstant rate over the complete voltammetric cycle. The superior performance of the supercapacitor based on g-C3N4/MnO2 electrodes may be attributed to the improved surface area of the composite upon MnO2 loading (as confirmed from the BET results) and the pseudocapacitive contribution from MnO2 nanoflakes.
A comparison of the CV loops of different supercapacitors fabricated from various electrode materials at a scan rate of 20 mV s−1 is shown in Fig. 5d. For the same mass loading, the supercapacitor based on the g-C3N4/MnO2 electrode exhibited superior charge storage performance with negligible contact resistance.34Fig. 6 shows the general characteristics of the variation of specific capacitance with scan rates from 5 mV s−1 to 200 mV s−1. At a scan rate of 5 mV s−1, the specific capacitance values calculated from the CV loops of symmetric supercapacitors based on g-C3N4/MnO2, g-C3N4/SnO2 and bare g-C3N4 electrodes respectively are 192 F g−1, 93 F g−1 and 72 F g−1.
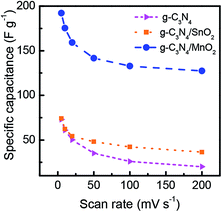 | ||
| Fig. 6 Variation of the specific capacitance of g-C3N4, g-C3N4/MnO2 and g-C3N4/SnO2 as a function of scan rate. | ||
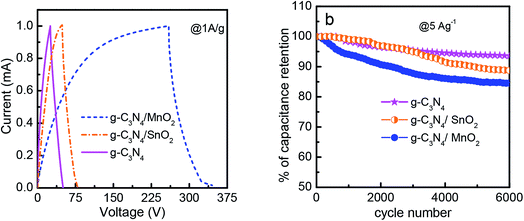
The galvanostatic charge–discharge (CD) curves of symmetric supercapacitors in the two electrode configuration at a constant current density of 1 A g−1 in the potential range of 0 to 1 V are shown in Fig. 7 and the value of specific capacitance is also calculated. The CD measurements are standard tests used to analyze the performance of an electrode material under practical operational conditions. The specific capacitance values of the supercapacitor device for various electrode materials were found to be 174 F g−1, 64 F g−1 and 50.22 F g−1 for g-C3N4/MnO2, g-C3N4/SnO2 and bare g-C3N4 respectively. The specific capacitance values obtained in the present study are lower than the values reported for MnO2 modified g-C3N4 composites in the 3- electrode configuration. But it is well-known that a three electrode measurement configuration always gives higher specific capacitance values than a two electrode configuration. The two electrode configuration is best suited to evaluate the performance in a real device.
The duration of the charge–discharge cycle for MnO2 modified g-C3N4 is extremely higher when compared to other supercapacitor devices with a very small IR drop value characteristic of electrodes with very small internal resistance. At a constant power density of 1 kW kg−1 the symmetric supercapacitors based on g-C3N4 and g-C3N4/SnO2 as electrodes exhibited energy densities of 6.9 and 8.8 W h kg−1 respectively, however the energy density of g-C3N4/MnO2 was three times higher (24.1 W h kg−1) than the energy densities of other electrodes.
The mass of the active material from a single electrode is only considered for the calculation of energy density. The formula used for the calculation of energy density is 1/2CspV2. When we calculate the energy density based on the total mass of active materials in both the electrodes, we need to replace the specific capacitance  Csp by gravimetric capacitance
  where M is the total mass of active materials in both the electrodes. For symmetric devices, M = 2m, Cg = Csp/4 and the energy density value becomes 1/4 times the value calculated based on Csp.
The enhancement in the electrochemical performance of the g-C3N4/MnO2 based supercapacitor can be attributed to the pseudocapacitive contribution from the high surface area MnO2 loaded electrode. However, the pseudocapacitive contribution from SnO2 in the g-C3N4/SnO2 electrode was found to be very small owing to the small BET surface area value of this electrode sample.
The stability performance of the supercapacitor devices was evaluated by conducting galvanostatic charge–discharge measurements for 6000 cycles at a constant current density of 5 A g−1 in the potential range between 0 and +1 V. The stability curves are shown in Fig. 7b. After 6000 charge–discharge cycles, symmetric supercapacitors based on g-C3N4, g-C3N4/MnO2 and g-C3N4/SnO2 electrodes exhibited a cycling stability of 94%, 85% and 87% respectively. The lower stability of the composites as compared to that of g-C3N4 is due to the presence of pseudocapacitive transition metal oxides which are less stable.
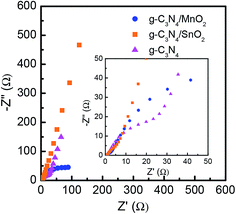
Electrochemical impedance spectroscopy (EIS) was used to further analyze the performance of the supercapacitor electrode materials. The electrochemical impedance spectra (Nyquist plots) of g-C3N4, g-C3N4/MnO2 and g-C3N4/SnO2 based supercapacitor devices are shown in Fig. 8. The Nyquist plot consists of a semicircle at the high-frequency region and a straight line at the low-frequency region. The high-frequency region determines the charge transport properties at the electrode–electrolyte interface. The diameter of the semicircle gives the value of charge-transfer resistance (Rct). The high-frequency region of the impedance spectra is depicted in the inset of Fig. 8. A vertical line in the low-frequency region suggests an ideal capacitive behavior. But if the line makes an angle 45° with the real axis, it is called the Warburg line which results from the frequency dependence of ion diffusion in the electrolyte to the electrode interface. The length of the straight line at a low frequency range is associated with the ion diffusion resistance of the electrolyte ions into the bulk electrode. Shorter length of the Warburg line indicates that the electrode offers lower impedance to the diffusion of electrolyte ions, thereby offering improved charge storage performance. Any deviation from the vertical nature or the 45° inclination can be attributed to the porous nature of the electrodes. The length of the straight line in the low-frequency region is the shortest for the MnO2 loaded g-C3N4 electrode and it also shows the minimum Rct value, indicating the superior capacitive performance as compared to bare g-C3N4 and g-C3N4/SnO2.
4. Conclusions
Pseudocapacitive MnO2 and SnO2 anchored g-C3N4 nanosheets g-C3N4/MnO2 and g-C3N4/SnO2 were synthesized via a one-pot chemical reduction technique. XRD, FTIR and TEM studies demonstrated good homogeneity between the constituent phases. The electrochemical performance of the bare g-C3N4 was found to be enhanced remarkably by MnO2 incorporation. The specific capacitance values of g-C3N4, g-C3N4/SnO2 and g-C3N4/MnO2 calculated from the charge–discharge curves were found to be 50.22 F g−1, 64 F g−1, and 174 F g−1 respectively and the corresponding energy density values at a constant power density of 1 kW kg−1 are 6.9, 8.8 and 24.1 W h kg−1. The performance increase in the g-C3N4/MnO2 hybrid electrode material was attributed to the spacer effect of MnO2 nanoflowers in between the g-C3N4 layers which enhance the BET surface area and thereby facilitate excellent charge transport at the electrode–electrolyte interfaces. The present work can be used as a platform for the development of modified carbon-based electrode materials for electrochemical storage device applications.Conflicts of interest
There are no conflicts to declare.Acknowledgements
R. B. Rakhi acknowledges the support of Ramanujan Fellowship, Department of Science and Technology (DST), Govt. of India and CSIR-NIIST Thiruvananthapuram, India. Jithesh Kavil is grateful to University Grants Commission, Govt. of India for the FDP fellowship.References
- W. Jian-Gan, L. Hongzhen, Z. Xingyuan, L. Xu, L. Xingrui and K. Feiyu, Small, 2018, 14, 1703950 CrossRef PubMed.
- J. G. Wang, H. Z. Liu, H. H. Sun, W. Hua, H. W. Wang, X. R. Liu and B. Q. Wei, Carbon, 2018, 127, 85–92 CrossRef.
- M. Armand and J. M. Tarascon, Nature, 2008, 451, 652 CrossRef PubMed.
- D. Damien, G. S. Anjusree, A. Sreekumaran Nair and M. M. Shaijumon, RSC Adv., 2016, 6, 45802–45808 RSC.
- M. D. Stoller and R. S. Ruoff, Energy Environ. Sci., 2010, 3, 1294–1301 RSC.
- R. B. Rakhi, D. Cha, W. Chen and H. N. Alshareef, J. Phys. Chem. C, 2011, 115, 14392–14399 CrossRef.
- P. Simon and Y. Gogotsi, Nat. Mater., 2008, 7, 845 CrossRef PubMed.
- R. Kötz and M. Carlen, Electrochim. Acta, 2000, 45, 2483–2498 CrossRef.
- G. H. Yu, X. Xie, L. J. Pan, Z. N. Bao and Y. Cui, Nano Energy, 2013, 2, 213–234 CrossRef.
- M. Inagaki, H. Konno and O. Tanaike, J. Power Sources, 2010, 195, 7880–7903 CrossRef.
- J. Zhang, X. Zhang, Y. Zhou, S. Guo, K. Wang, Z. Liang and Q. Xu, ACS Sustainable Chem. Eng., 2014, 2, 1525–1533 CrossRef.
- L.-F. Chen, X.-D. Zhang, H.-W. Liang, M. Kong, Q.-F. Guan, P. Chen, Z.-Y. Wu and S.-H. Yu, ACS Nano, 2012, 6, 7092–7102 CrossRef PubMed.
- L. Chao, W. Dongxing, Z. Jingjing, H. Song and C. Wei, Adv. Funct. Mater., 2017, 27, 1606219 CrossRef.
- G. Yutong, L. Mingming and W. Yong, ChemSusChem, 2015, 8, 931–946 CrossRef PubMed.
- M. Tahir, C. Cao, N. Mahmood, F. K. Butt, A. Mahmood, F. Idrees, S. Hussain, M. Tanveer, Z. Ali and I. Aslam, ACS Appl. Mater. Interfaces, 2014, 6, 1258–1265 CrossRef PubMed.
- J.-G. Wang, H. Liu, H. Liu, W. Hua and M. Shao, ACS Appl. Mater. Interfaces, 2018, 10, 18816–18823 CrossRef PubMed.
- J.-G. Wang, Z. Zhang, X. Zhang, X. Yin, X. Li, X. Liu, F. Kang and B. Wei, Nano Energy, 2017, 39, 647–653 CrossRef.
- J.-G. Wang, F. Kang and B. Wei, Prog. Mater. Sci., 2015, 74, 51–124 CrossRef.
- Q. Y. Shan, B. Guan, S. J. Zhu, H. J. Zhang and Y. X. Zhang, RSC Adv., 2016, 6, 83209–83216 RSC.
- Q. Y. Shan, X. L. Guo, F. Dong and Y. X. Zhang, Mater. Lett., 2017, 202, 103–106 CrossRef.
- C. Xueting, Z. Xinxin, S. Shibin, G. Danxia, D. Lihua, Y. Yansheng and Z. Yanqiu, Nanotechnology, 2017, 28, 135705 CrossRef PubMed.
- D. Jiang, Q. Xu, S. Meng, C. Xia and M. Chen, J. Alloys Compd., 2017, 706, 41–47 CrossRef.
- L. Li, J. Qin, H. Bi, S. Gai, F. He, P. Gao, Y. Dai, X. Zhang, D. Yang and P. Yang, Sci. Rep., 2017, 7, 43413 CrossRef PubMed.
- S. A. Ansari and M. H. Cho, Sci. Rep., 2017, 7, 43055 CrossRef PubMed.
- Y. Zhao, L. Xu, S. Huang, J. Bao, J. Qiu, J. Lian, L. Xu, Y. Huang, Y. Xu and H. Li, J. Alloys Compd., 2017, 702, 178–185 CrossRef.
- R. B. Rakhi, W. Chen, D. Cha and H. N. Alshareef, J. Mater. Chem., 2011, 21, 16197–16204 RSC.
- B. Guan, Q. Y. Shan, H. Chen, D. Xue, K. Chen and Y. X. Zhang, Electrochim. Acta, 2016, 200, 239–246 CrossRef.
- S. Panneri, P. Ganguly, B. N. Nair, A. A. P. Mohamed, K. G. K. Warrier and U. N. S. Hareesh, Environ. Sci. Pollut. Res., 2017, 24, 8609–8618 CrossRef PubMed.
- V. Khomenko, E. Frackowiak and F. Béguin, Electrochim. Acta, 2005, 50, 2499–2506 CrossRef.
- G. Liao, S. Chen, X. Quan, H. Yu and H. Zhao, J. Mater. Chem., 2012, 22, 2721–2726 RSC.
- H. Chen, Y. Wang and Y.-K. Lv, RSC Adv., 2016, 6, 54032–54040 RSC.
- Z.-A. Hu, Y.-L. Xie, Y.-X. Wang, L.-P. Mo, Y.-Y. Yang and Z.-Y. Zhang, Mater. Chem. Phys., 2009, 114, 990–995 CrossRef.
- W. Xiao, H. Xia, J. Y. H. Fuh and L. Lu, J. Power Sources, 2009, 193, 935–938 CrossRef.
- B. Babu, S. G. Ullattil, R. Prasannachandran, J. Kavil, P. Periyat and M. M. Shaijumon, ACS Sustainable Chem. Eng., 2018, 6, 5401–5412 CrossRef.
| This journal is © The Royal Society of Chemistry 2018 |

