Rechargeable organic–air redox flow batteries†
P.
Leung
a,
D.
Aili
 b,
Q.
Xu
c,
A.
Rodchanarowan
d and
A. A.
Shah
 *e
*e
aDepartment of Materials, University of Oxford, Oxford, OX1 3PH, UK
bDepartment of Energy Conversion and Storage, Technical University of Denmark, Kemitorvet, Building 207, DK-2800 Kgs. Lyngby, Denmark
cSchool of Energy and Power Engineering, Jiangsu University, Zhenjiang 212013, China
dDepartment of Materials Engineering, Faculty of Engineering, Kasetsart University, 50 Ngamwongwan Rd., Ladyao, Chatuchak, Bangkok, 10900, Thailand
eSchool of Engineering, University of Warwick, Coventry CV4 7AL, UK. E-mail: Akeel.Shah@warwick.ac.uk
First published on 3rd August 2018
Abstract
A rechargeable organic–air flow battery based on aqueous electrolytes is proposed and tests are conducted in a divided cell with a three-electrode configuration. Quinoxaline is used as the negative redox couple due to its low electrode potential of c.a. −0.9 V vs. Hg|HgO in aqueous electrolytes. High-surface-area nickel mesh and manganese-dioxide electrodes were employed for oxygen evolution and reduction, respectively, together with a low-cost hydroxide doped polybenzimidazole (m-PBI) separator (c.a. 20 μm). In typical alkaline electrolytes (2 M NaOH), the open-circuit voltage of the flow battery was c.a. 0.95 V, which is comparable to existing organic-based batteries. The average charge and discharge cell voltage ranges at 5–10 mA cm−2 were 1.7–1.95 V and 0.4–0.7 V, respectively. Despite using low-cost materials, average coulombic and energy efficiencies of the batteries were c.a. 81 and 25%, respectively, at 7.5 mA cm−2 over 20 cycles.
Introduction
Redox flow batteries have been investigated extensively for mid- to large-scale applications. These devices are not reliant on geological or geographical factors, in contrast to hydro and compressed-air storage, and are more easily up-scaled than conventional batteries.1–3 However, the capital costs of conventional flow batteries, e.g., all-vanadium, are still too high (>USD$ 250 per kW h) for extensive market penetration, due mainly to the use of expensive active materials (e.g., vanadium: c.a. USD$ 25 per kg) and fluorinated ion-exchange membranes (Nafion® 117: c.a. USD$ 250 per m2); in previous cost models,4 they are estimated to be more than 30% and 40% of the overall capital cost, respectively. In order to meet the US Department of Energy (DoE) cost target of USD$ 100 to 150 per kWh, it is perhaps necessary to use lower-cost alternative materials rather than rely on (possible) economies of scale.5 Suitable candidates are organic active species (e.g., quinone,6–8 alloxazine,9 viologen,10,11 and dione12), which are reversible and involve multi-electron transfers. The use of such organic species has been demonstrated in a number of aqueous and non-aqueous systems.13–16Despite their wider electrochemical stability window, non-aqueous electrolytes are often flammable, volatile and moisture-sensitive. Furthermore, the cost and ionic conductivities are not competitive compared to their aqueous counterparts. As reported in a recent cost study,17,18 it is important to obtain cell voltages as high as 3 V in order to meet the DoE cost target. This is a highly challenging target based on the current status of non-aqueous flow battery chemistries.13 For these reasons, the focus of this paper is an organic redox flow battery concept based on aqueous electrolytes. Bearing in mind that many organic active materials have limited solubilities (<2 M) in aqueous electrolytes, an air or oxygen positive electrode could provide a means of increasing the energy densities, as in various (aqueous) metal–air batteries.19 However, the storage capacities of existing metal–air batteries (e.g., zinc–air) are still limited to < 1000 mA h cm−2 by the electrodeposition process at the metal anode.20
Recently, Chiang and co-workers21 proposed a sulfur-air flow battery, using soluble polysulfide electrolytes. Despite the use of low-cost active materials (<US$ 10 per kW h), the proposed system also employed expensive cell components, such as a ceramic super-ionic conductor separator (LiSICON) and noble-metal catalysts (IrO2 and Pt black) for the oxygen evolution/reduction reactions.21 The ceramic film used to separate the negative (alkaline) and positive (acidic) electrolytes was up to 150 μm thickness. The ionic conductivities of most LiSICON films are c.a. 0.28–0.6 mS cm−1 between 20 and 55 °C.21 Moreover, it is known that metal ions (e.g., Ti(IV)) within the ceramic structure (e.g., Li2+x(Al1+xTi1−x)(PO4)3) have a tendency to undergo reduction by protons in acidic electrolytes (<pH 7), resulting in a lower ionic conductivity in the long-term.22
Although the oxygen electrode potential is higher in acidic electrolytes (+1.23 V vs. SHE compared to +0.40 V vs. SHE in alkaline media), alkaline electrolytes provide the possibility of using low-cost catalysts (transition or other metal oxides) rather than noble metal catalysts for oxygen evolution and reduction.19 In this study we therefore use alkaline electrolytes in both half cells. Without compromising the battery voltage, the alternative active materials for the negative half-cell should be based on abundant sources, such as organic materials, and have lower electrode potentials than the reported polysulfide species (−0.447 V vs. SHE), as well as potentials that are comparable to those used in aqueous metal–air batteries (e.g., zinc, < −0.7 V vs. SHE).
Aziz and co-workers7 used 2,6-dihydroxyanthraquinone in an alkaline organic–inorganic flow battery with a negative electrode potential of −0.7 V vs. SHE and a solubility of 0.6 M for the active species in a 1 M hydroxide electrolyte. On the other hand, Brushett and co-workers23 evaluated the voltammetric behavior of quinoxaline under a wide range of electrolyte compositions (from acidic to alkaline, also in non-aqueous electrolytes24). Their study revealed that this molecule has an electrode potential as negative as −0.8 V vs. SHE (more negative than c.a. −2.6 V vs. Li in non-aqueous propylene carbonate) and a solubility of up to 4 M in hydroxide electrolytes. However, to the best of our knowledge, the charge–discharge profiles of quinoxaline static batteries are described only in a recent patent.25
Compared to the use of acidic electrolytes in both half-cells, the use of alkaline electrolytes is less common in redox flow batteries and is mainly limited to certain hybrid systems using electrodeposited metal anodes (e.g., zinc-ferricyanide).20 These systems are often less demanding in terms of the crossover of active species between the two half cells. In contrast, a large number of separators/membranes have been evaluated in the contexts of alkaline fuel cells and electrolyzers, in which the current densities are often higher than 100 mA cm−2. Compared to conventional porous separators (filled with an aqueous base) and anion-exchange membranes, ion-solvating polymer membranes, particularly polybenzimidazole (PBI) membranes, have received a great deal of attention in recent years due to their selectivities, negligible electro-osmatic drag and strong mechanical properties.26,27 The pore sizes of PBI membranes often range from 0.5 nm to 2.0 nm, on average smaller than those in Nafion® membranes (2–4 nm, based on parallel water channel model).26,28
By doping in a strong alkaline, such membranes allow aqueous hydroxide to be dissolved within their structures. As a consequence of their nano-sized pores, crossover issues can be minimized and thinner membranes can be used.29 PBI membranes have been proposed for all-vanadium redox flow batteries, where strong acids (e.g., 2 M H2SO4) are used in both half-cells.26,27 Although the proton conductivities of PBI membranes (<20 mS cm−1) are still several factors smaller than those of Nafion® membranes (50–120 mS cm−1) in concentrated acids (>2 M H+),26,31 these membranes have been prepared with low thickness (<30 μm), resulting in higher energy efficiencies than their Nafion® counterparts (thickness > 50 μm).26,27
Among a number of PBI derivatives, poly(2,20-(m-phenylene)-5,50 -bibenzimidazole) (m-PBI) is the most widely used due to its processing characteristics and straightforward synthesis routes. The performance of m-PBI membranes depends on the hydroxide concentrations in the electrolytes. The preparation method and physiochemical properties of this membrane, e.g., volume change and chemical stability, have been evaluated by one of the authors in recent studies.29,30 Together with this membrane, we intend to use low-cost materials, e.g., nickel and manganese dioxide, as electrodes to facilitate the sluggish oxygen (evolution/reduction) reactions. Since oxygen evolution is known to have a much larger overpotential than the reduction reaction, a high-surface-area nickel mesh was used to minimize the overpotential. On the other hand, an ‘air-breathing’ manganese dioxide electrode was used for the oxygen reduction process, which can discharge at up to 100 mA cm−2 with an overpotential of a few hundred mV, in primary zinc–air batteries. The overall descriptions of the experimental designs are available in the ESI.†
Based on the aforementioned materials, this study evaluated the fundamental electrochemical characteristics of the quinoxaline and air electrode reactions, which are essential to the development of a proof-of-concept organic–air flow battery (illustrated in Fig. 1). During the charging process, quinoxaline is reduced in the negative half-cell to form mainly as a divalent anion radical through a single wave process (a two-electron transfers), which is later reduced during the discharge process.21 However, several alternative routes are described in ESI.†
 | (1) |
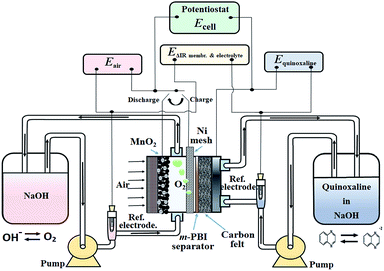 | ||
| Fig. 1 Schematic illustration of the working principle and the electrical connections of the proposed organic–air flow battery. | ||
In the positive half-cell, oxygen evolution and reduction are the same as in most aqueous metal–air batteries:19
 | (2) |
Considering that oxygen is the charged active product and is continuously supplied from atmospheric air, the circulation of the positive electrolyte in this proof-of-concept battery was to avoid trappings of oxygen bubbles generated during the charging (oxygen evolution) process, which have a tendency to displace the electrolyte for the case of a static system. In practical systems, the volume and flow rate of the positive electrolyte should be minimized to reduce the pumping losses and improve the energy densities. Furthermore, it should be noted that these reactions are represented in the charging direction and are significantly different in acidic electrolytes (ESI†). The overall discharge voltage is expected to be lower than the theoretical value due to the substantial overpotentials of the oxygen reactions.
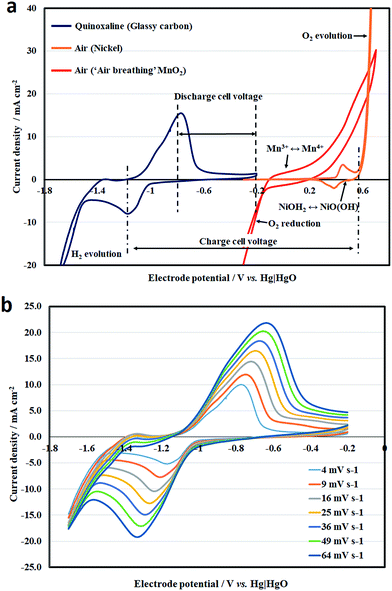
Fig. 2a shows the combined voltammograms of the quinoxaline reaction and oxygen evolution, in which the measurements were made by sweeping the electrode potential at 10 mV s−1 under static electrolyte conditions. The working electrode for the negative electrode reaction was glassy carbon. On the other hand, both nickel and manganese oxide were used at the positive electrode. It can be seen that the reduction of quinoxaline involves a pair of reduction and oxidation peaks at c.a. −1.0 V vs. Hg|HgO, and appears to be a quasi-reversible process before excessive hydrogen evolution is observed at highly negative potentials (<−1.58 V vs. Hg|HgO). The cathodic and anodic peaks were observed at −1.2 and −0.8 V vs. Hg|HgO, respectively. The overall voltammogram was similar to those reported by Milshtein et al.23 under similar conditions, which provided strong evidence of the two-electron transfer nature of quinoxaline.
Fig. 2b shows the effect of the potential sweep rate (4 to 64 mV s−1) on the cyclic voltammetry of quinoxaline on a glassy carbon electrode under the same conditions. The cathodic and anodic peak current densities increased linearly with the square root of the potential sweep rates, as indicated by the Randles–Sevick relationship (Fig. S4†), suggesting that the reaction was diffusion controlled:
 | (3) |
For the oxygen (evolution or reduction) reactions, cyclic voltammetry was carried out in different geometries. Since the nickel electrode is not permeable to air, it was immersed completely in the solution for oxygen evolution. For these reasons, the reversible peaks observed at c.a. +0.4 V vs. Hg|HgO do not correspond to the oxygen electrode reaction. Instead, they are attributed to the surface conversion of nickel hydroxide (Ni(OH)2 + OH− ↔ NiO(OH) + H2O + e−), as generally described in the literature.32 It should be noted that a thin layer of NiOH2 is formed instantly when nickel is in contact with the hydroxide solution, as indicated by a relatively small current density (3 mA cm−2). The corresponding charge (c.a. 1 m C cm−2) was equivalent to a monolayer of a slightly rough surface32 and resulted in an ultrafast pseudo capacitive behaviour. In comparison, oxygen evolution tends to take place at a potential that is more positive than +0.6 V vs. Hg|HgO and the rate increases significantly toward more positive potentials. Despite the relatively large current density, the overpotential of oxygen evolution was significant, and needs to be further reduced.
The commercial manganese-dioxide electrode contained a porous PTFE film, which minimized pore-flooding by the electrolyte and enabled air to enter into the electrode from the other side of the electrode. Different from the negative quinoxaline reaction, no distinct peak is observed in the voltammogram, as reported in the literature.33,34 In addition to the oxygen evolution/reduction reactions, the voltammetric response tends to include the redox reaction of Mn3+/Mn4+ and the double-layer charge storage of the high-surface-area porous carbon. In alkaline electrolytes, the electrochemical reduction of MnO2 to MnOOH (MnO2 + H2O + e− ↔ MnOOH + OH−) takes place alongside the reduction of oxygen.33,34
MnO2 has a more positive electrode potential than that of the oxygen reaction, so the reduction product Mn3+ is easily oxidized back to MnO2, resulting as a quasi-reversible process.34 The voltammogram in Fig. 2a shows that the cathodic and anodic current at the MnO2 electrode become appreciable at c.a. +0.2 and c.a. −0.1 V vs. Hg|HgO, respectively. The discharge performance was briefly in line with the technical information provided by the supplier in concentrated hydroxide (e.g., 6.6 M OH−). It is also important to note that both oxygen evolution and reduction tend to be more favourable at concentrated hydroxide solutions,19,32 which tend to decrease the solubility limit of quinoxaline (4.5 M in pure deionized water; 0.5 M in 1 M OH−; < 0.2 M in 2 M OH−).23
Based on the combined voltammogram in Fig. 2a, the charge and discharge voltages were estimated to be 1.8 and 0.8 V, respectively. The half-cell reactions were further investigated independently at 7.5 mA cm−2 in a parallel plate flow cell using practical electrode materials. Conventional high surface area carbon felts were used as the negative electrode materials, while a nickel mesh and a commercial positive manganese-dioxide ‘air-breathing’ electrode were used at the positive electrode. Nickel mesh is known to be chemically stable35 and the metal oxide and hydroxide are efficient catalysts for oxygen evolution.36 On the other hand, manganese oxides are attractive catalysts for oxygen reduction due to their rich oxidation states and crystal structures.37 They have been commercialized for a number of applications.38
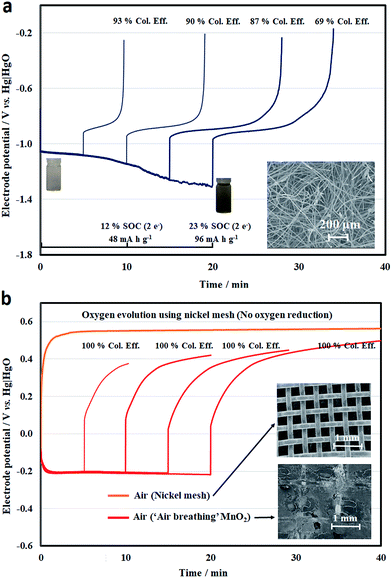
By ignoring the influence of the other electrode, the half-cell electrode performance was evaluated for different charge–discharge durations, representing different states-of-charge (SOCs) (Fig. 3a and b). For the negative half-cell, the electrolyte was 50 mM quinoxaline in 2 M NaOH, which was initially almost colourless and turned to yellow during the reduction process. At a higher hydroxide concentration, the colour was less visible than in previous work using <0.1 M OH−.23 However, the overall colour change was not particularly obvious during the electrochemical processes. Throughout the reduction and oxidation processes, the electrode potentials were c.a. −1.13 and c.a. −0.85 V vs. Hg|HgO, respectively, showing that the overpotential was relatively small with the high-surface-area carbon felt electrode, as shown in Fig. 3a.
When more quinoxaline had been reduced (>15 min), however, hydrogen evolution became more dominant at more negative electrode potentials (<−1.25 V vs. Hg|HgO), resulting in coulombic efficiencies of lower than 80%. Despite the two-electron transfer, the usable capacity was only 20% of its theoretical value (412 mA h g−1, 2 electron-transfers). However, this value was still higher than previous work using non-aqueous solvents (e.g., propylene carbonate) in an inert environment (glovebox).39
For the positive half-cell electrode reactions, a nickel mesh and ‘air-breathing’ manganese dioxide were used for the oxygen evolution and reduction reactions, respectively (Fig. 3b). In the case of the nickel mesh, only the oxygen evolution profile is shown in Fig. 3b, since the electrode potential reached a value more negative than −0.8 V vs. Hg|HgO in the first few minutes of the reduction process. This demonstrates that oxygen reduction was not effective with this material (or/and geometry). However, the electrode potential of oxygen evolution tended to be relatively stable at around +0.55 V vs. Hg|HgO over different charge durations (and less than +0.6 V vs. Hg|HgO for more than 4 h). This potential was slightly lower than that observed in the earlier voltammogram, with the reduced overpotential attributed to the mesh electrode.
On the other hand, a certain reversibility was observed on the charge–discharge response with the use of the ‘air-breathing’ manganese dioxide electrode, which could be partly due to the redox reactions of Mn3+/Mn4+ and the double-layer charge storage of porous carbon.33,34 Compared to the oxidation potential profile on the nickel mesh, the potential on manganese dioxide tended to be lower in the beginning and increased gradually over time. For the reduction process, the electrode potential was relatively stable at c.a. −0.2 V vs. Hg|HgO. However, prolonged oxidation (e.g., 10 h) has a tendency to damage the manganese dioxide electrode. It has been observed that both MnO2 and carbon particles detach from the electrode surface (ESI†) and result in weight loss of up to 26%.
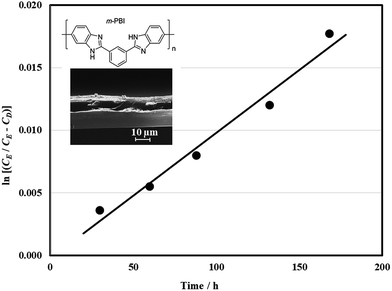
For the reasons above, a three-electrode configuration was selected for charge–discharge cycling in a full-battery. In contrast to the half-cell study, the full battery was influenced by the two half-cell reactions and the other cell components. The separator was particularly important since it minimized the crossover of the active species to the other compartments. The permeation of quinoxaline species through the hydroxide doped m-PBI membrane (20 μm, inset in Fig. 4) by diffusion was evaluated in a dialysis cell (ESI†). Quinoxaline molecules diffuse through the membrane towards the deficient side under a concentration gradient. In Fig. 4, the change in quinoxaline concentration (in the form ln(cE (cE − cD))) is plotted against time. The gradient of this line was used to calculate the diffusion coefficient value of 3.4 × 10⁻⁸ cm2 min−1, which is significantly smaller than the values for vanadium ions across the expensive Nafion® ion-exchange membrane (×10−6 cm2 min−1) and is comparable to those using similar membranes (×10−8 cm2 min−1).40
The main drawback of this separator was its relatively large area resistance in less concentrated hydroxide solutions (<2 M OH−); it can be 2–3 times less conductive than at c.a. 3.6 M OH−.29,30 Lower concentrations can lead to poorer performance for the oxygen evolution reaction19,32 but higher solubility for the quinoxaline species23 (solubility limits: c.a. 0.12 M in 2 M NaOH, c.a. 0.2 M in 1 M NaOH, c.a. 0.5 M in 0.5 M NaOH). As in the case of quinones for aqueous electrolytes, the solubilities of quinoxaline can be increased with certain functional groups, such as –SO3H, –PO3H2, –COOH, –OH.41
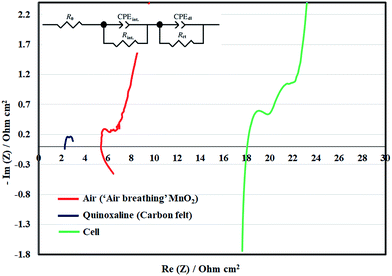
When 2 M NaOH was used as in this work, the area resistance of the separator was c.a. 11 Ω cm2, as determined by both impedance and ohmic drop measurements. This was consistent with previous findings that resistances are several factors higher in alkaline than in acidic electrolytes.13 In addition to the separator, there are also contact resistances associated with each electrode. Fig. 5 shows the Nyquist impedance plots of the half-cells and the full battery, from which the contact resistances and activities of the electrodes can be estimated. The impedance of the full battery is larger than the combined impedance of the half-cells due to the contribution of the separator. In general, the impedance of quinoxaline electrode was smaller than that of the air electrode, since the reaction on the former was facilitated by the high-surface-area carbon felt electrodes. The resistance values based on curve fitting are provided in Table S1.†
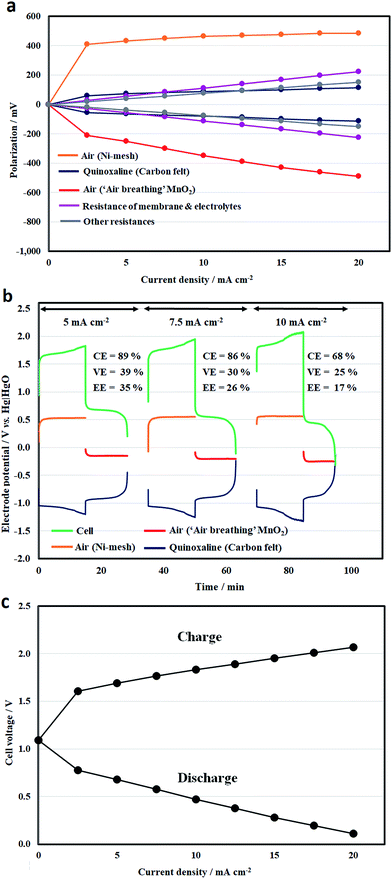
In a full battery, however, the overall cell potential drop between charge and discharge was mainly caused by the overpotentials of the air electrode reactions, as illustrated in Fig. 6a. These overpotential values were obtained by subtracting the equilibrium potentials (open-circuit potentials) from the measured values (Eneg or Epos) through the reference electrodes (η = E − Eeq), which represents the activation and mass transport losses. The ohmic drop across the separator (and the electrolytes) can be measured between the two reference electrodes. The ohmic drop contributions of the other components, e.g., electrical contacts, can be obtained by deducting the membrane values from the overall ohmic drop (IRoverall = Ecell − EIR-free, where EIR-free = Eneg − Epos).
Even at low current densities, the overpotentials were more than 400 mV and 200 mV for the oxygen evolution and reduction reactions (using a nickel mesh and an ‘air-breathing’ manganese dioxide, respectively). At 5 mA cm−2, the overpotentials (<700 mV) are comparable to those in the literature.19,41 Rather than using conventional electrode materials, the oxygen overpotentials can be further improved with recently developed low-cost catalysts, such as iron oxide and nitrogen doped carbon for the evolution and reduction reactions, respectively.32,42
However, the obtained overpotential values did not increase significantly at higher current densities. This is consistent with the voltammetric results in Fig. 2a and the relatively low charge-transfer resistance obtained through (half-cell) impedance spectroscopy in Fig. 5. On the other hand, the overpotentials at the quinoxaline electrode were lower than 120 mV in this current density range (up to 20 mA cm−2) due to the use of high-surface-area felt electrodes. Despite the relatively large area resistance of the separator, the contributions of the other components were c.a. 6–8 Ω cm2, bearing in mind that a relatively large gap (8–8.5 mm) was used to accommodate the two electrodes in the positive half-cell compartment. Further development of bifunctional oxygen catalysts43 can simplify the cell design and reduce the inter-electrode gaps.44 Some recent work also shows reasonable performance at low hydroxide concentrations (i.e. ≤1 M).43
In comparison, the internal resistance of the previous all-vanadium redox flow battery of Kazacos et al.45 was estimated to be 5.4 Ω cm2 using a concentrated acid (4H+) and carbon felt electrodes at 23 °C; the area resistance of Nafion® was estimated to be c.a. 1 Ω cm2.46Fig. 6b shows the half-cell electrode potentials and the resulting cell voltage vs. time profiles at 5, 7.5 and 10 mA cm−2. It can be seen that the average charge and discharge cell voltage ranges were 1.7–1.95 V and 0.4–0.7 V, respectively. Outside this current density range, the charge and discharge voltages are summarized in Fig. 6c. After charge, the open-circuit voltages were between 0.9 and 1.3 V. It is evident that the oxygen electrode potentials were relatively stable during the charge–discharge processes. Considering that both oxygen and hydroxide are abundant in atmospheric air and the electrolyte, the quinoxaline reaction appears to be the limiting reaction in the full battery.
Similar to the half-cell study in Fig. 3a, hydrogen evolution became significant after prolonged charge and led to lower coulombic efficiencies. For instance, the coulombic efficiency decreased to 68% at 10 mA cm−2. In relation to the low voltage efficiencies (<40%), the polarizations were mainly attributed to the overpotentials at the oxygen electrode reactions, as discussed earlier. However, further increases in these values at higher current densities were primarily influenced by ohmic drops in the battery components, particularly in the separators. In addition to minimizing the inter-electrode gap (e.g. the use of bifunctional oxygen catalysts), it is also important to minimize the internal resistance by using more conductive components and higher concentrations of hydroxide electrolytes, without significantly compromising the solubilities and increasing species crossover.
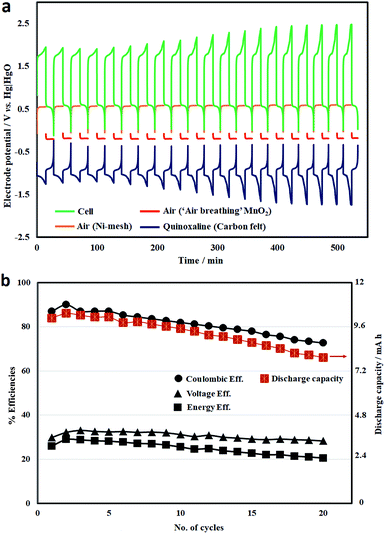
Under similar conditions, the cycling performance of the battery over 20 cycles (15 min charge, at 7.5 mA cm−2) is illustrated in Fig. 7a. The cell voltage profile was mainly influenced by the negative (quinoxaline) electrode overpotential, which increased with the cycle number, resulting in higher charge voltages (hence, lower voltage efficiencies). This can be attributed to hydrogen evolution (particularly at <−1.25 V vs. Hg|HgO) considering quinoxaline is the most negative redox reaction in aqueous electrolytes. In contrast, the oxygen evolution and reduction reactions remained relatively stable over these cycles.
The corresponding system efficiencies and discharge capacities are summarized in Fig. 7b. Both the coulombic efficiencies and discharge capacities decrease gradually during cycling as a result of several possible factors: (1) hydrogen evolution; (2) crossover between the two electrolyte compartments; and (3) the chemical stabilities of the active species. Over these 20 cycles, the average coulombic and energy efficiencies were calculated to be 81% and 25%, respectively. The resulting battery was still functioning but with energy efficiencies lower than 20% due to the deterioration in performance.
Conclusions
In summary, a proof-of-concept organic–air battery using low-cost materials has been evaluated from its fundamental chemistry to the lab-scale charge–discharge performance of a full-battery. Quinoxaline was selected as the negative redox species, with an electrode potential of up to c.a. −0.95 V vs. Hg|HgO. With the use of atmospheric air, the electrolyte cost of the proposed system is currently USD$ 32 per kW h, and could be lower than USD$ 20 per kW h in the medium to long term (achieving 0.7 V, USD$ 5 per kg, 32% theoretical capacity & full 2 electron-transfers) (ESI†).Due to the use of low-cost components, the cost of a module based on a Regenesys® design (USD$ 18![[thin space (1/6-em)]](https://www.rsc.org/images/entities/char_2009.gif) 000) was also estimated to be around half of that of a typical all-vanadium redox flow battery (USD$ 35
000) was also estimated to be around half of that of a typical all-vanadium redox flow battery (USD$ 35![[thin space (1/6-em)]](https://www.rsc.org/images/entities/char_2009.gif) 000) as shown in Fig. 8 (detailed calculations are available in the ESI†). Despite the relatively low current density (e.g., 7.5 mA cm−2), the charge and discharge cell voltages were c.a. 1.8 V and c.a. 0.5 V, respectively, which are comparable to the recently developed all-organic aqueous flow battery of Yang et al.8 (c.a. 0.5 V).
000) as shown in Fig. 8 (detailed calculations are available in the ESI†). Despite the relatively low current density (e.g., 7.5 mA cm−2), the charge and discharge cell voltages were c.a. 1.8 V and c.a. 0.5 V, respectively, which are comparable to the recently developed all-organic aqueous flow battery of Yang et al.8 (c.a. 0.5 V).
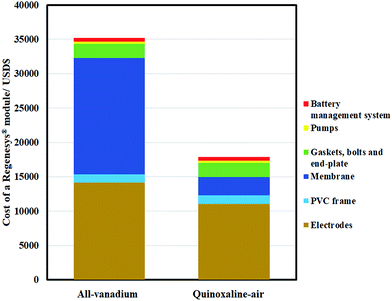 | ||
| Fig. 8 Estimated cost breakdown of Regenesys® module based on all-vanadium and the proposed quinoxaline-air chemistries. Detailed calculations are available in ESI.† | ||
The system we have developed combines attractive features of both organic flow and air-based batteries and opens up a new research direction. Further development could benefit from the recent advances in computational modelling and synthetic techniques for organic molecules to explore organic active species of high specific energies. A number of other challenges need to be addressed before scaling up for practical applications. For instance, the power density of the current system is still relatively low. To allow higher current densities, it is essential to reduce the overpotentials of the oxygen electrode reactions, minimize the internal resistance of the battery and effectively suppress side reactions at the negative electrodes, while improving the solubilities of the negative organic molecules by incorporating suitable functional groups, particularly at low hydroxide concentrations. Further improvements in other low-cost catalysts and cell architectures (e.g., bifunctional oxygen electrodes43) are needed as in previous systems.47–51
Conflicts of interest
There are no conflicts of interest to declare.References
- M. Skyllas-Kazacos, M. H. Chakrabarti, S. A. Hajimolana, F. S. Mjalli and M. Saleem, J. Electrochem. Soc., 2011, 158, R55 CrossRef.
- P. Leung, X. Li, C. Ponce de Leon, L. Berlouis, C. T. J. Low and F. C. Walsh, RSC Adv., 2012, 2, 10125 RSC.
- J. Noack, N. Roznyatovskaya, T. Herr and P. Fischer, Angew. Chem., Int. Ed., 2015, 54, 9776 CrossRef PubMed.
- P. Leung, T. Martin, A. Shah, M. R. Mohamed, M. A. Anderson and J. Palma, J. Power Sources, 2017, 341, 36 CrossRef.
- Grid Energy Storage, U.S. Department of Energy, 2013. http://energy.gov/oe/downloads/grid-energy-storage-december-2013, accessed on 15th April, 2018.
- B. Huskinson, M. P. Marshak, C. W. Suh, S. Er, M. R. Gerhardt, C. J. Galvin, X. D. Chen, A. Aspuru-Guzik, R. G. Gordon and M. J. Aziz, Nature, 2014, 505, 195 CrossRef PubMed.
- K. Lin, Q. Chen, M. R. Gerhardt, L. Tong, S. B. Kim, L. Eisenach, A. W. Valle, D. Hardee, R. G. Gordon, M. J. Aziz and M. P. Marshak, Science, 2015, 349, 1529 CrossRef PubMed.
- B. Yang, L. Hoober-Burkhardt, F. Wang, G. K. Surya Prakash and S. R. Narayanan, J. Electrochem. Soc., 2014, 161, A1371 CrossRef.
- K. Lin, R. Gomez-Bombarelli, E. S. Beh, L. Tong, Q. Chen, A. Valle, A. Aspuru-Guzik, M. J. Aziz and R. G. Gordon, Nat. Energy, 2016, 1, 16102 CrossRef.
- C. DeBruler, B. Hu, J. Moss, X. Liu, J. Luo, Y. Sun and T. L. Liu, Chem, 2017, 3, 1 Search PubMed.
- J. Luo, B. Hu, C. DeBruler and T. L. Liu, Angew. Chem., Int. Ed., 2018, 57, 231–235 CrossRef PubMed.
- P. Leung, T. Martin, M. Liras, A. M. Berenguer, R. Marcilla, A. A. Shah, L. An, M. Anderson and J. Palma, Appl. Energy, 2017, 197, 318 CrossRef.
- P. Leung, A. A. Shah, L. Sanz, C. Flox, J. R. Morante, Q. Xu, M. R. Mohamed, C. Ponce de Leon and F. C. Walsh, J. Power Sources, 2017, 360, 243 CrossRef.
- X. Wei, W. Pan, W. Duan, A. Hollas, Z. Yang, B. Li, Z. Nie, J. Liu, D. Reed, W. Wang and V. Sprenkle, ACS Energy Lett., 2017, 2, 2187 CrossRef.
- Y. Ding, C. Zhang, L. Zhang, Y. Zhou and G. Yu, Chem. Soc. Rev., 2018, 47, 69 RSC.
- J. A. Kowalski, L. Su, J. D. Milshtein and F. R. Brushett, Curr. Opin. Chem. Eng., 2016, 13, 45 CrossRef.
- R. Dmello, J. D. Milshtein, F. R. Brushett and K. C. Smith, J. Power Sources, 2016, 330, 261 CrossRef.
- R. M. Darling, K. G. Gallagher, J. A. Kowalski, S. Ha and F. R. Brushett, Energy Environ. Sci., 2014, 7, 73459 RSC.
- Y. Li and H. Dai, Chem. Soc. Rev., 2014, 43, 5257 RSC.
- A. Khor, P. Leung, M. R. Mohamed, C. Flox, Q. Xu, L. An, R. Wills, J. R. Morante and A. Shah, Materials Today Energy, 2018, 8, 80 CrossRef.
- Z. Li, M. S. Pan, L. Su, P.-C. Tsai, A. F. Badel, J. M. Valle, S. L. Eiler, K. Xiang, F. R. Brushett and Y.-M. Chiang, Joule, 2017, 1, 306 CrossRef.
- J. B. Goodenogu and P. Singh, J. Electrochem. Soc., 2015, 162, A2387 CrossRef.
- J. D. Milshtein, L. Su, C. Liou, A. F. Badel and F. R. Brushett, Electrochim. Acta, 2015, 180, 695 CrossRef.
- F. R. Brushette, J. T. Vaughey and A. N. Jansen, Adv. Energy Mater., 2012, 2, 1390–1396 CrossRef.
- F. R. Brushett, A. N. Jansen, J. T. Vaughey, L. Su and J. D. Milshtein, Materials for use with aqueous redox flow batteries and related methods and systems, US Pat. 2015/0236543 A1, 20 Aug 2015.
- X. L. Zhou, T. S. Zhao, L. An, L. Wei and C. Zhang, Electrochim. Acta, 2015, 153, 492 CrossRef.
- Z. Yuan, Y. Duan, H. Zhang, X. Li, H. Zhang and I. Vankelecom, Energy Environ. Sci., 2016, 9, 441 RSC.
- K. Schmidt-Rohr and Q. Chen, Nat. Mater., 2008, 7, 75–83 CrossRef PubMed.
- D. Aili, A. G. Wright, M. R. Kraglund, K. Jankova, S. Holdcroft and J. O. Jensen, J. Mater. Chem. A, 2017, 5, 5055 RSC.
- D. Aili, M. K. Hansen, J. W. Andreasen, J. Zhang, J. O. Jensen, N. J. Bjerrum and Q. Li, J. Membr. Sci., 2015, 493, 589 CrossRef.
- K. Gong, Q. Fang, S. Gu, S. F. Y. Li and Y. Yan, Energy Environ. Sci., 2015, 8, 3515 RSC.
- X. Li, F. C. Walsh and D. Pletcher, Phys. Chem. Chem. Phys., 2011, 13, 1162 RSC.
- C. N. Chervin, J. W. Long, N. L. Brandell, J. M. Wallace, N. W. Kucko and D. R. Rolison, J. Power Sources, 2012, 207, 191 CrossRef.
- Y. L. Cao, H. X. Yang, X. P. Ai and L. F. Xiao, J. Electroanal. Chem., 2003, 557, 127 CrossRef.
- W. G. Cook and R. P. Olive, Corros. Sci., 2012, 58, 284–290 CrossRef.
- L.-A. Stern and X. Hu, Faraday Discuss., 2014, 176, 363–379 RSC.
- P. Gu, M. Zheng, Q. Zhao, X. Xiao, H. Xue and H. Pang, J. Mater. Chem. A, 2017, 5, 7651–7666 RSC.
- Electric Fuels, https://electric-fuel.com/accessed on 15th April, 2018.
- E. V. Carino, C. E. Diesendruck, J. S. Moore, L. A. Curtiss, R. S. Assary and F. R. Brushett, RSC Adv., 2015, 5, 18822 RSC.
- J.-K. Jang, T.-H. Kim, S. J. Yoon, J. Y. Lee, J.-C. Lee and Y. T. Hong, J. Mater. Chem. A, 2016, 4, 13424 Search PubMed.
- S. Er, C. Suh, M. P. Marshak and A. Aspuru-Guzik, Chem. Sci., 2015, 6, 885–893 RSC.
- X. Zhang, L. Huang, Y. Han, M. Xu and S. Dong, Nanoscale, 2017, 9, 5583–5588 RSC.
- Y. Cheng, D. Li, L. Shi and Z. Xiang, Nano Energy, 2018, 47, 361–367 CrossRef.
- Q. Xu, Y. N. Ji, L. Y. Qin, P. K. Leung, F. Qiao, Y. S. Li and H. N. Su, J. Energy Storage, 2018, 16, 108 CrossRef.
- M. Kazacos and M. Skyllas-Kazacos, J. Electrochem. Soc., 1989, 136, 2759 CrossRef.
- P. K. Leung, Q. Xu, T. S. Zhao, L. Zeng and C. Zhang, Electrochim. Acta, 2013, 105, 584 CrossRef.
- L. Wei, T. S. Zhao, G. Zhao, L. An and L. Zeng, Appl. Energy, 2016, 176, 74–79 CrossRef.
- L. Wei, T. S. Zhao, L. Zeng, Y. K. Zeng and H. R. Jiang, J. Power Sources, 2017, 341, 318–326 CrossRef.
- Y. Zhou, L. Liu, Y. Shen, L. Wu, L. Yu, F. Liang and J. Xi, Chem. Commun., 2017, 53, 7565–7568 RSC.
- H. Zhou, J. Xi, Z. Li, Z. Zhang, L. Yu, L. Liu, X. Qiu and L. Chen, RSC Adv., 2014, 4, 61912–61918 RSC.
- H. Jiang, W. Shyy, L. Zeng, R. Zhang and T. S. Zhao, J. Mater. Chem. A, 2018, 6, 13244–13253 RSC.
Footnote |
| † Electronic supplementary information (ESI) available. See DOI: 10.1039/c8se00205c |
| This journal is © The Royal Society of Chemistry 2018 |

