Oxidative chemical vapour deposition of a graphene oxide carbocatalyst on 3D nickel foam as a collaborative electrocatalyst towards the hydrogen evolution reaction in acidic electrolyte†
Sangchai
Sarawutanukul
,
Nutthaphon
Phattharasupakun
,
Juthaporn
Wutthiprom
and
Montree
Sawangphruk
 *
*
Department of Chemical and Biomolecular Engineering, School of Energy Science and Engineering, Vidyasirimedhi Institute of Science, and Technology, Rayong 21210, Thailand. E-mail: montree.s@vistec.ac.th
First published on 12th April 2018
Abstract
In this study, a graphene oxide (GO) carbocatalyst was synthesized as a thin film on a 3D Ni foam substrate (GO@Ni) by oxidative chemical vapour deposition (CVD) using methanol and water as precursors. The GO@Ni was used as a collaborative electrocatalyst towards the hydrogen evolution reaction (HER) in an acidic electrolyte. Notably, pure Ni metal cannot be used as an electrocatalyst in acidic media due to corrosion. The amount of water in the methanol was finely tuned to optimize the electrochemical activity of the GO@Ni for HER. The optimized GO@Ni catalyst, with a sheet resistivity of 133.48 Ω square−1, an optical band gap of 1.52 eV, and a C![[thin space (1/6-em)]](https://www.rsc.org/images/entities/char_2009.gif) :
:![[thin space (1/6-em)]](https://www.rsc.org/images/entities/char_2009.gif) O ratio of 3.89 produced using 90
O ratio of 3.89 produced using 90![[thin space (1/6-em)]](https://www.rsc.org/images/entities/char_2009.gif) :
:![[thin space (1/6-em)]](https://www.rsc.org/images/entities/char_2009.gif) 10 V% of methanol
10 V% of methanol![[thin space (1/6-em)]](https://www.rsc.org/images/entities/char_2009.gif) :
:![[thin space (1/6-em)]](https://www.rsc.org/images/entities/char_2009.gif) water, exhibits excellent and stable HER activity with an overpotential of 137 mV vs. RHE, reaching a high current density of 10 mA cm−2 and prominent electrochemical stability for up to 12 h in 0.5 M H2SO4. In addition, the CVD GO layer on the Ni foam acts as an anti-corrosion material protecting the Ni HER catalyst in the acidic environment. As a result, the GO@Ni may be a promising electrode for HER, replacing expensive Pt catalysts.
water, exhibits excellent and stable HER activity with an overpotential of 137 mV vs. RHE, reaching a high current density of 10 mA cm−2 and prominent electrochemical stability for up to 12 h in 0.5 M H2SO4. In addition, the CVD GO layer on the Ni foam acts as an anti-corrosion material protecting the Ni HER catalyst in the acidic environment. As a result, the GO@Ni may be a promising electrode for HER, replacing expensive Pt catalysts.
Introduction
The over-consumption of fossil fuels and its detrimental effects on the environment are a serious global concern that has led researchers to seek renewable and clean energy.1,2 Hydrogen fuel is considered to be one of the most promising alternative energies because its combustion does not release any harmful gases. It can be produced sustainably from an abundant water supply.3 The electrocatalytic hydrogen evolution reaction (HER) is a simple route to generate high-purity hydrogen from water, preferably driven by free solar energy,4 following 2H2O → H2 + O2 (E0 = −1.23 V vs. RHE). Recently, it has been shown that HER needs an advanced catalyst in order to reduce the overpotential and consequently increase the efficiency of this electrochemical process.5–8 Additionally, to improve the electrocatalytic efficiency of hydrogen production, acidic electrolytes have been introduced to increase the H+ supply in solution.9,10 Although outstanding HER performance in acidic systems has been achieved using noble metals, such as Pt, their scarceness and high cost have limited its utilization in commercial applications, which has highly motivated researchers to design acid-stable and non-noble catalysts for HER.11Nickel-based (Ni-based) electrocatalysts have received great attention in industrial scale hydrogen production, owing to their cost-efficiency and stability in alkaline electrolytes.12 However, Ni catalysts cannot be sustained in an acidic solution because of their chemical instability (corrosion).13 A typical method to prevent the corrosion problem is the fabrication of a thin layer coating of carbon on the metal surface. In addition, several carbon-based materials have also been recently used as electrocatalysts for HER due to their tuneable molecular structures, low cost, natural abundance, and good stability under acid/alkaline environments.14,15 Among carbon-based materials, graphene, a two-dimensional sp2-hybridized carbon nanosheet, exhibits many unique properties, such as a high specific surface area, high mobility of charge carriers, and high stability.16 Ultrathin graphene layers not only improve the anti-corrosion properties of metals, but also promote catalytic reactions by interfacial charge transfer.17 However, pristine graphene sheets are hydrophobic in nature and are therefore unsuitable for use as electrocatalysts in the HER. On the other hand, graphene oxide (GO) is hydrophilic and well known as a carbocatalyst that exhibits a remarkable electrocatalytic activity for water splitting.18 The oxygen-containing functional groups of GO can act as an alternative path for H2 production through the recombination of the spilled Hads from Ni to graphene.19 As a result, in this work, we introduced a new process called “oxidative chemical vapour deposition (CVD) of GO on a Ni foam substrate”, producing a high-efficiency collaborative electrocatalyst, namely GO@Ni, for HER. In this CVD process, methanol diluted with water was used for the first time as the GO precursor. The water content was also finely tuned. The optimized GO@Ni catalyst, produced using 90![[thin space (1/6-em)]](https://www.rsc.org/images/entities/char_2009.gif) :
:![[thin space (1/6-em)]](https://www.rsc.org/images/entities/char_2009.gif) 10 V% methanol
10 V% methanol![[thin space (1/6-em)]](https://www.rsc.org/images/entities/char_2009.gif) :
:![[thin space (1/6-em)]](https://www.rsc.org/images/entities/char_2009.gif) water, exhibits excellent and stable HER activity with an overpotential of 137 mV (vs. RHE), reaching a high current density of 10 mA cm−2 and excellent electrochemical stability for up to 12 h in 0.5 M H2SO4.
water, exhibits excellent and stable HER activity with an overpotential of 137 mV (vs. RHE), reaching a high current density of 10 mA cm−2 and excellent electrochemical stability for up to 12 h in 0.5 M H2SO4.
Experimental section
Oxidative CVD of GO on Ni foam
A piece of 3D nickel foam (Ni foam, 3 × 5 cm2 with a thickness of 1 mm, Gelon) was treated in 1.0 M acetic acid (99.7%, RCI Labscan) under sonication for 10 min to remove the impurities, e.g. oxide compounds and oily contaminants on its surface. It was then washed with acetone and deionized water (purified using Milli-Q system, 15 MΩ cm, Millipore) several times. Finally, the washed Ni foam was immersed in methanol (which acts as a carbon source for the CVD process) for 10 min, and then it was dried under an argon atmosphere.The configuration of the CVD process is illustrated in Fig. 1. The inlet gas was split into 2 paths. The first line (W1 line) was used to anneal the sample during the heating and cooling down of the CVD system. The second line (W2 line) was used to supply gas for the GO growth reaction. Firstly, the treated Ni foam was put in an alumina boat and transferred to the quartz tube furnace under an argon environment with a constant gas flow rate of 100 sccm. Subsequently, the sample was heated from room temperature (25 °C) to 1000 °C, with a heating rate of 10 °C min−1, and held for 50 min to anneal the surface of the treated Ni foam. After that, for 10 min, argon gas was flowed through a 250 ml container of methanol with water at different volume ratios in order to produce the precursor vapour for the GO growth reaction. The sample was then cooled down to ambient temperature under an argon atmosphere. To investigate the effect of the water content in the methanol source on the CVD process, different amounts of DI water were mixed with the methanol with % V/V of 0, 0.1, 1, 5, 10, 25, and 50. The obtained products were labelled as G, G-1, G-2, G-3, G-4, G-5, and G-6, respectively.
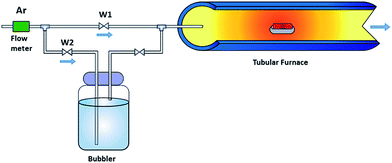 | ||
| Fig. 1 Schematic diagram of the oxidative chemical vapour deposition (CVD) setup for GO growth using methanol with water as the GO precursor. | ||
Characterization
The morphologies of the as-prepared samples were characterized by Field-Emission Scanning Electron Microscopy (FESEM, JSM-7001F, JEOL Ltd.). The surface morphology was investigated by an Atomic Force Microscope (AFM, Park, NX10, Korea). The crystallographic structure was recorded by X-ray diffraction (XRD, PHILIPS, X’Pert-MPD 40 kV 35 mA, Cu Kα 1.54056 Å) with a 2θ range between 10–80°. The graphitic structure was analysed by Raman microscopy (SENTERRA, Bruker). The functional groups and elemental compositions of the as-synthesized materials were determined by Fourier Transform Infrared Spectrometry (FTIR, Frontier FT-IR, PerkinElmer) and X-ray photoelectron spectroscopy using an AXIS Ultra DLD (XPS, Kratos Analytical Ltd., Manchester, UK) with Al-K alpha radiation (hυ = 14.866 eV). The optical properties were studied by UV-vis spectroscopy (UV/vis/NIR Lambda 1050, PerkinElmer, USA). The resistivity of all the samples was also investigated by 4-point probe equipment (JANDEL, Model RM3000+, UK).Electrochemical evaluation
Electrochemical measurement was performed with an electrochemical workstation using an AUTOLAB potentiostat (PGSTAT302N) with a standard three-electrode system in 0.5 M H2SO4 aqueous solution using Ni foam, the G, G-1, G-2, G-3, G-4, G-5, and G-6 electrodes with a geometric area of 1 × 1 cm2 as the working electrode, a graphite rod as the counter electrode, and Ag/AgCl (sat. KCl) as the reference electrode. The HER activity of the electrodes was determined by linear sweep voltammetry (LSV) by sweeping the potential from 0 to −1 V (vs. RHE) at a scan rate of 10 mV s−1. The potentials were calibrated to the reversible hydrogen electrode (RHE) potential using the following equation: E(RHE) = E(Ag/AgCl) + 0.059 pH + 0.1976 V.Results and discussion
Physicochemical characterizations
Fig. 2a shows the FESEM images of the 3D cross-link network structure of the bare Ni foam, for which submillimetre pores can be clearly seen. The Ni grain boundaries are observed at high magnification (inset image of Fig. 2a). Following the CVD process using pure methanol as the carbon source (Fig. 2b), it can be obviously seen that graphene layers completely cover the Ni foam and the graphene wrinkles are clearly identified. For the oxidative CVD process, Fig. 2c–h indicate the thin layers of the GO films with some gain boundaries and the formation of wrinkles on the Ni substrate,20 similar to the FESEM image of graphene in Fig. 2b. However, the cracking GO layers can be observed when increasing the water content due to the dissociation of water into hydrogen and oxygen on the defective sites of the GO layers.21 In addition, the size of the carbon islands decrease with an overabundant water content, as shown in Fig. 2h.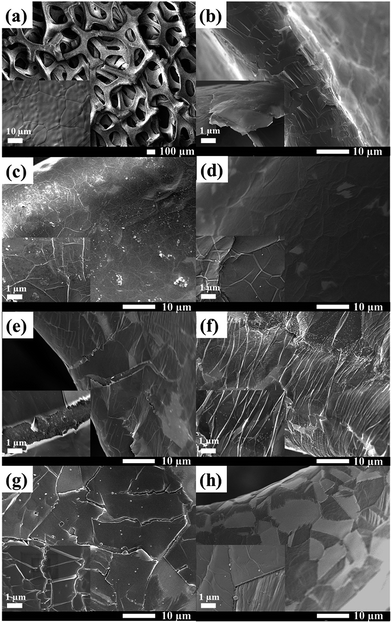 | ||
| Fig. 2 FESEM images of (a) bare Ni foam, (b) G, (c) G-1, (d) G-2, (e) G-3, (f) G-4, (g) G-5, and (f) G-6. | ||
The elemental compositions of the Ni foam and G-4 were studied by EDS mapping, showing the uniform and continuous dispersion of C and O throughout the Ni foam network after the CVD process, indicating that graphene and GO films were entirely formed on the Ni substrates, as shown in Fig. 3a–f. The AFM image of G-4 (Fig. 3g) shows that its surface is quite smooth, with a few nanometres in thickness on the surface corresponding to a few layers of graphene. In addition, a four-point probe technique was used to measure the sheet resistivity (Rs) of each sample. The measurement was carried out 3 times at a current of 1 μA to get average values. The resistances of G, G-1, G-2, G-3, G-4, G-5, and G-6 are 126.36, 126.59, 127.18, 133.48, 136.25, 137.92, and 140.77 Ω square−1, respectively. The obvious trend of increasing Rs with increasing water content in the oxidative CVD process can be observed as shown in Fig. 3h. This is due to the increasing oxygen-containing content in the GO samples.
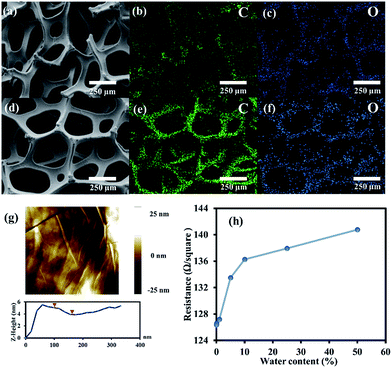 | ||
| Fig. 3 EDS mapping of (a–c) Ni foam and (d–f) G-4, (g) AFM image of G-4 surface, and (h) the sheet resistances of the as-prepared samples. | ||
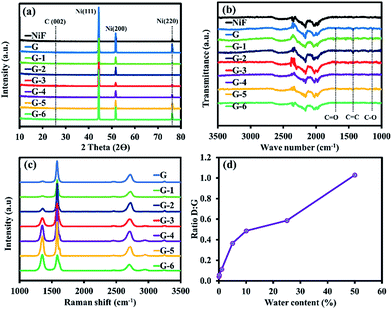
Fig. 4a shows the XRD patterns of the as-prepared materials exhibiting dominant diffraction peaks around 44.4, 51.9, and 76.3°, corresponding to the (111), (200), and (220) Ni crystallographic planes. The orderly and grain-boundary-free surface of Ni (111) provides a smooth surface for uniform graphene and GO formation. In contrast, the rough surface of polycrystalline Ni (200) with its abundant grain boundaries facilitates the formation of multilayer graphene.22 The extremely weak intensity peak of C (002) confirms that the ultrathin graphene and GO sheets were formed on the surface of the Ni foam. The FTIR spectra in Fig. 4b present a broad peak at 1350–1600 cm−1, due to the stretching vibration mode of sp2 carbon (C![[double bond, length as m-dash]](https://www.rsc.org/images/entities/char_e001.gif) C), and the peak at 1200–1250 cm−1, owing to the stretching vibration of alcohol (C–O). In addition, the peak at 1720–1740 cm−1 can be assigned to the C
C), and the peak at 1200–1250 cm−1, owing to the stretching vibration of alcohol (C–O). In addition, the peak at 1720–1740 cm−1 can be assigned to the C![[double bond, length as m-dash]](https://www.rsc.org/images/entities/char_e001.gif) O stretching vibration of the carboxyl groups.23 As a result, it can be concluded that the oxygen functional groups were successfully generated at the defect sites of the graphene sheets. Fig. 4c shows the Raman spectra of GO growth with G to G-6 conditions.
O stretching vibration of the carboxyl groups.23 As a result, it can be concluded that the oxygen functional groups were successfully generated at the defect sites of the graphene sheets. Fig. 4c shows the Raman spectra of GO growth with G to G-6 conditions.
The Raman spectra exhibit the characteristic peaks of a carbon-based material, but the Ni foam peak does not appear, indicating that the graphene sheets entirely covered the surface of the Ni foam substrate.24 The defect density is indicated by a D band (disordered) at 1350 cm−1 from the vibration mode of sp3 carbon atoms chemically bonded to oxygen-containing groups and carbon on the edge of the graphitic sheets.25 Meanwhile, the G band at 1580 cm−1 represents the vibration of sp2 graphitic carbon. The intensity ratios of the D to G band (ID/IG) of the G to G-6 samples are 0.042, 0.057, 0.1125, 0.3656, 0.4867, 0.5873, and 1.0301, respectively, as shown in Fig. 4d. The increased ID/IG represents a higher number of defects in the carbon basal planes when the water content in the carbon source (methanol) is increased. In addition, the theoretically calculated grain sizes relating to ID/IG (ref. 26) for the G to G-6 samples are 456.4, 333.9, 170.9, 52.6, 39.5, 32.7, and 18.7 nm, respectively.
Fig. 5a shows the absorbance spectra for GO with an absorption in the visible to near-IR light region. The theoretical band structure analysis shows that the optical band gap of GO is changed as a function of the increasing oxidation level.27 This is related to the change of the highest valence band state from the bonding π orbital to the oxygen 2p orbital.28 To determine the band gap energy for the direct band gap transition, the relation of the square root of the absorption energy against the photon energy was plotted. From the approximated linear extrapolation of the G to G-6 samples, Fig. 6b shows band gap energies of 1.37, 1.43, 1.48, 1.49, 1.52, 1.48, and 1.48 eV, respectively. The GO@Ni samples show narrow band gap energies, which are the intermediate states between fully oxidized GO, which has a large band gap energy of 2.4–4 eV (ref. 28), and pristine graphene, which has zero band gap energy.29 Therefore, the oxidation level of the GO samples can be adjusted to have the proper electronic properties for HER.
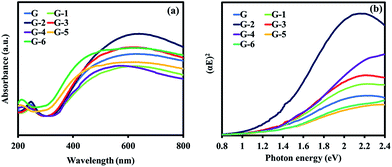 | ||
| Fig. 5 (a) Optical absorption spectra of the GO@Ni samples (G to G-6) and (b) Tau plots of (αE)2 against the photon energy. | ||
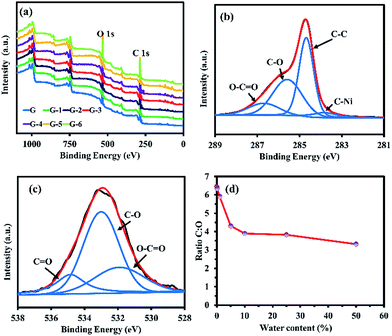 | ||
Fig. 6 (a) XPS wide scan spectra, (b) narrow XPS scan of C 1s, (c) narrow XPS scan of O 1s of G-4, and (d) C![[thin space (1/6-em)]](https://www.rsc.org/images/entities/char_2009.gif) : :![[thin space (1/6-em)]](https://www.rsc.org/images/entities/char_2009.gif) O ratio of GO@Ni. O ratio of GO@Ni. | ||
The surface compositions of the GO@Ni samples were investigated by XPS. Wide scan XPS spectra (Fig. 6a) show the expected photoelectron peaks of Ni, C, and O in the GO@Ni samples. The narrow scan of the C 1s of G-4 (Fig. 6b) presents typical GO characteristic peaks consisting of four deconvoluted peaks at 283.8, 284.7, 285.6, and 286.7 eV, attributed to C–Ni (5.92%), C–C (43.63%), C–O (37.25%), and epoxide (C![[double bond, length as m-dash]](https://www.rsc.org/images/entities/char_e001.gif) O, 13.20%) groups,30 respectively. The appearance of oxygen species can be clearly observed, owing to the oxygen-containing groups being chemically bonded to the graphene nanosheets. Fig. 6c shows the O 1s spectra of G-4 corresponding to the peaks of O–C
O, 13.20%) groups,30 respectively. The appearance of oxygen species can be clearly observed, owing to the oxygen-containing groups being chemically bonded to the graphene nanosheets. Fig. 6c shows the O 1s spectra of G-4 corresponding to the peaks of O–C![[double bond, length as m-dash]](https://www.rsc.org/images/entities/char_e001.gif) O (531.41 eV, 25.68%), C
O (531.41 eV, 25.68%), C![[double bond, length as m-dash]](https://www.rsc.org/images/entities/char_e001.gif) O (532.49 eV, 58.33%), and C–O (534.33 eV, 15.97%).23 The C
O (532.49 eV, 58.33%), and C–O (534.33 eV, 15.97%).23 The C![[thin space (1/6-em)]](https://www.rsc.org/images/entities/char_2009.gif) :
:![[thin space (1/6-em)]](https://www.rsc.org/images/entities/char_2009.gif) O ratios of the G to G-6 samples are 6.45, 6.34, 5.91, 4.31, 3.89, 3.82, and 3.31, respectively (Fig. 6d), in agreement with FTIR, Raman, sheet resistance, and optical absorption results. As a result, it can be concluded that the oxidative CVD in this work can provide GO films with finely tuned oxygen content and functional groups on the Ni foam HER electrocatalyst. The oxygen functional groups, including hydroxyl and carbonyl groups on the Ni foam, can assist the H spillover from its surface. In other words, they act as an acceptor of H atoms. These phenomena will facilitate the formation of free active sites on the Ni phase, which is necessary for the HER to proceed. Also, they can act as an additional path for H2 production via the recombination of the spilled Hads from the Ni foam with GO. This action is enabled by the unique reactivity of the oxygen groups of GO.19 Thus, efficient HER activity can be expected due to the oxygen incorporation on the collaborative GO@Ni electrocatalyst with several disorder structures.
O ratios of the G to G-6 samples are 6.45, 6.34, 5.91, 4.31, 3.89, 3.82, and 3.31, respectively (Fig. 6d), in agreement with FTIR, Raman, sheet resistance, and optical absorption results. As a result, it can be concluded that the oxidative CVD in this work can provide GO films with finely tuned oxygen content and functional groups on the Ni foam HER electrocatalyst. The oxygen functional groups, including hydroxyl and carbonyl groups on the Ni foam, can assist the H spillover from its surface. In other words, they act as an acceptor of H atoms. These phenomena will facilitate the formation of free active sites on the Ni phase, which is necessary for the HER to proceed. Also, they can act as an additional path for H2 production via the recombination of the spilled Hads from the Ni foam with GO. This action is enabled by the unique reactivity of the oxygen groups of GO.19 Thus, efficient HER activity can be expected due to the oxygen incorporation on the collaborative GO@Ni electrocatalyst with several disorder structures.
Electrochemical evaluation
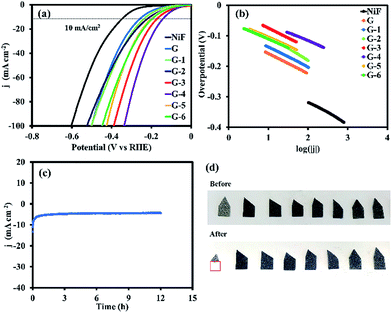
The electrocatalytic activity of the GO@Ni foams and the bare 3D Ni foam electrode towards the HER was investigated in 0.5 M H2SO4 solution at room temperature using a three-electrode setup via LSV and CV techniques. Fig. 7a shows the polarization curves (i–V plots) as recorded for an individual electrode. For the bare Ni foam catalyst, it needs an overpotential (η) of 335.7 mV (vs. RHE) to deliver a current density of 10 mA cm−2. Although the bare Ni foam is widely considered to be an electroactive catalyst toward HER, graphene on Ni foam (G sample) with sp2-hybridization in this work exhibits superior electron transfer and its large specific surface area can reduce η from 335.7 mV to 247.0 mV. Furthermore, the GO catalysts (G-1 to G-6) possess impressive η values of 225.7, 207.5, 160.5, 137.0, 186.2, and 191.5 mV (vs. RHE), respectively, which are much lower than that of the bare 3D Ni foam due to the electrocatalytic activity of GO. Among all the samples, G-4 exhibits the lowest η value, suggesting superior HER activity. The attractive HER performance of the G-4 catalyst can be favourably compared to most of the previous electrocatalysts previously reported, such as 3D Ni HER electrodes in acidic electrolyte (0.5 M H2SO4) (10 mA cm−2 at 210 mV, 100.6 mV dec−1),31 MoSx grown on graphene-protected 3D Ni foam (10 mA cm−1 at 151 mV, 42 mV dec−1),13 Mo2C nanoparticles on an RGO hybrid (10 mA cm−2 at 130 mV, 57.3 mV dec−1),32 WS2 nanolayer heteroatom-doped graphene films (10 mA cm−2 at 125 mV),33 and CoSe2 nanoparticles grown on carbon fibre paper (10 mA cm−2 at 137 mV),34 as listed in Table S1.†Furthermore, the linear portions of the polarization curves were fitted to the Tafel equation (eqn (1)). The Tafel equation can be used to describe the current–potential relationship at significant η:
η = b![[thin space (1/6-em)]](https://www.rsc.org/images/entities/char_2009.gif) log log![[thin space (1/6-em)]](https://www.rsc.org/images/entities/char_2009.gif) j + a j + a | (1) |
Discharge reaction (Volmer reaction):
| H3O+ + e− + cat → cat-H + H2O | (2) |
Combination reaction (Tafel reaction):
| cat-H + cat-H → 2cat + H2 | (3) |
Ion + atom reaction (Heyrovsky reaction):
| H3O+ + e− + cat-H →cat + H2 + H2O | (4) |
According to previous reports, a Tafel slope of 30 mV dec−1 in a low overpotential range indicates that the mechanism proceeds through the Volmer–Tafel mechanism and the recombination step is a rate-limiting step.35 Meanwhile, a Tafel slope of 40 mV dec−1 suggests that H2 is produced via the Volmer–Heyrovsky mechanism and the electrochemical desorption step is a rate-limiting step.36 In addition, a Tafel slope of 120 mV dec−1 may arise from various reaction pathways depending on the surface coverage of adsorbed H2.35 The measured values from the Tafel slopes using the GO@Ni foams and the bare Ni foam are listed in Table 1.
| Electrode | Required overpotential (mV, at 10 mV cm−2) | Tafel slope (mV dec−1) | Exchange current density (jo, A cm−2) |
|---|---|---|---|
| Ni foam | 335.7 | 73.0 | 4.75 × 10⁻⁶ |
| G | 247.0 | 65.7 | 3.95 × 10⁻⁵ |
| G-1 | 225.7 | 65.4 | 8.30 × 10⁻⁵ |
| G-2 | 207.5 | 64.8 | 5.51 × 10⁻⁴ |
| G-3 | 160.5 | 64.5 | 6.95 × 10⁻⁴ |
| G-4 | 137.0 | 54.4 | 7.38 × 10⁻⁴ |
| G-5 | 186.2 | 56.9 | 1.46 × 10⁻⁴ |
| G-6 | 191.5 | 56.4 | 1.09 × 10⁻⁴ |
The GO (G-4) not only exhibits a superior HER activity in terms of the lowest η, but also shows a low Tafel slope of 54.4 mV dec−1, suggesting that the Volmer–Heyrovsky reaction is the rate-limiting step of the electrode. In addition, the GO can also generate a second pathway in which electrons can transfer along the layer and will be trapped by defect carbons that serve as alternative active sites for hydrogen evolution, as shown in the following reactions ((5)–(7)).37
| H3O+ + e− + C(defect) → C(defect)–H + H2O | (5) |
| C(defect)–H + Ni(cat) → Ni(cat)–H + C(defect) | (6) |
| Ni(cat)–H + Ni(cat)–H → 2Ni(cat) + H2 | (7) |
Firstly, the reactant H3O+ molecules permeate through the GO layer, reaching the active sites via the defects or edges of GO (see reaction (5)). The formation of C–H bonding at the defect carbons will transform the H3O+ molecules into H atoms coupled with Ni metal (see reaction (6)).38 However, the C–H bond energy of pristine GO is quite weak (0.82 eV),39 causing the unstable adsorption of the H atoms. After coupling with the Ni metal, the C–H bond energy can be increased (0.96–1.15 eV),39 making the H atoms become more stable, upon which a large amount of them can adsorb on the GO surface that covers the Ni. The chemisorbed H atoms on the defect carbons with very low activation energy40 can move along the GO layer to the surface of the Ni substrate, recombining with other H atoms to form H2, which will then be easily desorbed from the Ni surface (see reaction (7)). As a result, both the GO (defect carbons) and Ni metal synergistically promote HER. Additionally, the exchange current density (jo) can be used to evaluate the activity of the catalysts toward the HER in water electrolysis.19 The obtained values in Table 1 show that G-4 has an exchange current density 18.7 times higher than that of non-oxidative graphene (G) and 155.4 times higher than that of the bare Ni foam. These results demonstrate the dramatic effect of GO in enhancing the activity of the Ni foam. It also suggests that the supported GO@Ni foam can substantially increase the catalyst conductivity and the oxygen-containing groups can provide sufficient active sites for the electrolyte reactivity. To evaluate the stability of the G-4 catalyst, the electrode was tested under a static overpotential of −0.45 V vs. Ag/AgCl (−0.21 V vs. RHE) in 0.5 M H2SO4, as shown in Fig. 7c. Its cathodic current density still remains after 12 h operation, indicating that the GO@Ni foam electrode exhibits high stability during electrocatalytic hydrogen production, even in corrosive acidic solution. Digital photographs of the bare Ni foam and GO@Ni electrodes before and after HER testing (Fig. 7d) indicate that the GO coating can strongly enhance anti-corrosion in acidic solution, while 72.98% wt. of the bare Ni foam catalyst was reduced after the HER testing. On the other hand, the slight decrease in the mass of the GO@Ni samples was also observed due to H2 gas bubbling during the HER process, causing the removal of small amounts of GO on the Ni foam surface.
Conclusions
In summary, GO films supported on Ni foam catalysts were successfully produced by oxidative CVD using methanol and water as precursors. The oxygen-containing groups and contents of the GO@Ni samples were finely tuned by adjusting the water content in the methanol precursor for HER. The oxygen-functional groups of GO can significantly reduce the overpotential and Tafel slope of the Ni catalyst, since GO itself has an electrocatalytic activity toward HER, leading to a synergetic catalytic activity. Additionally, under the optimum conditions of the GO@Ni catalyst (G-4), with a sheet resistivity of 133.48 Ω square−1, an optical band gap of 1.52 eV, and a C![[thin space (1/6-em)]](https://www.rsc.org/images/entities/char_2009.gif) :
:![[thin space (1/6-em)]](https://www.rsc.org/images/entities/char_2009.gif) O ratio of 3.89 produced using 90
O ratio of 3.89 produced using 90![[thin space (1/6-em)]](https://www.rsc.org/images/entities/char_2009.gif) :
:![[thin space (1/6-em)]](https://www.rsc.org/images/entities/char_2009.gif) 10 V% methanol
10 V% methanol![[thin space (1/6-em)]](https://www.rsc.org/images/entities/char_2009.gif) :
:![[thin space (1/6-em)]](https://www.rsc.org/images/entities/char_2009.gif) water, it exhibits a superior catalytic activity towards HER with a low onset overpotential of 137.0 mV and a low Tafel slope of 54.4 mV dec−1, as well as long-term stability (up to 12 h). Hence, this new approach of synthesizing oxidative CVD GO on 3D Ni foam can enhance the Ni electrocatalyst and its stability in an acidic electrolyte. This collaborative GO@Ni electrocatalyst, which is a good candidate to replace Pt, may lead to the practical production of H2 from water.
water, it exhibits a superior catalytic activity towards HER with a low onset overpotential of 137.0 mV and a low Tafel slope of 54.4 mV dec−1, as well as long-term stability (up to 12 h). Hence, this new approach of synthesizing oxidative CVD GO on 3D Ni foam can enhance the Ni electrocatalyst and its stability in an acidic electrolyte. This collaborative GO@Ni electrocatalyst, which is a good candidate to replace Pt, may lead to the practical production of H2 from water.
Conflicts of interest
There are no conflicts to declare.Acknowledgements
This work was financially supported by the Thailand Research Fund and Vidyasirimedhi Institute of Science and Technology (RSA5880043). Additional support was received from the Frontier Research Centre at VISTEC.References
- J. Chow, R. J. Kopp and P. R. Portney, Science, 2003, 302, 1528–1531 CrossRef PubMed.
- A. J. Bard and M. A. Fox, Acc. Chem. Res., 1995, 28, 141–145 CrossRef CAS.
- Y. Zhou, Y. Leng, W. Zhou, J. Huang, M. Zhao, J. Zhan, C. Feng, Z. Tang, S. Chen and H. Liu, Nano Energy, 2015, 16, 357–366 CrossRef CAS.
- P. Liu and J. A. Rodriguez, J. Am. Chem. Soc., 2005, 127, 14871–14878 CrossRef CAS PubMed.
- Y. Liu, H. Yu, X. Quan, S. Chen, H. Zhao and Y. Zhang, Sci. Rep., 2014, 4, 6843 CrossRef CAS PubMed.
- G. Zhang, G. Wang, Y. Liu, H. Liu, J. Qu and J. Li, J. Am. Chem. Soc., 2016, 138, 14686–14693 CrossRef CAS PubMed.
- M. Sun, H. Liu, J. Qu and J. Li, Adv. Energy Mater., 2016, 6, 1600087 CrossRef.
- Y. Li, P. Cai, S. Ci and Z. Wen, ChemElectroChem, 2017, 4, 340–344 CrossRef CAS.
- S. Bai, C. Wang, M. Deng, M. Gong, Y. Bai, J. Jiang and Y. Xiong, Angew. Chem., Int. Ed., 2014, 53, 12120–12124 CrossRef CAS PubMed.
- D. Hou, W. Zhou, X. Liu, K. Zhou, J. Xie, G. Li and S. Chen, Electrochim. Acta, 2015, 166, 26–31 CrossRef CAS.
- W. Zhou, J. Zhou, Y. Zhou, J. Lu, K. Zhou, L. Yang, Z. Tang, L. Li and S. Chen, Chem. Mater., 2015, 27, 2026–2032 CrossRef CAS.
- N. Danilovic, R. Subbaraman, D. Strmcnik, K.-C. Chang, A. P. Paulikas, V. R. Stamenkovic and N. M. Markovic, Angew. Chem., Int. Ed., 2012, 51, 12495–12498 CrossRef CAS PubMed.
- Y.-H. Chang, C.-T. Lin, T.-Y. Chen, C.-L. Hsu, Y.-H. Lee, W. Zhang, K.-H. Wei and L.-J. Li, Adv. Mater., 2013, 25, 756–760 CrossRef CAS PubMed.
- Y. Zheng, Y. Jiao, Y. Zhu, L. H. Li, Y. Han, Y. Chen, A. Du, M. Jaroniec and S. Z. Qiao, Nat. Commun., 2014, 5, 3783 Search PubMed.
- Z. Zhou, F. He, Y. Shen, X. Chen, Y. Yang, S. Liu, T. Mori and Y. Zhang, Chem. Commun., 2017, 53, 2044–2047 RSC.
- A. K. Geim and K. S. Novoselov, Nat. Mater., 2007, 6, 183–191 CrossRef CAS PubMed.
- J. Deng, P. Ren, D. Deng and X. Bao, Angew. Chem., Int. Ed., 2015, 54, 2100–2104 CrossRef CAS PubMed.
- T.-F. Yeh, J. Cihlář, C.-Y. Chang, C. Cheng and H. Teng, Mater. Today, 2013, 16, 78–84 CrossRef CAS.
- D. Chanda, J. Hnat, A. S. Dobrota, I. A. Pasti, M. Paidar and K. Bouzek, Phys. Chem. Chem. Phys., 2015, 17, 26864–26874 RSC.
- S. J. Chae, F. Güneş, K. K. Kim, E. S. Kim, G. H. Han, S. M. Kim, H.-J. Shin, S.-M. Yoon, J.-Y. Choi, M. H. Park, C. W. Yang, D. Pribat and Y. H. Lee, Adv. Mater., 2009, 21, 2328–2333 CrossRef CAS.
- M. K. Kostov, E. E. Santiso, A. M. George, K. E. Gubbins and M. B. Nardelli, Phys. Rev. Lett., 2005, 95, 136105 CrossRef CAS PubMed.
- Y. Zhang, L. Gomez, F. N. Ishikawa, A. Madaria, K. Ryu, C. Wang, A. Badmaev and C. Zhou, J. Phys. Chem. Lett., 2010, 1, 3101–3107 CrossRef CAS.
- N. Phattharasupakun, J. Wutthiprom, P. Chiochan, P. Suktha, M. Suksomboon, S. Kalasina and M. Sawangphruk, Chem. Commun., 2016, 52, 2585–2588 RSC.
- S. Seetharaman, R. Balaji, K. Ramya, K. S. Dhathathreyan and M. Velan, Int. J. Hydrogen Energy, 2013, 38, 14934–14942 CrossRef CAS.
- S. Chen, L. Brown, M. Levendorf, W. Cai, S.-Y. Ju, J. Edgeworth, X. Li, C. W. Magnuson, A. Velamakanni, R. D. Piner, J. Kang, J. Park and R. S. Ruoff, ACS Nano, 2011, 5, 1321–1327 CrossRef CAS PubMed.
- G. Faggio, A. Capasso, G. Messina, S. Santangelo, T. Dikonimos, S. Gagliardi, R. Giorgi, V. Morandi, L. Ortolani and N. Lisi, J. Phys. Chem. C, 2013, 117, 21569–21576 CAS.
- J. Ito, J. Nakamura and A. Natori, J. Appl. Phys., 2008, 103, 113712 CrossRef.
- T.-F. Yeh, J.-M. Syu, C. Cheng, T.-H. Chang and H. Teng, Adv. Funct. Mater., 2010, 20, 2255–2262 CrossRef CAS.
- T.-F. Yeh, F.-F. Chan, C.-T. Hsieh and H. Teng, J. Phys. Chem. C, 2011, 115, 22587–22597 CAS.
- J.-C. Yoon, P. Thiyagarajan, H.-J. Ahn and J.-H. Jang, RSC Adv., 2015, 5, 62772–62777 RSC.
- J. Lu, T. Xiong, W. Zhou, L. Yang, Z. Tang and S. Chen, ACS Appl. Mater. Interfaces, 2016, 8, 5065–5069 CAS.
- L. F. Pan, Y. H. Li, S. Yang, P. F. Liu, M. Q. Yu and H. G. Yang, Chem. Commun, 2014, 50, 13135–13137 RSC.
- J. Duan, S. Chen, B. A. Chambers, G. G. Andersson and S. Z. Qiao, Adv. Mater., 2015, 27, 4234–4241 CrossRef CAS PubMed.
- D. Kong, H. Wang, Z. Lu and Y. Cui, J. Am. Chem. Soc., 2014, 136, 4897–4900 CrossRef CAS PubMed.
- B. E. Conway and B. V. Tilak, Electrochim. Acta, 2002, 47, 3571–3594 CrossRef CAS.
- J. O. M. Bockris and E. C. Potter, J. Electrochem. Soc., 1952, 99, 169–186 CrossRef CAS.
- Y. Matsumoto, M. Koinuma, S. Ida, S. Hayami, T. Taniguchi, K. Hatakeyama, H. Tateishi, Y. Watanabe and S. Amano, J. Phys. Chem. C, 2011, 115, 19280–19286 CAS.
- M. Gaboardi, A. Bliersbach, G. Bertoni, M. Aramini, G. Vlahopoulou, D. Pontiroli, P. Mauron, G. Magnani, G. Salviati, A. Zuttel and M. Ricco, J. Mater. Chem. A, 2014, 2, 1039–1046 CAS.
- Q. Li, H. Wang, H. Xia, S. Wei and J. Yang, Int. J. Quantum Chem., 2014, 114, 879–884 CrossRef CAS.
- W. Zhang, Y. Li, X. Zeng and S. Peng, Sci. Rep., 2015, 5, 10589 CrossRef CAS PubMed.
Footnote |
| † Electronic supplementary information (ESI) available. See DOI: 10.1039/c8se00161h |
| This journal is © The Royal Society of Chemistry 2018 |

