A 3D petal-like Ni3S2/CoNi2S4 hybrid grown on Ni foam as a binder-free electrode for energy storage†
Fangshuai
Chen
a,
Hui
Wang
a,
Shan
Ji
 *b,
Vladimir
Linkov
c and
Rongfang
Wang
 *a
*a
aCollege of Chemical Engineering, Qingdao University of Science and Technology, Qingdao, 266042, China. E-mail: wrf38745779@126.com; Fax: +86-931-7971533; Tel: +86-931-7971533
bCollege of Biological, Chemical Science and Chemical Engineering, Jiaxing University, Jiaxing, 314001, China. E-mail: jishan@mail.zjxu.edu.cn; Fax: +86 15024355548; Tel: +86 15024355548
cSouth African Institute for Advanced Materials Chemistry, University of the Western Cape, Cape Town, 7535, South Africa
First published on 12th June 2018
Abstract
In this study, a simple and one-pot synthesis method is developed to prepare a three-dimensional petal-like Ni3S2/CoNi2S4 hybrid material which can be used as a binder-free electrode in electrochemical energy storage. This material possesses a high areal capacity, such as 758 μA h cm−2 at a current density of 2 mA cm−2. With a 20-fold current density increase, the as-prepared material retains 70% of its original capacity. Furthermore, an asymmetric supercapacitor is assembled by using the Ni3S2/CoNi2S4 hybrid as the cathode and active carbon as the anode in a coin cell. This cell exhibits an outstanding areal power density of 31.212 mW cm−2 at an areal energy density of 0.288 mW h cm−2 and still retains a quite high areal power density of 3.876 mW cm−2 at an areal energy density of 0.364 mW h cm−2. These results show that the 3D petal-like Ni3S2/CoNi2S4 hybrid is a promising cathode material for practical application in energy storage.
Aqueous electrolyte-based pseudocapacitors, also known as supercapacitors, have attracted considerable attention in recent years, since the aqueous cell design has the advantages of low-cost and manufacturing easiness and are safe in comparison to their organic electrolyte counterparts.1–4 In order to be competitive, the active materials of these cells should possess high specific capacitance, rate capability and cycling stability in order to offset their main drawback, namely low cell voltage.5 Compared with electrical double-layer capacitors (EDLCs), pseudocapacitors have a much higher energy density since the pseudocapacitance phenomenon emanates from the faradaic redox reactions between active electrode materials and the electrolyte.6–8 Transition metal oxides/hydroxides are the most promising active materials for pseudocapacitors due to their high theoretical specific capacitance, abundance and low toxicity.9–11 However, their practical applications are hindered by their low electronic conductivity and poor rate performance, which results in a much lower actual specific capacitance, compared to theoretical values.
In comparison to transition metal oxides/hydroxides, it has been reported that transition metal sulfides possess higher electronic conductivity due to their lower optical band gap energy.12,13 Recently, some binary and mixed-transition metal sulfides, which combine two metal cations together, have been successfully demonstrated as new electrode materials for supercapacitor application because of their rich valence states and excellent electrical conductivity.14,15 Among these binary transition metal sulfides, much attention was paid to binary Ni–Co sulfides as promising active materials for aqueous pseudocapacitors owing to their superior electronic conductivity properties.16 Hu et al.12 synthesized 3-dimensional flower-like CoNi2S4/carbon nanotubes as a high-performance electrode material for pseudocapacitors, and these newly prepared composites showed an enhanced specific capacitance with good rate capability. Lou et al. developed an ion-change strategy to prepare onion-like Ni–Co sulfides with hollow structured shells for hybrid supercapacitors using Ni–Co oxide particles as precursors.17 Various nanostructured Ni–Co sulfides were also reported to demonstrate satisfactory electrochemical performance. Shape-controlled synthesis of various NiCo2S4 architectures using different solvents was investigated by Zhang et al.,18 and it was found that the solvent solubility and polarity have a significant influence on the final morphology by controlling nucleation and crystal growth processes. More recently, Zhai et al.19 developed a two-step solvothermal method to directly grow a 3D-networked, ultrathin, and porous Ni3S2/CoNi2S4 material on Ni foam via solvothermal sulfidation of 3D Ni–Co precursors. It was found that the Ni3S2/CoNi2S4 hybrid electrode with a 3D structure can possess significantly improved electrochemical properties because of its high electrical conductivity and surface area which facilitate the ion and electron transportation during faradaic redox reactions. Although the 3D Ni3S2/CoNi2S4 hybrid electrode structure can distinctly enhance the electrochemical performance of the material, its complicated synthesis procedure hinders practical application.
In this study, a simple one-step method was developed to synthesize a 3D petal-like Ni3S2/CoNi2S4 hybrid electrode via a solvothermal process. The morphological study of the obtained product showed that 3D nanosheets of the Ni3S2/CoNi2S4 hybrid with an interconnected structure were successfully grown on Ni foam without using any binders. This binder-free Ni3S2/CoNi2S4 hybrid exhibited high areal capacity with outstanding rate capability and cycling stability. To further evaluate its electrochemical performance, an asymmetric cell was manufactured using Ni3S2/CoNi2S4 as the cathode and activated carbon as the anode; the cell delivered a high power density with good cycling durability.
Experimental
Preparation of the 3D Ni3S2/CoNi2S4 hybrid electrode
All of the chemicals used in the experiment were of analytical grade and used without further purification. Before growing 3D Ni3S2/CoNi2S4 on it, a 3 × 2 cm2 Ni foam was ultrasonically treated in a 1 M HCl solution for 10 min and then alternatively washed with deionized water and ethanol several times in an ultrasound bath. After that, the Ni foam was vacuum dried and kept in a vacuum desiccator. The detailed procedure of directly growing the 3D Ni3S2/CoNi2S4 hybrid electrode on Ni foam is as follows. 16 ml anhydrous ethane diamine and 2 mmol sulfur powder were mixed and stirred for about 10 min, and then 16 ml absolute ethyl alcohol and various amounts of CoCl2·6H2O (0.25, 0.5 and 0.75 mmol) were introduced into the solution and stirred for 10 min. The resulting solution was then transferred into a 100 ml Teflon-lined stainless steel autoclave, and a piece of the pre-treated nickel foam was immersed in it, followed by heating at 160 °C for 10 h. After cooling to room temperature, the Ni foam was alternatively washed with ultrapure water and absolute ethyl alcohol several times and then dried in a vacuum oven at 50 °C for 12 h. The dried product was the Ni3S2/CoNi2S4 hybrid electrode which was labelled NCN-x (x: 1, 2 and 3 correspond to the amount of CoCl2·6H2O used during the synthesis, namely 0.25, 0.5 and 0.75 mmol). The obtained mass loadings of NCN-1, NCN-2 and NCN-3 are 2.3, 2.8 and 2.1 mg cm−2, respectively.Physical characterization
XRD patterns were recorded on a Shimadzu XD-3A X-ray diffractometer using filtered Cu-Kα radiation (λ = 0.15418 nm) generated at 40 kV and 30 mA. Scans for 2θ values were recorded at 10° min−1. Scanning electron microscopy (SEM) images were obtained using a Carl Zeiss Ultra Plus electron microscope. The high angle annular dark field scanning transmission electron microscopy (STEM) images of the catalysts were obtained using a JEOL (JEM-2000 FX) microscope operating at 200 kV. X-ray photoelectron spectra (XPS) were acquired with a VG Escalab210 spectrometer fitted with an Mg 300 W X-ray source.Electrochemical measurements
The electrochemical performance of the as-prepared Ni3S2/CoNi2S4 samples was evaluated using a CHI 650D electrochemical workstation. The electrochemical analysis was carried out in a three-electrode configuration consisting of the as-prepared samples on Ni foam with an area of 1 × 1 cm2, activated carbon (AC), and Hg/HgO (1.0 M KOH) as a working electrode, a counter electrode and a reference electrode, respectively. The cyclic voltammetry (CV) measurements were taken using three-electrode and two-electrode systems in 3 M KOH aqueous electrolytes. Galvanostatic charge/discharge (GCD) and cycling tests of the electrodes were conducted using a LAND CT2001A battery measurement installation. The areal capacity (C), energy density (E), and power density (P) were calculated according to the following equations described in the literature.20The asymmetric supercapacitor was assembled in a coin cell using the as-prepared electrode as a cathode and commercial activated carbon as an anode with a polyvinylidene fluoride separator. The anode, which was prepared by mixing AC (80 wt%), carbon black (10 wt%) and PTFE (10 wt%), was pressed into Ni foam. The electrodes and the separator were cut into the required size and sandwiched into a R2032 coin cell with a KOH electrolyte.
Results and discussion
Morphology and structure
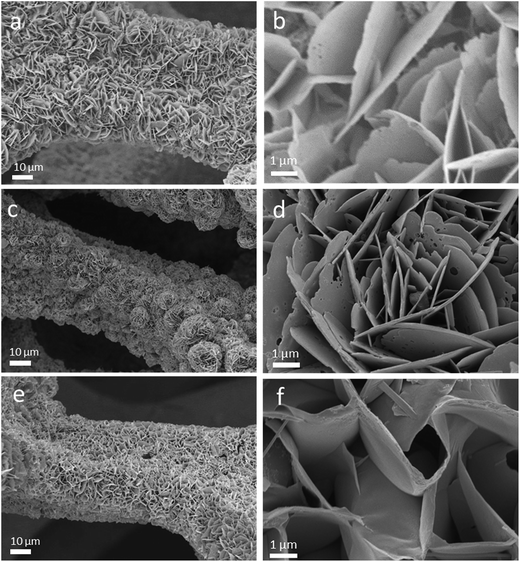
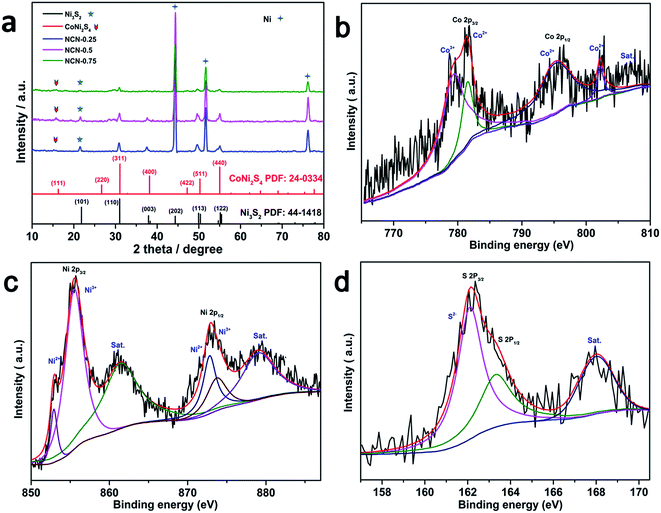
The Ni3S2/CoNi2S4 hybrid material was directly synthesized on Ni foam via a single step solvothermal method. Fig. 1 shows the SEM pictures of the as-prepared Ni3S2/CoNi2S4 hybrids grown on Ni foam with various amounts of CoCl2·6H2O in the precursor. These SEM pictures show that well-defined petal-like Ni3S2/CoNi2S4 structures are formed on the Ni foam surfaces. The “petals” are interconnected with each other and form a 3D structure. The image presented in Fig. 1d allowed the measurement of petal dimensions; its thickness is in the range of ca. 60 to 80 nm. When the quantity of CoCl2 added was 0.25 mmol, the surface of formed petals was not well developed on the Ni foam. Thicker petal structures were formed on the Ni foam substrate while increasing the amount of CoCl2 to 0.75 mmol (see Fig. 1f). As shown in Fig. 1b, d and f, the petals of the NCN-2 sample are smaller and thinner than those of NCN-1 and NCN-3, and so it could provide a large active surface area for exchanging ions and electrons between the electrolyte and catalyst materials during faradaic redox reactions, thus resulting in enhanced electrochemical performance.21X-ray diffraction analysis was performed to identify the crystallographic structures of the as-prepared NCN samples. According to the Joint Committee on Powder Diffraction Standards Card (JCPDS), the four major peaks at 16.28°, 31.47°, 39.01° and 47.20° were indexed to the (111), (311), (400) and (422) planes of the CoNi2S4 phase (JCPDS card no. 24-0334), and the five major peaks at 21.75°, 31.10°, 37.78°, 49.73° and 55.16° were indexed to the (101), (110), (003), (113) and (122) planes of the Ni3S2 phase (JCPDS card no. 44-1418). The major diffraction peaks of hexagonal phase Ni3S2 and cubic phase CoNi2S4 are observed in the XRD patterns of the obtained NCN samples, proving that Ni3S2 and CoNi2S4 with similar structures coexist in these materials. Except for the diffraction peaks of Ni at 44.5°, 51.6° and 76.4° resulting from the Ni foam, no other Ni sulfide or oxide species were observed in the XRD patterns. This indicates that only Ni3S2 and CoNi2S4 were formed on the Ni substrate during the newly developed solvothermal synthesis. As shown in Fig. 2a, the intensities of the diffraction peaks of Ni3S2 and CoNi2S4 were very low, due to the low amount of Ni3S2 and CoNi2S4 formed on the Ni foam. X-ray photoelectron spectroscopy (XPS) measurements were also employed to investigate the surface composition of NCN-2, and the results are presented in Fig. 2b–d. In Fig. 2b, the fitted peaks at 779.5 eV and 795.2 eV are attributed to Co3+, whereas the other two fitted peaks at 781.8 and 796.6 eV are indexed to Co2+.22 The Co 2p XPS spectra indicate that the Co3+/Co2+ pair coexists in NCN-2. In Fig. 2c, the XPS spectra of Ni 2p can be well matched with two shakeup satellites and two spin–orbit doublets characteristic of Ni2+/Ni3+ using Gaussian fitting. As shown in the Ni 2p XPS spectra, the binding energies of Ni 2p peaks at ca. 855.9 and 873.4 eV are ascribed to Ni2+, and the peaks at 857.5 and 875.2 eV are ascribed to Ni3+, respectively. In Fig. 2d, the S 2p XPS spectra can be fitted into a main peak and a shakeup satellite peak, in which the peak at 162.8 eV is ascribed to the binding energy of Ni–S and Co–S bonds. The results of XPS analysis indicate that the surface composition of NCN-2 is NiCo2S4 and is matched well with the reported chemical states of NiCo2S4.22,23 The coexistence of Co3+/Co2+ and Ni2+/Ni3+ cation pairs in the NCN composite could provide efficient active sites for energy storage. The XPS spectra of NCN-1 and NCN-3 are also presented in Fig. S1.† On the basis of the aforementioned analysis of XRD and XPS results, it can be identified that the 3D-network is composed of Ni3S2/CoNi2S4 nanosheets.
The structure and morphology of the obtained petal-like Ni3S2/CoNi2S4 materials were further investigated with the transmission electron microscope equipped with an energy dispersive X-ray spectrometer. As can be seen from the TEM image of NCN-2 in Fig. 3a, the surface of NCN-2 is wrinkled and petal-like with a uniform texture. The inset in Fig. 3a shows that the selected area electron diffraction (SAED) pattern of a petal has a well-defined pattern with several bright dots, implying the polycrystalline nature of the Ni3S2/CoNi2S4 nanosheet. These diffraction dots can be indexed to the (110)/(211) planes of Ni3S2 and (400)/(440) planes of CoNi2S4, confirming the co-existence of Ni3S2 and CoNi2S4 in the petals. There are many white voids in Fig. 3b, which result from the porous structure of the newly prepared material. Well-developed porosity can improve the diffusion and transport of electrolyte inside the electrode materials, facilitating the charge transfer during faradaic redox reactions. Many lattice fringes are also clearly present in Fig. 3b. The elemental distribution of NCN-2 was evaluated with HAADF-STEM and EELS element concentration maps. Fig. 3d–f exhibit the elemental mappings of S, Ni and Co of the selected region in Fig. 3c, revealing that these elements are evenly distributed throughout the whole selected region.
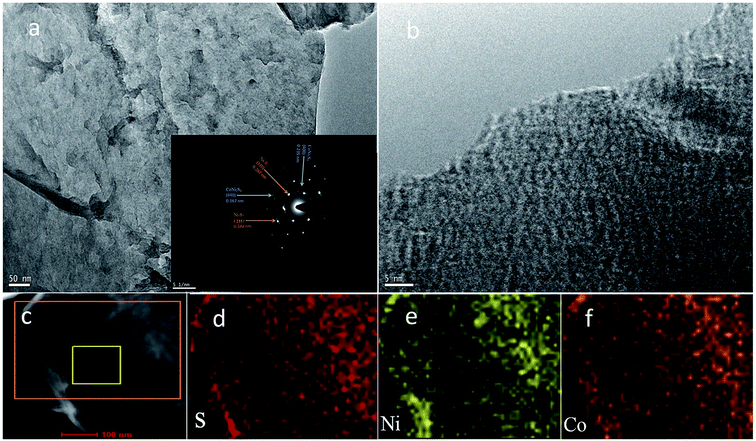 | ||
| Fig. 3 TEM images of NCN-2 (a and b; the inset is the SAED pattern), STEM (c) and EELS elemental mappings of S, Ni and Co (d–f). | ||
Electrochemical performance
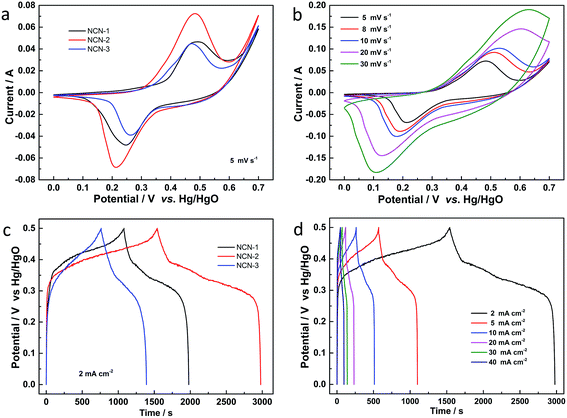
The electrochemical behavior of the NCN samples was first investigated by CV measurements over the potential range of 0.0 to 0.7 V (vs. Hg/HgO) in a 3.0 M KOH electrolyte. Fig. 4a shows the CV curves of the NCN samples at a scan rate of 5 mV s−1. In the CVs of these three samples, well-defined redox peaks can be observed at ca. 0.25 V and 0.48 V for anodic and cathodic scanning, respectively, indicating the battery-like behavior of NCN electrodes. Two faradaic redox peaks in these CVs in the potential region of 0 to 0.7 V (vs. Hg/HgO) are associated with M–S and M–S–OH (M: Ni or Co) transformation during the redox reaction.24 When these CVs are compared, the CV of NCN-2 shows the largest curve area and the highest faradaic redox peak intensity, suggesting that NCN-2 has the highest specific capacity and fastest redox reaction kinetics among the three samples. Fig. 4b exhibits the CV curves of NCN-2 at different scan rates ranging from 5 to 30 mV s−1, which were tested in the potential range of 0.0 to 0.7 V (vs. Hg/HgO). The current density increases with the scan rate, accompanied by the displacement of the anodic and cathodic current peaks to more positive and negative potentials, respectively. The shapes of the voltammograms at different scan rates are quite similar to each other, indicating that the electron/ion transfer of the interfacial redox reactions on the NCN surfaces has fast kinetics.25 The quasi-symmetric redox peaks shown in Fig. 4b testify to the ideal battery-like behavior and good rate capability of NCN-2.26Galvanostatic charge/discharge (GCD) curves of the as-prepared NCN samples at a current density of 2 mA cm−2 are presented in Fig. 4c. Two obvious voltage plateaus associated with the faradaic redox reaction occurring during the charge/discharge process are clearly present in the GCD curves for all three samples, which are well consistent with the redox peaks obtained during the CV measurements. As expected, NCN-2 shows the longest charge/discharge times among these NCN samples, due to its highest specific capacitance. The GCD curves of NCN-2 were also recorded within the potential window of 0–0.5 V (vs. Hg/HgO) at various current densities ranging from 2 to 40 mA cm−2 (Fig. 4d). The quasi-symmetric shapes of GCD curves, especially at a high current density, point to the good electrochemical performance and excellent reversibility of the faradaic redox reaction of NCN-2.27
Areal capacities related to GCD curves at various current densities for NCN-2 were calculated using the equation listed in the Experimental section and are presented in Fig. 5a. The areal capacity values of NCN-2 were 758, 721, 686, 637, 582 and 533 μA h cm−2 at the current densities of 2, 5, 10, 20, 30 and 40 mA cm−2, respectively. At the same current densities, the calculated areal capacity values of NCN-1 and NCN-3 were lower than those of NCN-2. As can be seen in Fig. 5a, when the current density was increased from 2 to 40 mA cm−2, the capacity retention of NCN-2 was 70%, which was higher than those of NCN-1 (54%) and NCN-3 (51%).
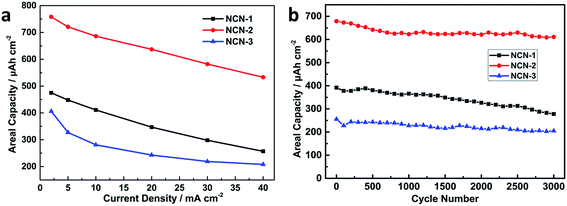 | ||
| Fig. 5 Areal capacity vs. current density of the NCN samples (a); cycling stability of the NCN samples at a current density of 20 mA cm−2 (b). | ||
The cycling stability is a key parameter for energy storage applications. To evaluate the cycling stability of the NCN samples, GCD cycling experiments were carried out at a current density of 20 mA cm−2 for 3000 continuous cycles. As shown in Fig. 5b, the capacity of NCN-2 gradually drops in the first 700 cycles and subsequently becomes quite stable. A similar phenomenon was observed in many previous studies.3,28 NCN-2 displays an areal capacity of 611 μA h cm−2 (90% capacity retention) after 3000 cycles, significantly higher than those of NCN-1 (71%) and NCN-3 (70%). Their corresponding gravimetric specific capacity vs. current density and cycling stability are also provided in Fig. S2.†
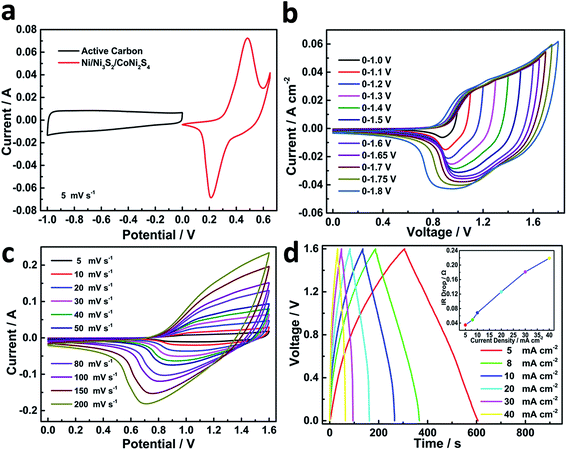
In order to evaluate the electrochemical performance of NCN-2 in the real-world condition of energy storage applications, an asymmetric supercapacitor coin cell was assembled by using NCN-2 as the cathode and activated carbon as the anode with 3 M KOH as the electrolyte. To obtain a suitable voltage window of the NCN-2//AC cell, the CV curves of NCN-2 and AC were recorded in a three-electrode testing cell separately and are shown in Fig. 6a. The CV curve of AC with a typical pattern of an EDLC was obtained in the potential range of −1.0 to 0.0 V (vs. Hg/HgO). The CV curve of NCN-2 was obtained over the potential range of 0.0 to 0.6 V (vs. Hg/HgO). Based on the CV data presented in Fig. 6a and the combination of a battery-like electrode and EDLC effects described in ref. 29, the voltage window of the NCN-2//AC cell could be extended to 1.6 V. The CV curves of the NCN-2//AC cell recorded at various voltage windows are shown in Fig. 6b, which shows that no obvious polarization was found in the voltage window of 0.0–1.6 V, testifying that 1.6 V is a reasonable voltage window for the NCN-2//AC cell.
Fig. 6c shows that the NCN-2//AC cell has excellent stability over the voltage range of 0.0 to 1.6 V. No obvious distortion of the CV shape is found in Fig. 6c when the scan rates increase from 5 to 200 mV s−1, implying the fast and stable charge–discharge behavior of the as-assembled coin cell. The CV curves have a large current area with very broad faradaic redox peaks, which is the typical feature of the asymmetric supercapacitor combining battery and EDLC properties. To further determine the suitable voltage range for the NCN-2//AC cell, the voltage of charge–discharge was progressively increased from 1.0 to 1.7 V (Fig. S3†), and their corresponding coulombic efficiency at different voltages was also calculated and is given in Table S1,† which shows that 1.6 V is an appropriate voltage for the NCN-2//C cell (coulombic efficiency > 95%). GCD was also carried out to further investigate the capacitive performance of the assembled cell. As shown in Fig. 6d, the GCD curves are symmetric curves with a good coulombic efficiency. IR drop vs. current density is shown in the inset in Fig. 6d, which shows that the IR drop linearly increases with the current density, indicating that the internal resistance of the active material won't change during the charge/discharge due to its excellent stability.
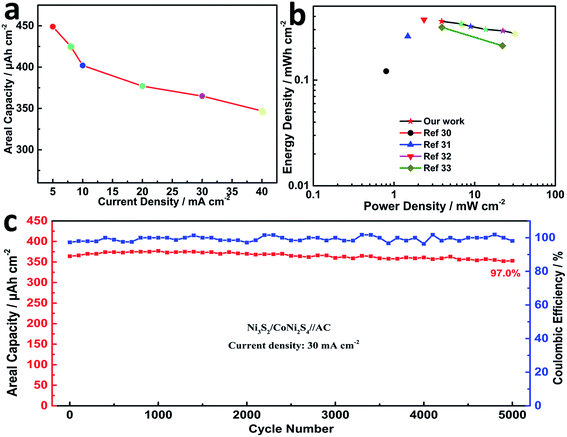
Calculated using the data of the discharge curves, the areal capacity values of the hybrid cell are summarized in Fig. 7a. At a current density of 5 mA cm−2, the NCN-2//AC cell exhibited a high areal capacity of 439 μA h cm−2. Moreover, the device still maintained an areal capacity of 345 μA h cm−2 with a rate capability of 78.6% at a high current density of 40 mA cm−2. The areal power density and energy density of the NCN-2//AC cell were calculated and are plotted as shown in Fig. 7b (gravimetric power and energy densities are also shown in Fig. S4†). It is noted that this cell exhibits an outstanding areal power density of 31.212 mW cm−2 at an areal energy density of 0.288 mW h cm−2 and still retains a quite high areal power density of 3.876 mW cm−2 at an areal energy density of 0.364 mW h cm−2, making it feasible for practical applications in energy storage. The maximum capacitive performance of our hybrid device is substantially higher than those of the previously reported hybrid NiCo2S4 or Ni3S2-based electrode materials, such as NiCo2S4//C (0.8 mW cm−2 at an areal energy density of 0.121 mW h cm−2),30 Ni3S2@CdS//C (1.482 mW cm−2 at an areal energy density of 0.259 mW h cm−2),31 NC–NC LDHs NFAs@NSs//AC (23.535 mW cm−2 at an areal energy density of 0.372 mW h cm−2),32 and Co0.67Ni0.33 LDH/NiCo2O4//AC (3.917 mW cm−2 at an areal energy density of 0.315 mW h cm−2).33 When two-coin cells of CoNi2S4/Ni3S2//AC are connected in series, they are able to power a commercial red LED light for more than 40 min (shown in Fig. S4†), further indicating its high energy density. To evaluate the cycling stability of the as-assembled cell, it was tested at a current density of 30 mA cm−2 over the 0.0–1.6 V potential range for 5000 continuous GCD cycles. This asymmetric cell showed good capacitance retention with 97.0% of its initial capacitance being preserved after 5000 cycles, accompanied by almost 100% coulombic efficiency (Fig. 7c).
Conclusions
In conclusion, a simple low-cost one-pot method has been successfully developed to directly grow a 3D petal-like Ni3S2/CoNi2S4 hybrid material on Ni foam. The as-prepared hybrid exhibited a high areal capacity of 758 μA h cm−2 at a current density of 2 mA cm−2. When the current density was increased from 2 to 40 mA cm−2, the NCN-2 hybrid material retained 70% of its capacity. The areal capacity of this material was 611 μA h cm−2 after 3000 cycles at a current density of 20 mA cm−2, which is equal to 90% capacity retention. An asymmetric supercapacitor cell was successfully assembled using NCN-2 as a cathode and AC as an anode with 3 M KOH as an electrolyte. The obtained cell delivered a high power density of 31.212 mW cm−2 at a current density of 40 mA cm−2 with stable cycling durability. Two as-assembled cells were further connected in series to verify their electrochemical performance in a practical application by powering a commercial LED light. The low cost and satisfactory electrochemical performance of the newly prepared electrode material make it a suitable candidate for use as a cathode in practical supercapacitor energy storage applications.Conflicts of interest
The authors declare no conflict of interest.Acknowledgements
The authors would like to thank the National Natural Science Foundation of China (21766032 and 51661008) and the University Scientific Research Project of Gansu Province (No. 2015A-007) for financially supporting this work.References
- Q. Ren, R. Wang, H. Wang, J. Key, D. J. L. Brett, S. Ji, S. Yin and P. Kang Shen, J. Mater. Chem. A, 2016, 4, 7591–7595 RSC.
- R. Wang, Y. Ma, H. Wang, J. Key, D. Brett, S. Ji, S. Yin and P. K. Shen, J. Mater. Chem. A, 2016, 4, 5390–5394 RSC.
- D. Cai, B. Liu, D. Wang, Y. Liu, L. Wang, H. Li, Y. Wang, C. Wang, Q. Li and T. Wang, Electrochim. Acta, 2014, 115, 358–363 CrossRef.
- S. Zheng, X. Li, B. Yan, Q. Hu, Y. Xu, X. Xiao, H. Xue and H. Pang, Adv. Energy Mater., 2017, 7, 1602733 CrossRef.
- W. Wei, X. Cui, W. Chen and D. G. Ivey, Chem. Soc. Rev., 2011, 40, 1697–1721 RSC.
- T. Deng, W. Zhang, O. Arcelus, J. G. Kim, J. Carrasco, S. J. Yoo, W. Zheng, J. Wang, H. Tian and H. Zhang, Nat. Commun., 2017, 8, 15194–15204 CrossRef PubMed.
- L. Cao, F. Xu, Y. Y. Liang and H. L. Li, Adv. Mater., 2004, 16, 1853–1857 CrossRef.
- B. Li, P. Gu, Y. Feng, G. Zhang, K. Huang, H. Xue and H. Pang, Adv. Funct. Mater., 2017, 27, 1605784 CrossRef.
- J. Liu, J. Jiang, C. Cheng, H. Li, J. Zhang, H. Gong and H. J. Fan, Adv. Mater., 2011, 23, 2076–2081 CrossRef PubMed.
- H. Jiang, C. Li, T. Sun and J. Ma, Chem. Commun., 2012, 48, 2606 RSC.
- J. Hu, F. Qian, G. Song and L. Wang, Nanoscale Res. Lett., 2016, 11, 257 CrossRef PubMed.
- Z. Ai, Z. Hu, Y. Liu, M. Fan and P. Liu, New J. Chem., 2016, 40, 340–347 RSC.
- P. Geng, S. Zheng, H. Tang, R. Zhu, L. Zhang, S. Cao, H. Xue and H. Pang, Adv. Energy Mater., 2018, 1703259 CrossRef.
- Y. M. Chen, Z. Li and X. W. Lou, Angew. Chem., Int. Ed., 2015, 54, 10521–10524 CrossRef PubMed.
- S. J. Patil, J. H. Kim and D. W. Lee, Chem. Eng. J., 2017, 322, 498–509 CrossRef.
- H. Chen, J. Jiang, L. Zhang, H. Wan, T. Qi and D. Xia, Nanoscale, 2013, 5, 8879–8883 RSC.
- B. Y. Guan, L. Yu, X. Wang, S. Song and X. W. Lou, Adv. Mater., 2017, 29, 16050501 Search PubMed.
- Y. Zhang, M. Ma, J. Yang, C. Sun, H. Su, W. Huang and X. Dong, Nanoscale, 2014, 6, 9824–9830 RSC.
- W. He, C. Wang, H. Li, X. Deng, X. Xu and T. Zhai, Adv. Energy Mater., 2017, 1700983 CrossRef.
- C. Li, J. Balamurugan, N. H. Kim and J. H. Lee, Adv. Energy Mater., 2018, 8, 1702014 CrossRef.
- G. He, M. Qiao, W. Li, Y. Lu, T. Zhao, R. Zou, B. Li, J. A. Darr, J. Hu and M. M. Titirici, Adv. Sci., 2017, 4, 1600214 CrossRef PubMed.
- H. Wei, R. Chen, X. Wei, L. Zou, Q. Ni and D. Bao, ACS Appl. Mater. Interfaces, 2014, 6, 19318 CrossRef PubMed.
- D. Li, Y. Gong and C. Pan, Sci. Rep., 2016, 6, 29788 CrossRef PubMed.
- L. Hou, Y. Shi, S. Zhu, M. Rehan, G. Pang, X. Zhang and C. Yuan, J. Mater. Chem. A, 2017, 5, 133–144 RSC.
- Y.-M. Hu, M.-C. Liu, Y.-X. Hu, Q.-Q. Yang, L.-B. Kong, W. Han, J.-J. Li and L. Kang, Electrochim. Acta, 2016, 190, 1041–1049 CrossRef.
- F. Lu, M. Zhou, W. Li, Q. Weng, C. Li, Y. Xue, X. Jiang, X. Zeng, Y. Bando and D. Golberg, Nano Energy, 2016, 26, 313–323 CrossRef.
- W. Hu, R. Chen, W. Xie, L. Zou, N. Qin and D. Bao, ACS Appl. Mater. Interfaces, 2014, 6, 19318 CrossRef PubMed.
- D. Cai, D. Wang, B. Liu, L. Wang, Y. Liu, H. Li, Y. Wang, Q. Li and T. Wang, ACS Appl. Mater. Interfaces, 2014, 6, 5050 CrossRef PubMed.
- C.-T. Hsu and C.-C. Hu, J. Power Sources, 2013, 242, 662–671 CrossRef.
- W. Kong, C. Lu, W. Zhang, J. Pu and Z. Wang, J. Mater. Chem. A, 2015, 3, 12452–12460 RSC.
- G. Nagaraju, S. Chandra Sekhar, L. Krishna Bharat and J. S. Yu, ACS Nano, 2017, 11, 10860–10874 CrossRef PubMed.
- X. Wang, B. Shi, Y. Fang, F. Rong, F. Huang, R. Que and M. Shao, J. Mater. Chem. A, 2017, 5, 7165–7172 RSC.
- L. Huang, D. Chen, Y. Ding, S. Feng, Z. L. Wang and M. Liu, Nano Lett., 2013, 13, 3135–3139 CrossRef PubMed.
Footnote |
| † Electronic supplementary information (ESI) available. See DOI: 10.1039/c8se00130h |
| This journal is © The Royal Society of Chemistry 2018 |

