 Open Access Article
Creative Commons Attribution 3.0 Unported Licence
A new approach to the identification of high-potential materials for cost-efficient membrane-based post-combustion CO2 capture†
Simon
Roussanaly
 *a,
Rahul
Anantharaman
 a,
Karl
Lindqvist
 ab and
Brede
Hagen
a
aSINTEF Energy Research, Sem Sælandsvei 11, NO-7465 Trondheim, Norway. E-mail: simon.roussanaly@sintef.no; Fax: +47 73597250; Tel: +47 47441763
bNorwegian University of Science and Technology, Department of Energy and Process Engineering, NO-7491 Trondheim, Norway
First published on 11th April 2018
Abstract
Developing “good” membrane modules and materials is a key step towards reducing the cost of membrane-based CO2 capture. While this is traditionally being done through incremental development of existing and new materials, this paper presents a new approach to identify membrane materials with a disruptive potential to reduce the cost of CO2 capture for six potential industrial and power generation cases. For each case, this approach first identifies the membrane properties targets required to reach cost-competitiveness and several cost-reduction levels compared to MEA-based CO2 capture, through the evaluation of a wide range of possible membrane properties. These properties targets are then compared to membrane module properties which can be theoretically achieved using 401 polymeric membrane materials, in order to highlight 73 high-potential materials which could be used by membrane development experts to select materials worth pushing towards further development once practical considerations have been taken into account. Beyond the identification of individual materials, the ranges of membrane properties targets also show the strong potential of membrane-based capture for industrial cases in which the CO2 content in the flue gas is greater than 11%, and that considering CO2 capture ratios lower than 90% would significantly improve the competitiveness of membrane-based capture and lead to potentially significant cost reduction. Finally, it is important to note that the approach discussed here is applicable to other separation technologies and applications beyond CO2 capture, and could help reduce both the cost and time required to develop cost-effective technologies.
1 Introduction
Carbon capture and storage (CCS) is a key technology to limit the impact of anthropogenic CO2 emissions from the power generation sector and industry.1,2 It has been a focus of research and development efforts for several decades.3,4 However, in order to reach the deployment ambitions, the cost of CCS needs be further reduced, with a special emphasis on the CO2 capture part of the chain. In order to significantly reduce the cost of CO2 capture, the combined development of advanced capture technologies and materials is essential. For membrane-based CO2 capture, one of the most promising emerging capture technologies,3,5 this means developing “good” membrane modules and materials. This aspect has conventionally been addressed by many strong international research groups through incremental improvements in permeance from membrane modules with moderate to very high selectivity, based on initial material selection, and educated guesses regarding desired properties.6–11 However, in order to create a disruptive reduction in cost of membrane-based capture, it is important to identify a range of membrane properties, appropriate for the application, which can compete with conventional CO2 capture technologies and further reduce costs.12 Recently, similar approaches have been suggested for solvent-based CO2 capture.13–15 These systematic methodologies enable researchers to provide recommendations, feedbacks and targets on the best combinations of material properties for specific CO2 capture cases, thus supporting a rapid and cost-efficient development of the technologies under consideration.Even though membrane processes are conceptually straightforward, complex and highly integrated multi-stage membrane process layouts are frequently required to meet desired product purity and targeted capture ratio. This results in multiple process design and operation decisions to be considered in order to ensure a suitable driving force for separation and to minimize the cost of such membrane systems considering the optimal trade-offs between the separation work and membrane area requirements. Two main approaches have been considered in the literature to design membrane systems.
The first type is parametric sensitivity-based approaches in which a parametric sensitivity study for a single stage membrane process is performed in order to identify “optimal” process operating points and membrane area for the first stage of the process.16–20 The focus is, typically, on minimising energy consumption. The results obtained from the first stage are used to perform a parametric sensitivity analysis for the second stage of the membrane. The results from the second stage are then checked to ensure that product purity requirements are met and that a suitable design has been achieved. If not, the process is repeated until the required specifications are met. The cost of the membrane system is calculated at the end using a suitable cost model; if it is too high, the process is repeated. The advantage of this approach lies in the visual representation of each membrane stage used in the design process, which improves the understanding of the effects of individual process parameters. The disadvantages are that costs are calculated at the end of the design process when in fact the design trade-off between pressure ratio and membrane area is directly related to costs. Furthermore, feedback related to membrane development are also be inconsistent, complex and time-consuming.
The second type of approach is optimisation-based approaches in which the membrane process is optimised based on a superstructure that includes many possible combinations of flowsheet connections and is normally formulated as a Non-Linear Program (NLP) or a Mixed-Integer Non-Linear Program (MINLP).21–23 There is usually no interaction with the designer in the design process. The advantage of this methodology is that it can potentially identify an optimal membrane and system for given feed composition while including all relevant process schemes in the superstructure. However, on the other hand, it leads to little process insight and consequently little feedback that can be given towards membrane development. Moreover, this approach usually results in complex process configurations.7
Due to the limitations of existing approaches to the design of membrane systems, a novel systematic methodology for the consistent design of post-combustion membrane systems, called the attainable region methodology, has been developed.12,24,25 This approach has been applied to the design of membrane systems for CO2 capture from cement plants25 and is shown to result in better designs than those available in the literature.26
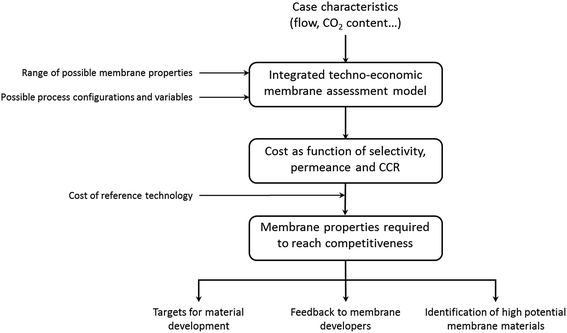
This paper presents a new approach to identify membrane materials with a disruptive potential to reduce the cost of CO2 capture for both the power generation sector and the industry as shown in Fig. 1. Furthermore, this paper also uses the attainable region methodology to establish targets on combinations of membrane properties required for post-combustion membrane-based CO2 capture to compete with the reference solvent CO2 capture technology. These membrane properties can then be used as basis for material development, provide feedback to membrane developers and identify high potential membrane materials. To reach this goal, the cost of membrane-based CO2 capture is optimised and compared to the reference capture technology for a wide combination of membrane properties, as previously illustrated for a coal power plant case at 90% CO2 capture ratio‡ (CCR).12
In order to identify the full potential of membrane-based capture, six industrial and power generation cases are considered. While the CO2 capture ratio is often set to 90%, or higher, based on experience from solvent technologies, recent literature has shown that considering lower CCRs could reduce costs in the case of membrane-based capture.7,27,28 With this perspective, membrane properties are identified for a conventional 90% CCR case, and for cases taking into consideration the potential of lower CCRs. Finally, the combinations of membrane properties obtained are used to provide feedback regarding suitable polymeric materials that could lead to membrane-based capture processes that are cost-competitive withsolvent-based capture.
2 Methodology
2.1 Study concept and system boundaries
This study aims to identify the membrane properties necessary and, subsequently, suitable polymeric materials for membrane-based separation to be cost-competitive with the reference technology (MEA-based absorption) for post-combustion CO2 capture. In order to evaluate the full potential of the membrane-based CO2 capture, six industrial and power generation cases with the characteristics shown in Table 1 are considered: three refinery cases, a cement production plant, a steel plant, and a coal-fired power plant.| Basis | Industrial case considered | Refinery | Cement plant30 | Steel plant31 | Coal power plant32 | ||
|---|---|---|---|---|---|---|---|
| FG29 | LSFO29 | FCC29 | |||||
| Wet | Feed flue gas mass flow [twet h−1] | 282 | 484 | 216 | 348 | 1965 | 2706 |
| CO2 concentration [%wet,vol] | 8.1 | 11.3 | 16.6 | 20.2 | 27.2 | 14.6 | |
| Dry | Feed flue gas mass flow [tdry h−1] | 248 | 452 | 203 | 333 | 1893 | 2644 |
| CO2 concentration [%dry,vol] | 9.9 | 12.6 | 26.1 | 22 | 29.1 | 15.2 | |
The three refinery cases are based on CO2 capture from different units of a high conversion refinery with a crude capacity of 350![[thin space (1/6-em)]](https://www.rsc.org/images/entities/char_2009.gif) 000 barrel per stream day (BPSD).29 The first case, called “Refinery FG”, considers CO2 capture of the CO2 emissions of the combustion of sweet refinery off-gas associated with the two catalytic reformers of the refinery and accounts for around 10% of the emission of the refinery. The second refinery case, called “Refinery LSFO”, considers capture of the CO2 emissions from the combustion of low sulphur fuel oil (LSFO) associated with the two crude distillation units of the refinery and which is responsible for around 21% of the refinery's emissions. The third refinery case, called “Refinery FCC”, is based on capture from two fluid catalytic cracker units of the refinery and represents 11.5% of the refinery's emissions. The cement case is based on CO2 capture from the flue gas of a cement plant with a clinker capacity of 3000 tonne per day as defined by the CEMCAP EU project.30 Finally, the steel case is based on CO2 capture from the hot stoves and power plant flue gases of a steel mill producing annually 4 million tons of hot rolled coil (HRC) as defined by the IEAGHG.31 These two sources are the largest CO2 emitting units of the steel mill, and produce 67% of the steel mill emissions. The coal-fired power plant case is based on CO2 capture from the exhaust flue gas of an advanced SuperCritical pulverized fuel power plant with a net power output of 754 MWe without CCS as presented in the European Benchmarking Task Force report.32
000 barrel per stream day (BPSD).29 The first case, called “Refinery FG”, considers CO2 capture of the CO2 emissions of the combustion of sweet refinery off-gas associated with the two catalytic reformers of the refinery and accounts for around 10% of the emission of the refinery. The second refinery case, called “Refinery LSFO”, considers capture of the CO2 emissions from the combustion of low sulphur fuel oil (LSFO) associated with the two crude distillation units of the refinery and which is responsible for around 21% of the refinery's emissions. The third refinery case, called “Refinery FCC”, is based on capture from two fluid catalytic cracker units of the refinery and represents 11.5% of the refinery's emissions. The cement case is based on CO2 capture from the flue gas of a cement plant with a clinker capacity of 3000 tonne per day as defined by the CEMCAP EU project.30 Finally, the steel case is based on CO2 capture from the hot stoves and power plant flue gases of a steel mill producing annually 4 million tons of hot rolled coil (HRC) as defined by the IEAGHG.31 These two sources are the largest CO2 emitting units of the steel mill, and produce 67% of the steel mill emissions. The coal-fired power plant case is based on CO2 capture from the exhaust flue gas of an advanced SuperCritical pulverized fuel power plant with a net power output of 754 MWe without CCS as presented in the European Benchmarking Task Force report.32
Recent literature shows that lower CCRs can significantly decrease the CO2 avoidance cost of membrane-based CO2 capture,28 while solvent-based capture is often considered to be more cost-effective at CCR above 90%.30 Hence, the influence of CCR on the membrane properties required for cost-competitive CO2 capture must be taken into account to assess the full potential of membrane-based CO2 capture. The common 90% CCR assumption is therefore treated as the base case in this work, while the membrane processes are also evaluated for CCRs between 50–90% to identify the cost-optimal operating point and cost-reduction potential. It is worth noting that CCRs below 50% are not considered as it is assumed that a certain scale of each capture unit is needed to make CCS projects worthwhile and impactful.
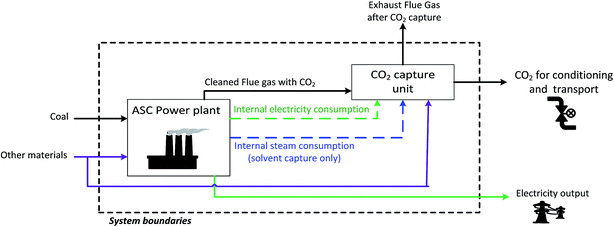
Finally, two sets of system boundaries are considered as shown in Fig. 2 and 3. In the case of the industry cases, it is not necessary to include the industrial plant in the assessment, as the implementation of CCS does not affect the plant production.33 Therefore, in these cases, the assessment starts when the cleaned flue gas from the CO2 source is sent to the CO2 capture unit, where CO2 is removed from the flue gas using a membrane-based or MEA-based process. The captured CO2, with a purity of at least 95%, is then sent for conditioning and pipeline export,34,35 while the rest of the flue gas is vented. Meanwhile, in the case of the coal power plant, as the electricity and steam consumed by the CO2 capture unit are produced by the power plant, the power plant needs to be included in the system boundaries, as shown in Fig. 3.
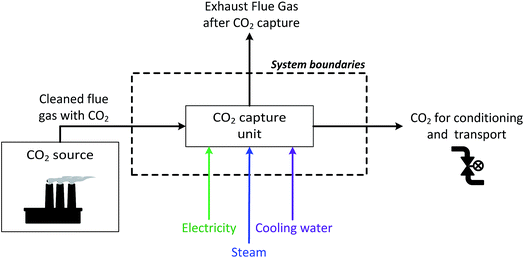 | ||
| Fig. 2 Schematic view of the system boundaries for the industrial cases.§ | ||
2.2 Technical modelling of CO2 capture technologies
 | ||
| Fig. 4 Principal layout of the stage-wise membrane separation process for a two stages system.¶ | ||
The membrane module is modelled as a binary component separator in cross-flow configuration with negligible mixing on the permeate side.36 Change of composition along the feed side of the membrane is taken into account but pressure drops on either side of the membrane are neglected. The use of a binary component model is justified by the fact that the vast majority of experimental and evaluation work has been done on binary (CO2/N2) mixtures and very often reports only this selectivity.6,7,36 While there are a few studies considering multi-component gas mixtures,37,38 it is beyond the scope of this work to try to extrapolate these results to membranes with vastly different properties. Oxygen and minor components are lumped together with nitrogen. Rotating equipment are set as isentropic expansion or compressions of an ideal gas combined with an isentropic efficiency of 80%. The assumption of negligible pressure drops on each membrane side is a common one,36 although admittedly restrictive. This is particularly true on the permeate side where even a small pressure drop will incur a large change in absolute pressure due to the lower permeate side pressure (typically vacuum conditions**). It should be noted that the pressure drop is intrinsically linked to the membrane module design and manufacturing (e.g. length of hollow fibres and the flow pattern), and this information is rarely available for membranes in the research stage. Additionally recent studies have shown that membrane module selectivity is not a constant as is usually considered in estimating membrane system performance in literature.38,39 In light of this, the results of this work should be interpreted as the general trend of required module membrane performance required to compete with MEA.
To identify the range membrane properties required for membrane-based process to be cost-competitive with post-combustion MEA-based CO2 capture, membrane properties in the following ranges are evaluated: 5 to 200 for CO2/N2 selectivity and 0.25 to 15 m(STP)3 (m2 h bar)−1 in terms of CO2 permeance.†† The membrane separation process (number of stages and operating conditions for each stage) is optimised for each combination of selectivity and permeance according to the attainable region approach. The methodology and numerical model, previously described and illustrated in detail,12,24,25,28 minimise the CO2 avoided cost by considering the detailed investment and operating costs of a membrane-based process rather than focusing only on energy efficiency. More details on the membrane process design and characteristics resulting from the approach used here are illustrated in previously published studies.25,40 This model optimises and assesses the CO2 avoided cost of the membrane process for each of the six cases, the 2400 combinations of membrane properties, and the CO2 capture ratios considered. The cost results obtained are finally compared with the reference MEA-based capture technology to identify which combination of properties would lead to a cost-competitive membrane process.
In the MEA-based process, the exhaust flue gas is first pressurised to compensate the pressure drops inherent to the process. The exhaust is then cooled through a direct contact cooler before passing through a packed absorption column, in which the CO2 present in the flue gas is absorbed in a 30% wt MEA aqueous solvent. While the absorbed CO2 is recovered chemically bound to the solvent at the bottom of the absorber (CO2-rich solvent), the flue gas after absorption also goes through a water-wash packing section in order to limit water and solvent makeups, as well as solvent emissions to the atmosphere. Meanwhile, the CO2-rich solvent is pumped and pre-heated to 120 °C through a heat exchanger by the regenerated lean solvent, before being sent to the top of the stripper. In order to break the chemical bound between the CO2 capture and solvent as well as maintain the regeneration in the stripper, a significant amount of heat is provided to the stripper by a reboiler. The vapour from the stripper is then cooled to separate water, while the purified CO2 is sent to conditioning and transport. Finally, the lean solvent recovered at the bottom of the stripper is cooled through the heat exchanger and a cooler to enhance the absorption process before being pumped back to the top of the absorber.
It is important to note that the steam required in the regeneration process can be provided by various means.30 Here, in order to represent the most representative scenarios in each case, the steam required by the stripper is assumed, in the power plant case, to correspond to low pressure steam extracted the power plant, while it is assumed to be provided by natural gas boilers in the industrial cases (Fig. 5).
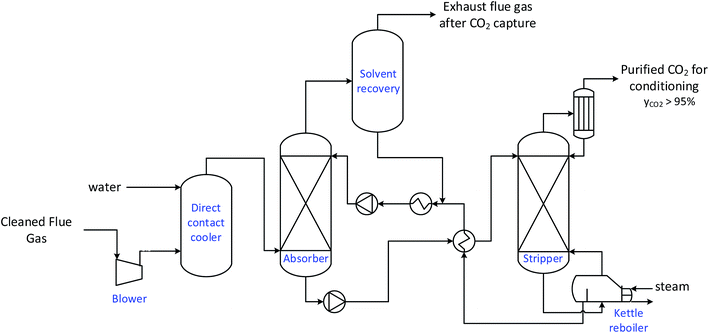 | ||
| Fig. 5 Layout of the MEA-based CO2 capture process.42 | ||
More information on the details of the MEA-based process considered can be found in previously published studies.41,42
2.3 Cost evaluation methodology
The cost estimates used and generated in this study are developed to be representative of Nth of a kind plants and are given in 2014 Euro prices. The investment cost data not directly available in 2014 prices are updated following the Chemical Engineering Plant Cost Index43 and the European Power Capital Costs Index excluding nuclear power‡‡44 for the capture processes and the power plant respectively, while the utilities costs are updated based on an average annual inflation rate of 1.7%.12| Parameter | Value |
|---|---|
| Compressor (first stage) [€ per kW] | 920 |
| Compressor (second stage) [€ per kW] | 510 |
| Expander [€ per kW] | 570 |
| Vacuum pump [€ per kW] | 800 |
| Cooler [€ per m2] | 370 |
| Membrane module [€ per m2]36 | 40 |
| Reference module cost [k€] | 286 |
| Reference module area [m2] | 2000 |
| Reference pressure [bar] | 55 |
It is worth noting that for membrane-based capture, regressed linear direct cost functions (see Table 2) are used for each item of equipment12 as the numerical membrane model optimises the process to minimise the overall costs.
 | (1) |
The variable operating costs cover consumption of utilities such as water, electricity, steam and solvent make-up, and are based on the estimated consumptions of utilities and the cost data shown in Table 3. In practice, it is important to note that the cost of some utilities, such as electricity, steam and cooling are expected to differ between the industrial cases and the power generation case.
| Case | Industrial cases | Coal power plant case |
|---|---|---|
| a Estimated based on the cost of cooling towers and a water makeup of 3% at a cost of 0.39 € per m3water makeup. | ||
| Purchased electricity cost [€ per MWh] | 58.1 (ref. 30) | — |
| LCOE of the power plant without CCS [€ per MWh] | — | 63.3 (ref. 12 and 32) |
| Climate impact of electricity [gCO2 per MWh] | 306.4 (ref. 30) | 763 (ref. 32) |
| Steam cost [€ per GJ] | 7 (ref. 30) | — |
| Climate impact of steam [kgCO2 per GJ] | 56.9 (ref. 30) | — |
| Cooling water supply | Seawater cooling | Cooling tower |
| Cooling water temperature increase constrain [°C] | 10 | 10 |
| Cooling water cost [€ per m3] | 0.025 (ref. 41) | 0.21a |
| MEA make-up cost [€ per kgMEA] | 1300 (ref. 32) | 1300 (ref. 32) |
In the industrial cases, electricity is expected to be purchased from the European grid, while steam is assumed to be produced by a natural gas boiler at the industrial site.30 It is worth noting that in practice different steam supply scenarios (in terms of source, cost and climate impact) for solvent regeneration may be achievable and would hence impact the cost of solvent based CO2 capture as illustrated in Roussanaly et al.30 Optimal steam supply scenarios for solvent-based capture is however highly specific to combination of type of industry, production process, local characteristics and are therefore not considered in the present work.
However, in the power generation case, the electricity and steam consumptions associated with CO2 capture decrease the net power output of the plant. Therefore, in such a case, the CO2 capture need to be optimised and assessed taking into account its impact on the levelised cost of electricity (LCOE) and climate impact of the power plant, as described in detail previously.12
For the power generation case, as the cost of electricity is an output of the power plant with CCS design,33 the CO2 capture cost needs to be calculated according to the equation presented by Rubin46 and shown in eqn (2).
 | (2) |
• (LCOE)CCS and (LCOE)ref are the LCOEs of the plant with and without CCS [€ per MWh].
• (tCO2 per MWh)CCS and (tCO2 per MWh)ref are the CO2 emission rate of the plant with and without CCS [tCO2 per MWh].
For the industrial cases, the CO2 capture cost can be calculated by dividing the annualised costs of capture by the annualised amount of CO2 avoided (see eqn (3)).33 The annualised amount of CO2 avoided is defined as the amount of CO2 captured minus the direct CO2 emissions associated with the steam and electricity consumption of the CCS infrastructure. Including the direct CO2 emissions is especially important as the direct CO2 emissions associated with steam and electricity consumption can significantly vary between the two capture technologies.40
 | (3) |
In both cases, the CO2 capture cost is calculated for a discount rate of 8% and an economic lifetime of 25 years.32 In addition, the investment costs assume that construction is spread over a three-year period (with a 40/30/30 allocation).32
3 Results
3.1 Performances of the reference capture technology
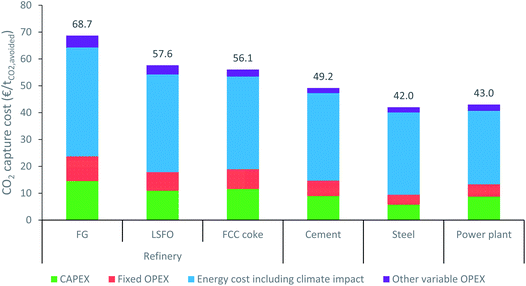
In order to validate the results of the reference MEA-based capture process before comparing the two CO2 capture technologies, the technical and cost performances of the reference technology (MEA-based CO2 capture) are presented here for a 90% CCR. While the main technical performances of this capture process can be found in Table 4 for the different cases considered, the CO2 capture cost and its breakdown are displayed in Fig. 6. When looking at the different cases, the cost evaluation shows that the CO2 capture cost varies between 69 and 42 € per tCO2,avoided. It is worth noting that these numbers may appear to be slightly lower than those often presented in the literature47,48 as the cost of conditioning before transport, which typically adds around 10 € per tCO2,avoided,35 are not included. As observed in the literature,42,49 the CO2 capture cost decreases non-linearly as the CO2 concentration increases.|||| This decrease is due to a reduction in both steam and electricity consumption, as well as a reduction in investment costs, and therefore fixed operating cost, with the CO2 concentration in the flue gas. Furthermore, as is frequently illustrated in the literature,30,42,47 the cost of energy consumption is the main contributor (60–75%) to the CO2 capture cost.| Parameter | Refinery | Cement plant | Steel plant | Coal power plant | ||
|---|---|---|---|---|---|---|
| FG | LSFO | FCC | ||||
| Wet feed flue gas mass flow [twet h−1] | 282 | 484 | 216 | 348 | 1965 | 2706 |
| CO2 concentration [%wet,vol] | 8.1 | 11.3 | 16.6 | 20.2 | 27.2 | 14.6 |
| Electricity consumption [kWh per tCO2,captured] | 35.8 | 26.0 | 18.0 | 14.9 | 11.3 | 21.6 |
| Steam consumption [GJ per tCO2,captured] | 3.46 | 3.35 | 3.26 | 3.22 | 3.18 | 3.3 |
| MEA make-up [kgMEA per tCO2,captured] | 1.83 | 1.37 | 0.99 | 0.85 | 0.68 | 1.16 |
| CO2 capture cost [€ per tCO2,avoided] | 68.7 | 57.6 | 56.1 | 49.2 | 42.0 | 43.0 |
Regarding the coal power plant case, it is worth noting that the CO2 capture cost obtained is significantly below than those of the industrial cases in the same range of CO2 concentrations. The main reason for this discrepancy is linked to the lower steam cost in the power plant case. Suitable steam is available in coal power plants at a significantly lower production cost than in an industrial plant.30 This lower cost of steam is estimated to reduce the CO2 capture cost in the power plant by approximately 13 € per tCO2,avoided compared to a case in which the steam would be produced by natural gas boiler. Due to this variation in steam production cost, the coal power plant can be expected to advantage CO2 capture technologies which require steam, like solvent-based capture, while the industrial cases can be expected to be more suited to CO2 capture technologies which do not require steam, like membranes.
3.2 Comparison of capture technologies at 90% CO2 capture ratio
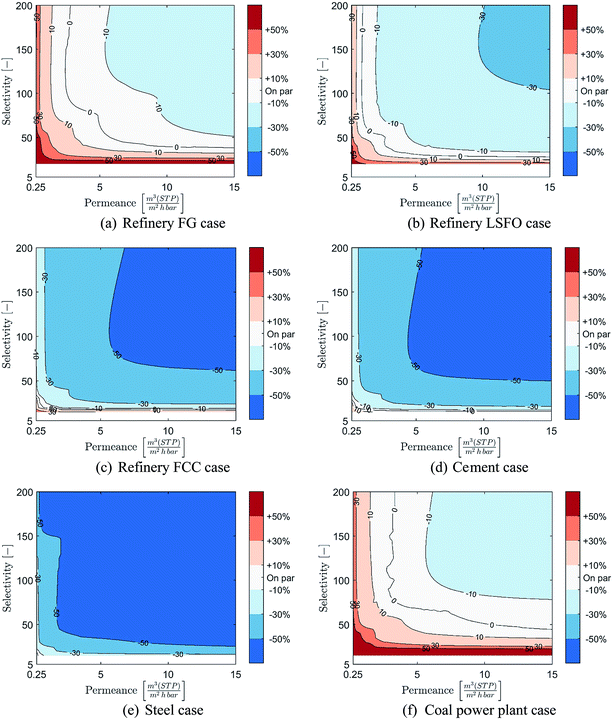
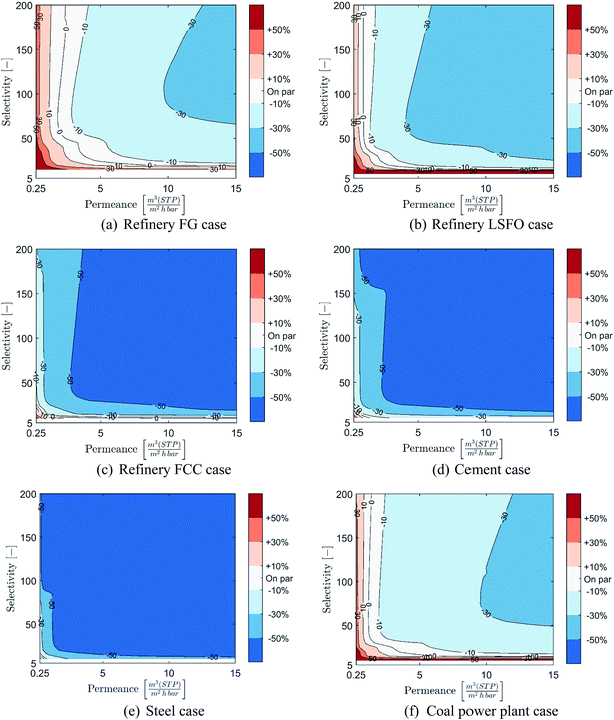
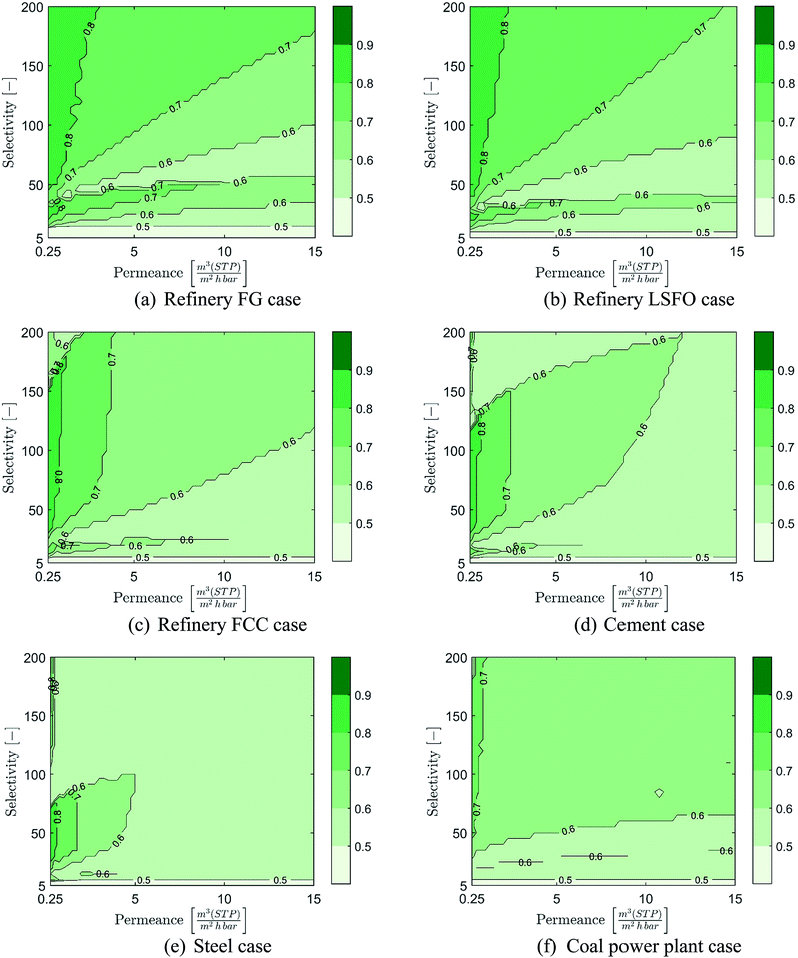
Costs of membrane-based CO2 capture compared to post-combustion MEA-based capture at 90% CCR is presented in Fig. 7 over the range of considered membrane properties and for the six cases considered. As a wide range of membrane properties are evaluated, membrane permeance and selectivity are displayed using the X- and Y-axis while the relative cost is represented using colour coded areas (see colour bar in figure). In these graphical representations, the bluer the combination of membrane properties is, the more cost-competitive the membrane-based capture is. In contrast, the redder the combination of membrane properties is, the more cost-competitive MEA-based capture is. It is worth noting that due to potential changes in the number of stages between combinations of membrane properties, coarse separation between areas may be obtained.In the refinery fuel gas case, the results displayed in Fig. 7(a) show that only a narrow range of membrane properties can result in a process cost-competitive with MEA-based capture, and that the potential cost reduction remains limited. Indeed, permeances of at least 2.5 m(STP)3 (m2 h bar)−1 with high selectivity or selectivities of at least 40 with high permeance are required for membrane-based capture to become cost-competitive with MEA-based capture. Furthermore, the cost reduction potential of membrane-based capture remains below 30%, even for membranes with both high permeance and high selectivity.
However, as the concentration of CO2 in the flue gas increases, the range of membrane properties which can result in a cost competitive process compared to MEA-based capture expands rapidly and a significant cost-reduction can be achieved, as illustrated in Fig. 7(b) to (e). This is especially true for the refinery FCC, cement and steel cases, in which a very wide range of membrane properties can achieve large cost reductions in CO2 capture costs compared to an MEA-based process. Indeed, in both the refinery FCC and cement cases, permeances as low as 1 m(STP)3 (m2 h bar)−1 with medium to high selectivities or selectivities as low as 25 with medium to high permeance can result in membrane-based processes able to achieve at least 30% cost reduction compared to MEA. In these two cases, membrane-based processes can achieve cost reductions beyond 50% for membrane permeances higher than 4.5–6 m(STP)3 (m2 h bar)−1 and selectivities higher than 50–60. For the steel case, the cost comparison shows that the vast majority of combinations of membrane properties can achieve cost reduction in CO2 capture cost beyond 50%.
Meanwhile, for the coal power plant case, a more limited range of membrane properties results in processes capable of competing with MEA-based capture, and limited cost reductions can be achieved. Indeed, due to the lower cost of steam in this case, the MEA-based process has an advantage over a membrane process. The evaluation shows that to reach competitiveness, permeances higher than 3 m(STP)3 (m2 h bar)−1 with medium to high selectivities or selectivities higher than 45 with medium to high permeances are required. However, reductions in CO2 capture cost between 10 and 30% can be achieved with permeances higher than 6 m(STP)3 (m2 h bar)−1 with high selectivity or selectivities higher than 80 with high permeances.
Overall, at 90% CCR, the results show that membrane-based capture have a strong potential to be competitive and provide good cost-reduction potential for industrial cases with CO2 content above 11%. Moreover, the higher the CO2 content, the wider the range of membrane properties which can result in a cost-competitive process and the stronger the cost-reduction potential is. However, as shown through the coal power plant case, the cost of steam production can have a significant impact on the range of membrane properties required to reach competitiveness.
4 Discussions
4.1 Comparison of capture technologies at optimal CO2 capture ratios
Although the long-term goal of carbon capture and storage is to achieve CCRs of at least 90% in order to significantly reduce the climate impact of industry and power generation sources, considering lower CCRs in early deployment stages could reduce implementation costs in terms of both absolute and normalised costs. This is especially the case for membrane-based CO2 capture as highlighted by recent literature.7,27,28,50 It is therefore important to investigate the impact of considering CCRs below 90% on the range of membrane properties required to compete with MEA-based CO2 capture. As solvent-based capture does not benefit from lower CCRs, the cost of membrane-based capture at cost-optimal CCRs is compared (in € per tCO2,avoided) to the CO2 capture cost capture cost of MEA-based capture at 90% CCR. It is worth noting that, in the case of membrane-based CO2 capture, the cost-optimal CCR and associated cost reductions compared to 90% CCR are highly dependent on the membrane properties and the specific case being considered.28The costs of membrane-based CO2 capture at optimal CCRs compared to MEA-based capture are displayed in Fig. 8 over the range of membrane properties considered earlier and for the six cases considered. The optimal CCRs of the membrane process and associated cost-reduction for the different membrane properties are presented in Appendix A. The results show that considering CCRs lower than 90% can significantly benefit membrane-based CO2 capture. Lower CCRs greatly increase the range of membrane properties which can result in processes that are cost-competitive with MEA-based capture, as well as offering opportunities for major reductions in costs. Indeed, in all six cases, the vast majority of membrane properties would result in capture processes which can be cost-competitive with MEA-based capture. Furthermore, for the industrial cases with CO2 concentrations above 11% (refinery fuel oil, refinery FCC, cement and steel cases), most of the membrane properties can result in capture processes that are capable of achieving at least 30% cost reduction compared to MEA-based capture. This cost reduction potential is even stronger in cases with a CO2 concentration higher than 16% (refinery FCC, cement and steel cases), as most of the membrane properties can achieve a cost reduction greater than 50%.
For the coal power plant case, considering CCRs lower than 90% can also significantly increase the potential of membrane-based CO2 capture, as shown in Fig. 8(f). However, due to the low CO2 capture cost of the MEA process in this case, only limited cost savings can be achieved with membrane-based capture, unless membranes with high permeances and medium to high selectivity are used.
All in all, these results show that considering CCRs lower than 90% for membrane-based CO2 capture can significantly increase its cost-competitiveness compared to MEA-based capture, as both a wide range of membrane properties can be considered and significant cost reduction can be achieved. Hence, in the early stages of deployment, considering membrane-based CO2 capture with CCRs below 90% may be a good strategy for kick-starting large-scale CCS deployment, especially from industrial CO2 sources, at both low absolute and normalised costs. Furthermore, although this is not investigated here, hybrid processes based on the combination of membrane and another technology (absorption, low-temperature…)51,52 could further increase the potential of membrane for CO2 capture.
4.2 Material perspective
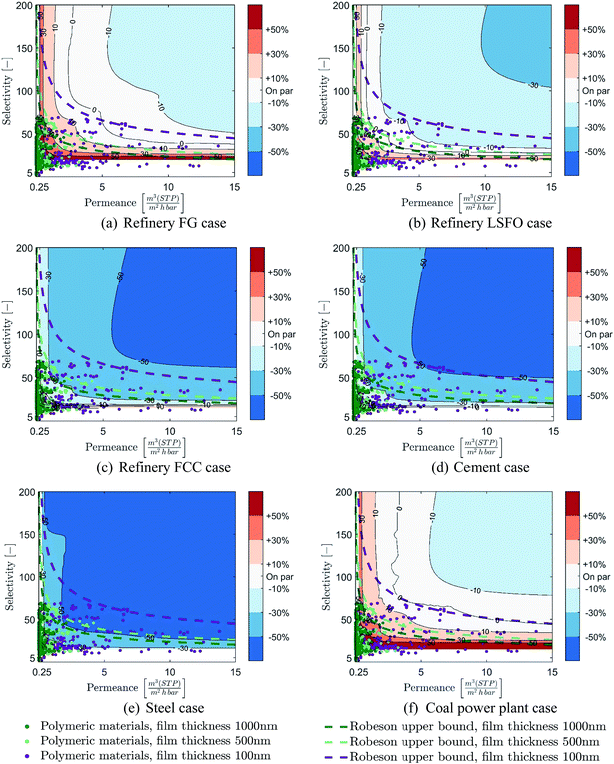
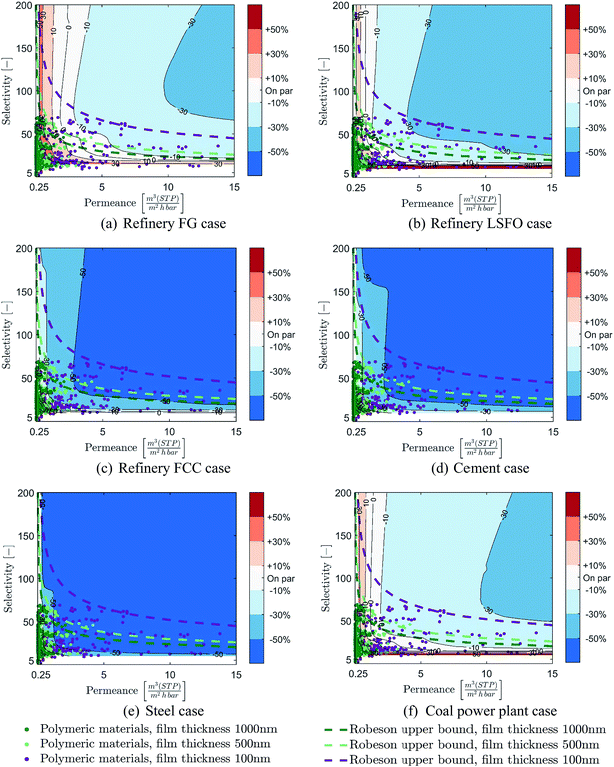
This section illustrates how the membrane properties targets identified in Sections 3.2 and 4.1 are used to identify polymeric materials which could be used to develop membranes with high potential for CO2 capture from industry and power generation. Here, the focus is set on diffusion-based polymeric materials, since relevant material properties (selectivity and permeability) have been reported in the literature for a large number of materials. Focusing on the material properties gathered by Powell et al.53 and Scholes et al.,54 401 diffusion-based polymeric materials are evaluated in this paper.*** Furthermore, the Robeson upper bound approach,55 which links the maximum selectivity which can be achieved for a given permeability, is also evaluated in order to assess the full potential of diffusion-based membranes.††† As both the material data and the upper bound approach refer to permeability, which is a material characteristic, rather than permeance, which is a membrane module characteristic, the thickness of the polymeric material layer needs to be assumed.‡‡‡ Three thicknesses are evaluated in order to represent both state-of-the art and thicknesses that are normally achievable by membrane development experts:56,57 100 nm, 500 nm and 1 μm. Membrane thicknesses below 100 nm are not considered in this work. Indeed, the permeance and selectivity of thin films (below 100 nm) can be difficult to predict as they depend on the selective layer thickness, as well as the characteristics of the support and gutter layers of the membrane,58 and may not follow the same trend as well-known thick films.59The achievable membrane properties of the 401 polymeric materials and the Robeson upper bound are plotted in Fig. 9 and 10 against the membrane properties targets obtained in all six cases considered at both 90% CCR and cost-optimal CCRs. Table 5 also presents the number of materials which can result in a cost-competitive membrane process depending on different cost-reduction levels, constraints regarding minimum thickness, and CCR scenarios. First, it is worth noting from the distribution of the data that most of the materials result in very low membrane permeance, below 0.75 m(STP)3 (m2 h bar)−1, even when a very thin membrane layers are investigated.
| Cost reduction compared to MEA [%] | Thickness constraint [nm] | Refinery FG | Refinery LSFO | Refinery FCC | Cement plant | Steel plant | Coal power plant | ||||||
|---|---|---|---|---|---|---|---|---|---|---|---|---|---|
| 90% CCR | Optimal CCR | 90% CCR | Optimal CCR | 90% CCR | Optimal CCR | 90% CCR | Optimal CCR | 90% CCR | Optimal CCR | 90% CCR | Optimal CCR | ||
| ≥0% | ≥100 | 9 | 43 | 39 | 67 | 123 | 211 | 154 | 241 | 229 | 262 | 2 | 62 |
| ≥500 | — | 3 | 4 | 18 | 59 | 84 | 64 | 98 | 110 | 129 | — | 17 | |
| ≥1000 | — | — | — | 3 | 43 | 52 | 46 | 60 | 66 | 77 | — | 4 | |
| ≥10% | ≥100 | — | 25 | 18 | 53 | 96 | 180 | 110 | 211 | 228 | 260 | — | 44 |
| ≥500 | — | — | — | 4 | 51 | 64 | 55 | 80 | 109 | 123 | — | 4 | |
| ≥1000 | — | — | — | 3 | 33 | 42 | 41 | 50 | 66 | 72 | — | 1 | |
| ≥30% | ≥100 | — | — | — | 14 | 50 | 92 | 60 | 116 | 100 | 203 | — | — |
| ≥500 | — | — | — | — | 11 | 29 | 13 | 36 | 47 | 70 | — | — | |
| ≥1000 | — | — | — | — | 3 | 9 | 3 | 12 | 28 | 37 | — | — | |
| ≥50% | ≥100 | — | — | — | — | — | 36 | 4 | 46 | 40 | 89 | — | — |
| ≥500 | — | — | — | — | — | 3 | — | 4 | 3 | 21 | — | — | |
| ≥1000 | — | — | — | — | — | — | — | — | 1 | 4 | — | — | |
For the 90% CCR evaluation, the comparisons show that for the refinery fuel gas, the refinery fuel oil and the coal power plant cases, only a limited number of materials can result in a cost-competitive process and that very thin membrane layers would be required. This trend is confirmed through the Robeson upper bound lines, which show that even with thin membrane thicknesses, only limited cost reductions can be achieved. However, for the refinery FCC, cement and steel cases, the results show that a large proportion of the polymeric materials evaluated could result in cost-competitive membrane-based capture even with thick membrane layers. The Robeson upper bound lines similarly indicate that significant cost reduction could be achieved even with thick membrane layers.
When considering the potential of CCRs lower than 90%, the comparisons show that a large number of polymeric materials can result in cost-competitive membrane processes. Indeed, except for the refinery fuel gas case, a significant share of the materials evaluated can result in cost-competitive processes even when only thick membrane layers are considered. Furthermore, comparison of the Robesson upper bound lines with the colour area shows that significant cost reduction compared to MEA-based capture could be reached with diffusion-based materials, especially if thin membrane layers can be achieved. It is worth noting that the Robeson upper bound lines show that for the refinery FCC, cement and steel cases, cost reductions stronger than 30% could be achieved with diffusion-based materials, even with if only thick membrane layers can be achieved.
All in all, the comparison of membrane materials with the properties targets make it clear that a large proportion of the materials evaluated could result in cost-competitive membrane processes and even reduce the cost of CO2 capture, especially for the refinery FCC, the cement and steel cases, and/or if CCRs lower than 90% are considered. In addition, the Robeson upper bound approach demonstrates that developing thin membrane layers are important to exploit the potential for cost reduction. Furthermore, the combination of the properties targets approach and the material perspective is used to identify promising materials for post-combustion membrane-based CO2 capture. In order to provide support for membrane development, a list of 73 materials identified to have the most potential§§§ are presented in Appendix B. Additionally, the maximum thickness requirements to reach different levels of cost-reduction potential compared to MEA-based capture are provided in ESI† for all materials, cases and CCR scenarios considered. These lists could be used by membrane development experts to identify materials worthy of further development once both thickness constraint and practical considerations (such as mechanical resistance, stability over time, etc.) are taken into account. It is worth noting that literature shows that, in practice, some of these high-potential materials identified are already being considered by membrane development experts with promising results.60–64
5 Conclusions
In order to significantly decrease the cost of CO2 capture, the combined development of advanced capture technologies and better materials is required. For membrane-based CO2 capture, one of the most promising emerging capture technologies, this means developing “good” membrane modules and materials. While this is traditionally done through incremental development of existing and new materials, this paper presents a new approach to identify membrane materials with a disruptive potential to reduce the cost of CO2 capture for six potential industrial and power generation cases.For each of the cases considered, this approach first identifies the membrane properties targets required to reach cost-competitiveness and different cost-reduction levels compared to MEA-based CO2 capture, through the evaluation of a wide range of possible membrane properties. These membrane properties targets give an idea of the potential of membrane-based CO2 capture for the cases considered, as well as the impact of important parameters such as the CO2 capture ratio. In the cases considered here, the obtained ranges of membrane properties target show the strong potential of membrane-based capture for industrial cases with CO2 content in the flue gas above 11%, and that considering CO2 capture ratios lower than 90% significantly increases the competitiveness of membrane-based capture and leads to significant cost reduction potential.
The membrane properties targets are then used to identify materials with a strong potential for membrane-based CO2 capture. In the present paper, focus was on 401 polymeric materials whose characteristics have been reported in the literature. Based on these material properties, membrane module performances which could be theoretically achieved are evaluated and compared to the identified membrane properties targets, to highlight materials with the greatest potential. This approach results in a list of 73 high-potential materials which can be used by membrane development experts to select materials worth promoting for further development once practical development considerations are taken into account.
In practice, the approach presented here can also be used to evaluate the potential of other membrane materials (for example, novel glassy polymers or mixed matrix membranes) as the present study considers only a fraction of all possible membrane materials,65,66 but can also be adapted to other types of CO2 capture technologies, such as solvent-based capture or adsorption-based capture, and extended to different applications (biogas upgrading, hydrogen purification, air separation, acid gas removal, etc.). Adopting such approaches could help to reduce both the cost and time required to develop a technology and therefore contribute to attain commercially viable CO2 capture technologies.
Appendix A: cost-optimal CCRs and associated cost reductions when considering lower CCRs
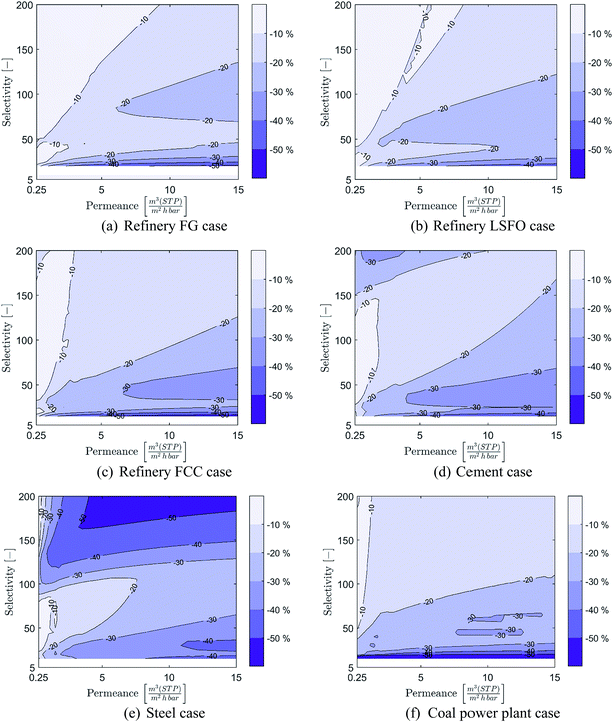
The cost reductions in the membrane process achieved by considering lower CCRs are presented in Fig. 11, while the associated cost-optimal CCRs are presented in Fig. 12 for the six cases evaluated in this study.Appendix B: list of polymeric materials identified to have the most potential for membrane module development
The list of 73 polymeric materials identified to have the most potential for membrane module development is presented in Table 6.| Polymeric material name | CO2/N2 selectivity [—] | CO2 permeability [Barrer] |
|---|---|---|
| a Here defined as having the potential to lead to a membrane process at least 30% cheaper than MEA-based capture for at least one of the cases considered even when only membrane layer above 1μm are considered. | ||
| Poly(trimethyl-prop-1-ynyl-silane) | 17.4 | 28 |
| Poly(3,3-dimethyl-but-1-yne) | 10.6 | 19![[thin space (1/6-em)]](https://www.rsc.org/images/entities/char_2009.gif) 000 000 |
| EO/EM/AGE (80/20/2) | 55 | 13.0 |
| EO/EM/AGE (77/23/2.3) | 46 | 773 |
| EO/EM/AGE (96/4/2.5) | 44 | 680 |
| TMeCat–durene | 27 | 67 |
| TMMPD | 19.6 | 114 |
| 6FDA–FDA/HFBAPP (1/1) | 17.8 | 24.5 |
| PI-3 | 22.9 | 32 |
| PI-5 | 25.8 | 62 |
| PMDA–APPS/PEO3(80) | 50 | 99 |
| PMDA–mPD/PEO4(80) | 53 | 136 |
| PMDA–ODA/PEO4(80) | 52 | 151 |
| PMDA–pDDS/PEO4(80) | 52 | 167 |
| NTDA–BDSA(30)/CARDO | 41 | 70 |
| 6FDA–FDA/HFBAPP (1/1) | 52 | 5.2 |
| DM14/MM9 (70/30) | 66 | 96 |
| DM14/MM9 (50/50) | 36 | 195 |
| DM14/MM9 (50/50) | 64 | 144 |
| DM14/MM9 (30/70) | 36 | 260 |
| DM14/MM9 (30/70) | 63 | 210 |
| DB30/MM9 (100/0) | 63 | 93 |
| DB30/MM9 (90/10) | 64 | 105 |
| DB30/MM9 (70/30) | 36 | 210 |
| DB30/MM9 (70/30) | 67 | 141 |
| DB30/MM9 (50/50) | 35 | 270 |
| DB30/MM9 (50/50) | 62 | 179 |
| DB30/MM9 (30/70) | 34 | 330 |
| DB30/MM9 (30/70) | 60 | 250 |
| DM23/MM9 (90/10) | 38 | 51 |
| DM23/MM9 (90/10) | 66 | 145 |
| DB69/MM9 (90/10) (cooling) | 34 | 27 |
| DB69/MM9 (90/10) (cooling) | 56 | 240 |
| DB69/MM9 (90/10) (heating) | 62 | 98 |
| DM14/MM23 (30/70) (cooling) | 35 | 400 |
| DM14/MM23 (30/70) (cooling) | 62 | 240 |
| DM14/MM23 (30/70) (heating) | 35 | 420 |
| Matrimid 5218 | 62 | 250 |
| Matrimid 5218, 1 day cross-linking | 25.6 | 6.5 |
| Matrimid 5218, 3 days cross-linking | 25.6 | 7.4 |
| Matrimid 5218, 7 days cross-linking | 25.2 | 6.0 |
| Matrimid 5218, 14 days cross-linking | 24.6 | 5.1 |
| Matrimid 5218, 21 days cross-linking | 24.1 | 4.7 |
| Matrimid 5218, 32 days cross-linking | 22.2 | 3.4 |
| 6FDA–durene, 5 min cross-linked | 15 | 1.9 |
| 6FDA–durene, 10 min cross-linked | 12.3 | 136 |
| 6FDA–durene, 15 min cross-linked | 14.1 | 91.8 |
| 6FDA–durene, 30 min cross-linked | 11.6 | 70 |
| 6FDA–durene, 60 min cross-linked | 10.6 | 30.3 |
| Poly(phenyl oxide) | 5.35 | 2.1 |
| Poly(phenyl oxide)–nylon (20%) | 14.4 | 61 |
| Poly(phenyl oxide)–nylon (20%) with PSMA (2 wt%) as compatibilizer | 16.15 | 24.8 |
| Poly(phenyl oxide)–nylon (20%) with PSMA (4 wt%) as compatibilizer | 38.7 | 12 |
| Poly(phenyl oxide)–nylon (20%) with PSMA (6 wt%) as compatibilizer | 35.87 | 17 |
| Polyvinyl acetate | 27.43 | 12.9 |
| Polyvinyl acetate with 15pph zeolite 4A | 34.7 | 3.1 |
| Polyvinyl acetate with 20pph zeolite KFI | 30.7 | 2.4 |
| Polyvinyl acetate with 15pph zeolite H-ZK-5 | 53.6 | 4.9 |
| Polyvinyl acetate with 15pph zeolite Na-SSZ-13 | 41 | 4.9 |
| Polyvinyl acetate with 15pph zeolite SAPO-34 | 41.7 | 4.5 |
| Polyvinyl acetate with 15pph zeolite SAPO-44 | 44.4 | 4.4 |
| Silicone rubber | 51.8 | 4.9 |
| Silicone rubber with polyethylene glycol particles | 11 | 14.3 |
| Silicone rubber with activated carbon particles | 42 | 4.9 |
| Silicone rubber with polyethylene glycol and activated carbon particles | 15 | 29.4 |
| Silicone rubber with activated carbon and carbonate particles | 47 | 24.2 |
| Silicone rubber with PEG + activated carbon and carbonate particles | 20.1 | 16.2 |
| Polysulfone | 40.5 | 14.3 |
| MCM41/polysulfone | 24.8 | 4.5 |
| MCM41/polysulfone with mesoporous silica 30% wt additive | 25.3 | 7.6 |
| Amine-MCM41/polysulfone with mesoporous silica 20% wt additive | 23.4 | 22.9 |
| MCM48/polysulfone with mesoporous silica 10% wt additive | 29 | 7.3 |
| MCM48/polysulfone with mesoporous silica 20% wt additive | 26.4 | 8.5 |
Conflicts of interest
There are no conflicts to declare.Abbreviations
| BPSD | Barrels per stream day |
| CAPEX | Capital expenditures |
| CCR | CO2 capture ratio |
| CCS | Carbon capture and storage |
| FCC | Fluid catalytic cracker |
| FG | Flue gas |
| GHG | Greenhouse gas |
| HRC | Hot rolled coil |
| LSFO | Low sulphur fuel oil |
| MEA | Mono-ethanolamine |
| OPEX | Operating expenditures |
| TDC | Total direct costs. |
Acknowledgements
This publication has been produced with support from the BIGCCS and NCCS Centres, performed under the Norwegian research program Centres for Environmentally-friendly Energy Research (FME). The authors acknowledge the following partners for their contributions: Aker Solutions, ANSALDO Energia, CoorsTek Membrane Sciences, Gassco, KROHNE, Larvik Shipping, Norcem, Norwegian Oil and Gas, Quad Geometrics, Shell, Statoil, TOTAL, ENGIE and the Research Council of Norway (193816/S60 and 257579/E20).References
- International Energy Agency, 20 years of Carbon Capture and Storage: Accelerating future deployment, 2016 Search PubMed.
- P. Markewitz, W. Kuckshinrichs, W. Leitner, J. Linssen, P. Zapp, R. Bongartz, A. Schreiber and T. E. Muller, Worldwide innovations in the development of carbon capture technologies and the utilization of CO2, Energy Environ. Sci., 2012, 5, 7281–7305 CAS.
- M. E. Boot-Handford, J. C. Abanades, E. J. Anthony, M. J. Blunt, S. Brandani, N. Mac Dowell, J. R. Fernandez, M.-C. Ferrari, R. Gross, J. P. Hallett, R. S. Haszeldine, P. Heptonstall, A. Lyngfelt, Z. Makuch, E. Mangano, R. T. J. Porter, M. Pourkashanian, G. T. Rochelle, N. Shah, J. G. Yao and P. S. Fennell, Carbon capture and storage update, Energy Environ. Sci., 2014, 7, 130–189 CAS.
- N. MacDowell, N. Florin, A. Buchard, J. Hallett, A. Galindo, G. Jackson, C. S. Adjiman, C. K. Williams, N. Shah and P. Fennell, An overview of CO2 capture technologies, Energy Environ. Sci., 2010, 3, 1645–1669 CAS.
- J. C. Abanades, B. Arias, A. Lyngfelt, T. Mattisson, D. E. Wiley, H. Li, M. T. Ho, E. Mangano and S. Brandani, Emerging CO2 capture systems, Int. J. Greenhouse Gas Control, 2015, 40, 126–166 CrossRef CAS.
- X. He, C. Fu and M.-B. Hägg, Membrane system design and process feasibility analysis for CO2 capture from flue gas with a fixed-site-carrier membrane, Chem. Eng. J., 2015, 268, 1–9 CrossRef CAS.
- T. C. Merkel, H. Lin, X. Wei and R. Baker, Power plant post-combustion carbon dioxide capture: An opportunity for membranes, J. Membr. Sci., 2010, 359, 126–139 CrossRef CAS.
- Z. Zhang, Z.-Z. Yao, S. Xiang and B. Chen, Perspective of microporous metal-organic frameworks for CO2 capture and separation, Energy Environ. Sci., 2014, 7, 2868–2899 CAS.
- T.-H. Bae and J. R. Long, CO2/N2 separations with mixed-matrix membranes containing Mg2(dobdc) nanocrystals, Energy Environ. Sci., 2013, 6, 3565–3569 CAS.
- H. B. Park, J. Kamcev, L. M. Robeson, M. Elimelech and B. D. Freeman, Maximizing the right stuff: The trade-off between membrane permeability and selectivity, Science, 2017, 356, eaab0530 CrossRef PubMed.
- S. R. Venna and M. A. Carreon, Metal organic framework membranes for carbon dioxide separation, Chem. Eng. Sci., 2015, 124, 3–19 CrossRef CAS.
- S. Roussanaly, R. Anantharaman, K. Lindqvist, H. Zhai and E. Rubin, Membrane properties required for post-combustion CO2 capture at coal-fired power plants, J. Membr. Sci., 2016, 511, 250–264 CrossRef CAS.
- H. Kim and K. S. Lee, Design guidance for an energy-thrift absorption process for carbon capture: Analysis of thermal energy consumption for a conventional process configuration, Int. J. Greenhouse Gas Control, 2016, 47, 291–302 CrossRef CAS.
- J. Salazar, U. Diwekar, K. Joback, A. H. Berger and A. S. Bhown, Solvent Selection for Post-Combustion CO2 Capture, Energy Procedia, 2013, 37, 257–264 CrossRef.
- M. T. Mota-Martinez, J. P. Hallett and N. Mac Dowell, Solvent selection and design for CO2 capture – how we might have been missing the point, Sustainable Energy Fuels, 2017, 1, 2078–2090 CAS.
- R. Bounaceur, N. Lape, D. Roizard, C. Vallieres and E. Favre, Membrane processes for post-combustion carbon dioxide capture: A parametric study, Energy, 2006, 31, 2556–2570 CrossRef CAS.
- L. Zhao, E. Riensche, R. Menzer, L. Blum and D. Stolten, A parametric study of CO2/N2 gas separation membrane processes for post-combustion capture, J. Membr. Sci., 2008, 325, 284–294 CrossRef CAS.
- X. He and M.-B. Hägg, Hollow fiber carbon membranes: Investigations for CO2 capture, J. Membr. Sci., 2011, 378, 1–9 CrossRef CAS.
- A. Brunetti, E. Drioli, Y. M. Lee and G. Barbieri, Engineering evaluation of CO2 separation by membrane gas separation systems, J. Membr. Sci., 2014, 454, 305–315 CrossRef CAS.
- P. Luis and B. Van der Bruggen, The role of membranes in post-combustion CO2 capture, Greenhouse Gases: Sci. Technol., 2013, 3, 318–337 CrossRef CAS.
- R. Qi and M. A. Henson, Membrane system design for multicomponent gas mixtures via mixed-integer nonlinear programming, Comput. Chem. Eng., 2000, 24, 2719–2737 CrossRef CAS.
- I. K. Kookos, A targeting approach to the synthesis of membrane networks for gas separations, J. Membr. Sci., 2002, 208, 193–202 CrossRef CAS.
- R. V. S. Uppaluri, R. Smith, P. Linke and A. C. Kokossis, On the simultaneous optimization of pressure and layout for gas permeation membrane systems, J. Membr. Sci., 2006, 280, 832–848 CrossRef CAS.
- S. Roussanaly, K. Lindqvist, R. Anantharaman and J. Jakobsen, A Systematic Method for Membrane CO2 Capture Modeling and Analysis, Energy Procedia, 2014, 63, 217–224 CrossRef CAS.
- K. Lindqvist, S. Roussanaly and R. Anantharaman, Multi-stage Membrane Processes for CO2 Capture from Cement Industry, Energy Procedia, 2014, 63, 6476–6483 CrossRef CAS.
- C. A. Scholes, M. T. Ho, A. A. Aguiar, D. E. Wiley, G. W. Stevens and S. E. Kentish, Membrane gas separation processes for CO2 capture from cement kiln flue gas, Int. J. Greenhouse Gas Control, 2014, 24, 78–86 CrossRef CAS.
- B. Belaissaoui, D. Willson and E. Favre, Membrane gas separations and post-combustion carbon dioxide capture: Parametric sensitivity and process integration strategies, Chem. Eng. J., 2012, 211–212, 122–132 CrossRef CAS.
- S. Roussanaly and R. Anantharaman, Cost-optimal CO2 capture ratio for membrane-based capture from different CO2 sources, Chem. Eng. J., 2017, 327, 618–628 CrossRef CAS.
- IEAGHG, Retrofitting CO2 capture from refineries, Report 2017-TR5, London, 2017, DOI:10.5281/zenodo.1179375.
- S. Roussanaly, C. Fu, M. Voldsund, R. Anantharaman, M. Spinelli and M. Romano, Techno-economic Analysis of MEA CO2 Capture from a Cement Kiln – Impact of Steam Supply Scenario, Energy Procedia, 2017, 114, 6229–6239 CrossRef CAS.
- IEAGHG, Iron and steel CCS study (Techno-economic integrated steel mill), 2013/4, 2013.
- R. Anantharaman, O. Bolland, N. Booth, E. V. Dorst, C. Ekstrom, F. Franco, E. Macchi, G. Manzolini, D. Nikolic, A. Pfeffer, M. Prins, S. Rezvani and L. Robinson, D4.9 European best prectice guidelines for assessment of CO2 capture technologies, DECARBit Project, 2011 Search PubMed.
- S. Roussanaly, Evaluating CO2 avoidance costs of carbon capture and storage from industry, Energy Sci. Eng., 2017 Search PubMed , submitted.
- European Technology Platform for Zero Emission Fossil Fuel Power Plants (ZEP), The costs of CO2 transport, Post-demonstration CCS in the EU, 2011.
- S. Roussanaly, J. P. Jakobsen, E. H. Hognes and A. L. Brunsvold, Benchmarking of CO2 transport technologies: Part I—Onshore pipeline and shipping between two onshore areas, Int. J. Greenhouse Gas Control, 2013, 19, 584–594 CrossRef.
- H. Zhai and E. S. Rubin, Techno-Economic Assessment of Polymer Membrane Systems for Postcombustion Carbon Capture at Coal-Fired Power Plants, Environ. Sci. Technol., 2013, 47, 3006–3014 CrossRef CAS PubMed.
- M. Binns, S. Lee, Y.-K. Yeo, J. H. Lee, J.-H. Moon, J.-g. Yeo and J.-K. Kim, Strategies for the simulation of multi-component hollow fibre multi-stage membrane gas separation systems, J. Membr. Sci., 2016, 497, 458–471 CrossRef CAS.
- R. Khalilpour, A. Abbas, Z. Lai and I. Pinnau, Modeling and parametric analysis of hollow fiber membrane system for carbon capture from multicomponent flue gas, AIChE J., 2012, 58, 1550–1561 CrossRef CAS.
- R. Khalilpour, K. Mumford, H. Zhai, A. Abbas, G. Stevens and E. S. Rubin, Membrane-based carbon capture from flue gas: a review, J. Cleaner Prod., 2015, 103, 286–300 CrossRef CAS.
- J. Jakobsen, S. Roussanaly and R. Anantharaman, A techno-economic case study of CO2 capture, transport and storage chain from a cement plant in Norway, J. Cleaner Prod., 2017, 144, 523–539 CrossRef CAS.
- J. Husebye, A. L. Brunsvold, S. Roussanaly and X. Zhang, Techno economic evaluation of amine based CO2 capture: impact of CO2 concentration and steam supply, Energy Procedia, 2012, 23, 381–390 CrossRef.
- S. Roussanaly, A. L. Brunsvold, E. S. Hognes, J. P. Jakobsen and X. Zhang, Integrated Techno-economic and Environmental Assessment of an Amine-based Capture, Energy Procedia, 2013, 37, 2453–2461 CrossRef CAS.
- Chemical Engineering, Economic Indicators: Chemical Engineering Plant Cost Index (CEPCI), Journal, 2016.
- IHS, The IHS CERA European Power Capital Costs Index (EPCCI), http://www.ihs.com/info/cera/ihsindexes/index.aspx.
- J. P. Van Der Sluijs, C. A. Hendriks and K. Blok, Feasibility of polymer membranes for carbon dioxide recovery from flue gases, Energy Convers. Manage., 1992, 33, 429–436 CrossRef CAS.
- E. Rubin, G. Booras, J. Davison, C. Ekstrom, M. Matuszewski, S. T. McCoy and C. Short, Toward a common method of the cost estimation for CO2 capture and storage at fossil fuel power plants, Global CCS Institute, 2013 Search PubMed.
- M. T. Ho, G. W. Allinson and D. E. Wiley, Comparison of MEA capture cost for low CO2 emissions sources in Australia, Int. J. Greenhouse Gas Control, 2011, 5, 49–60 CrossRef CAS.
- M. Zhao, A. I. Minett and A. T. Harris, A review of techno-economic models for the retrofitting of conventional pulverised-coal power plants for post-combustion capture (PCC) of CO2, Energy Environ. Sci., 2013, 6, 25–40 CAS.
- A. Nuchitprasittichai and S. Cremaschi, Sensitivity of amine-based CO2 capture cost: The influences of CO2 concentration in flue gas and utility cost fluctuations, Int. J. Greenhouse Gas Control, 2013, 13, 34–43 CrossRef CAS.
- L. Giordano, D. Roizard, R. Bounaceur and E. Favre, Evaluating the effects of CO2 capture benchmarks on efficiency and costs of membrane systems for post-combustion capture: A parametric simulation study, Int. J. Greenhouse Gas Control, 2017, 63, 449–461 CrossRef CAS.
- B. Freeman, P. Hao, R. Baker, J. Kniep, E. Chen, J. Ding, Y. Zhang and G. T. Rochelle, Hybrid Membrane-absorption CO2 Capture Process, Energy Procedia, 2014, 63, 605–613 CrossRef CAS.
- R. Anantharaman, D. Berstad and S. Roussanaly, Techno-economic Performance of a Hybrid Membrane – Liquefaction Process for Post-combustion CO2 Capture, Energy Procedia, 2014, 61, 1244–1247 CrossRef CAS.
- C. E. Powell and G. G. Qiao, Polymeric CO2/N2 gas separation membranes for the capture of carbon dioxide from power plant flue gases, J. Membr. Sci., 2006, 279, 1–49 CrossRef CAS.
- C. A. Scholes, S. E. Kentish and G. W. Stevens, Carbon Dioxide Separation through Polymeric Membrane Systems for Flue Gas Applications, Recent Pat. Chem. Eng., 2008, 1, 52–66 CrossRef CAS.
- L. M. Robeson, The upper bound revisited, J. Membr. Sci., 2008, 320, 390–400 CrossRef CAS.
- C. Liu, R. Minkov, S. A. Faheem, T. C. Bowen and J. J. Chiou, High permeance polyimide membranes for air separation, US Pat., US8366804B2, 2013.
- National Energy Technology Laboratory, Advanced Carbon Dioxide Capture R&D Program: Technology Update – Appendix B: Carbon Dioxide Capture Technology Sheets, 2013 Search PubMed.
- M. Kattula, K. Ponnuru, L. Zhu, W. Jia, H. Lin and E. P. Furlani, Designing ultrathin film composite membranes: the impact of a gutter layer, Sci. Rep., 2015, 5, 15016 CrossRef PubMed.
- P. Gorgojo, S. Karan, H. C. Wong, M. F. Jimenez-Solomon, J. T. Cabral and A. G. Livingston, Ultrathin Polymer Films with Intrinsic Microporosity: Anomalous Solvent Permeation and High Flux Membranes, Adv. Funct. Mater., 2014, 24, 4729–4737 CrossRef CAS.
- S. Kim, E. Marand, J. Ida and V. V. Guliants, Polysulfone and Mesoporous Molecular Sieve MCM-48 Mixed Matrix Membranes for Gas Separation, Chem. Mater., 2006, 18, 1149–1155 CrossRef CAS.
- I. Kammakakam, S. Nam and T.-H. Kim, PEG-imidazolium-functionalized 6FDA-durene polyimide as a novel polymeric membrane for enhanced CO2 separation, RSC Adv., 2016, 6, 31083–31091 RSC.
- X. Liu, Y. Zhang, Y. Chen, C. Li, J. Dong, Q. Zhang, J. Wang, Z. Yang and H. Cheng, A superhydrophobic bromomethylated poly(phenylene oxide) as a multifunctional polymer filler in SPEEK membrane towards neat methanol operation of direct methanol fuel cells, J. Membr. Sci., 2017, 544, 58–67 CrossRef CAS.
- J. Ahmad and M.-B. Hägg, Preparation and characterization of polyvinyl acetate/zeolite 4A mixed matrix membrane for gas separation, J. Membr. Sci., 2013, 427, 73–84 CrossRef CAS.
- H. Lin and B. D. Freeman, Materials selection guidelines for membranes that remove CO2 from gas mixtures, J. Mol. Struct., 2005, 739, 57–74 CrossRef CAS.
- C. E. Wilmer, M. Leaf, C. Y. Lee, O. K. Farha, B. G. Hauser, J. T. Hupp and R. Q. Snurr, Large-scale screening of hypothetical metal–organic frameworks, Nat. Chem., 2011, 4, 83 CrossRef PubMed.
- Y. G. Chung, J. Camp, M. Haranczyk, B. J. Sikora, W. Bury, V. Krungleviciute, T. Yildirim, O. K. Farha, D. S. Sholl and R. Q. Snurr, Computation-Ready, Experimental Metal–Organic Frameworks: A Tool To Enable High-Throughput Screening of Nanoporous Crystals, Chem. Mater., 2014, 26, 6185–6192 CrossRef CAS.
Footnotes |
| † Electronic supplementary information (ESI) available. See DOI: 10.1039/c8se00039e |
| ‡ Defined as the amount of CO2 captured over the amount of CO2 in the flue gas. |
| § It is worth noticing that in some cases, a share of the steam and electricity required by the CO2 capture process may be produced within the industrial plant through, for example, heat recovery from high temperature sources or excess electrical power respectively. |
| ¶ One- and three-stage systems uses one fewer or more membrane separation units. |
| || Membrane configurations including sweep often result in space intensive ducting as well as modification of the industrial plant (for example modification of the power plant boiler) which can be challenging for retrofit cases. |
| ** A minimum permeate pressure of 0.2 bar is here considered. |
| †† 1000 GPU is equivalent to 2.7 m(STP)3 (m2 h bar)−1. |
| ‡‡ The EPCCI tracks and forecasts the costs associated with the construction of a portfolio of power generation plants in Europe, and is thus an indicator of the market price of the power plants. |
§§ It is worth noting that an upper limit of 25![[thin space (1/6-em)]](https://www.rsc.org/images/entities/char_2009.gif) 000 m2 of membrane area per module is used in order to avoid unrealistically large modules. 000 m2 of membrane area per module is used in order to avoid unrealistically large modules. |
| ¶¶ Zhai and Rubin suggested a replacement cost five times lower than the module investment cost. |
| |||| It is worth noting that the amount of flue gas varies significantly between cases and that there are thus also variations in economies of scale between cases. |
| *** It is worth noting that in practice millions of membrane materials could be considered however, compiling a reliable list of these materials goes far beyond the focus of the present study. |
| ††† It should be emphasised that the present paper does not assess the full potential of all polymeric membranes for post-combustion capture, as the recent research focus is on trying to breach the Robeson upper bound through various approaches. |
| ‡‡‡ This work assumes a linear relationship between the membrane thickness and permeance, while this may not be the case in practise. |
| §§§ Here defined as having the potential to lead to a membrane process at least 30% cheaper than MEA-based capture for at least one of the cases considered even when only membrane layer above 1 μm are considered. |
| This journal is © The Royal Society of Chemistry 2018 |

