Solvent induced surface modifications on hydrogen storage performance of ZnO nanoparticle decorated MWCNTs
Madhavi
Konni
,
Anima S.
Dadhich
and
Saratchandra Babu
Mukkamala
 *
*
Nanoscience & Nanotechnology Laboratory, Department of Chemistry, Institute of Science, GITAM University, Visakhapatnam 530045, Andhra Pradesh, India. E-mail: mscbabu@yahoo.com
First published on 4th December 2017
Abstract
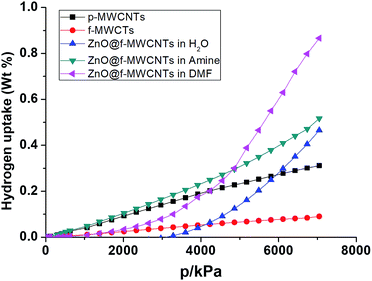
Surface functionalization via decorating nanometal particles on MWCNTs for hydrogen uptake through a spillover mechanism is the key for hydrogen energy storage for transport sectors. To improve the spillover effect, the decoration of ZnO nanoparticles on the surface of carboxylate-functionalized multi-walled carbon nanotubes (f-MWCNTs) was examined by tuning the experimental conditions such as varying the solvent and metal content. Samples were characterized using SEM coupled with EDS, TEM and powder X-ray diffraction. The hydrogen uptake performance of materials was examined at non-cryogenic temperatures i.e. 253 K and 298 K up to 70 bar pressure. Zn decorated MWCNTs prepared in water, amine and DMF adsorbed 0.47, 0.51 and 0.87 wt% of hydrogen, respectively, at non-cryogenic temperatures and moderate pressures.
Introduction
Hydrogen is considered as a promising source of energy for transport sectors, due to its high energy density and eco-friendly nature.1,2 Hydrogen not only has the potential to reduce environmental pollution via zero emission of greenhouse gases during transportation but also can create energy security for future generations.3–5 So far no proper storage medium/device has been developed for hydrogen fueled engines for transport sectors. Many studies have focused on the improvement of the adsorption of hydrogen using various materials like zeolites, metal organic frameworks (MOFs) and carbon materials for on-board applications at non-cryogenic temperatures and moderate pressures.6–9 In particular, carbon materials are constantly gaining importance due to their low weight, natural abundance and chemical stability.10,11 Among carbon materials, carbon nanotubes (SWCNTs & MWCNTs) are the most promising materials for hydrogen storage due to their cage-like structures, high surface area, high pore volume, chemical stability, and ease of synthesis.12–14 One of the greatest challenges is to fill the tubular structure with metals and gases.15 The presence of metals on carbon nanotubes is said to enhance the hydrogen storage capacity due to the hydrogen spillover effect.16–18 Hydrogen spillovers include three sequential steps: the dissociative chemisorption of molecular hydrogen on the atoms of transition metals, migration from the catalyst to the support and diffusion throughout the support surfaces.19 The decoration of metals on CNTs is one of the extensively researched areas towards improving hydrogen storage and has the potential to reach theset DOE target (target of 5.5 wt% or 40 g l−1 hydrogen storage by 2020 at non-cryogenic temperatures) for commercial purposes. Metal nanoparticles on CNTs dissociate the hydrogen molecule, spilling it over to CNTs and are responsible for higher storage.20–22 The hydrogen storage capacity increases to 3.5 wt% which is almost 5 times higher as compared to that of pristine CNTs.23 In order to enhance the overall hydrogen storage capacity, efficient doping of metal nanoparticles such as Mg, Cu, Fe, Ni, Pd, etc on the surface of CNTs is an important factor for allowing more exposure of hydrogen molecules on metals to facilitate the spillover mechanism.24–26 ZnO is one of the natural n-type semiconductor materials and finds use in various applications such as chemical, bio & gas sensors, surface acoustic waveguides, dye-sensitized solar cells (DSSCs), photo catalysts, degradation of toxic dyes, etc.27–29 Due to electrons in the conduction band, ZnO commonly exhibits strong n-type conductivity.30,31 The adsorption/desorption of gases can influence the conductance behavior of ZnO by taking electrons from the conduction band. To attain the surface equilibrium, the dangling bonds in ZnO are saturated by sharing their dangling electrons with oxygen present in an ambient environment.32 The formation energy of H+ is low enough to allow for a large solubility of hydrogen in n-type ZnO.33 Also, molecular hydrogen attracts the antibonding orbitals of Zn. But the exact mechanism is poorly understood.32 Furthermore, MWCNTs decorated with ZnO are used in gas sensor applications.34,35 In the present study, the hydrogen storage capabilities of ZnO nanoparticle decorated MWCNTs (ZnO@f-MWCNTs) prepared under varying experimental conditions of metal concentrations and solvents (water, amine, and DMF) were examined.Experimental
Materials and synthesis
Zn(NO3)2·6H2O, triethylamine (TEA) and dimethylformamide (DMF) were purchased from Merck India and Fisher Scientific, India. All the reagents were used as received. Raw MWCNTs were purified by refluxing at 95 °C for 6 h in 6.0 M HCl; thereafter, it was calcined for 2 h in the furnace at 500–520 °C to get the pristine MWCNTs (p-MWCNTs). For carboxylate functionalization, 0.3 g of the p-MWCNTs and 150 ml of nitration mixture (1![[thin space (1/6-em)]](https://www.rsc.org/images/entities/char_2009.gif) :
:![[thin space (1/6-em)]](https://www.rsc.org/images/entities/char_2009.gif) 3 HNO3 and H2SO4) were refluxed for 48 h under magnetic stirring. The resulting solid was filtered and washed to attain neutral pH after which the sample was dried overnight in a vacuum at 40 °C. 200 mg of carboxylate functionalized MWCNTs (f-MWCNTs) and 5.94 g [0.02 mol, high metal concentration (MHC)] or 2.97 g [0.01 mol, low metal concentration (MLC)] of Zn(NO3)2·6H2O were taken in a 500 ml round bottomed flask. To this, 150 ml distilled water/150 ml distilled water containing 0.5 ml triethylamine (TEA)/150 ml dimethylformamide (DMF) was added and mixed thoroughly. It was heated at 80 °C for 6 h (pH of aqueous medium was 6.8 and TEA medium was 10.2). The resulting solid was washed till the pH of the sample was 7.0 and was dried overnight in a vacuum at 40 °C.
3 HNO3 and H2SO4) were refluxed for 48 h under magnetic stirring. The resulting solid was filtered and washed to attain neutral pH after which the sample was dried overnight in a vacuum at 40 °C. 200 mg of carboxylate functionalized MWCNTs (f-MWCNTs) and 5.94 g [0.02 mol, high metal concentration (MHC)] or 2.97 g [0.01 mol, low metal concentration (MLC)] of Zn(NO3)2·6H2O were taken in a 500 ml round bottomed flask. To this, 150 ml distilled water/150 ml distilled water containing 0.5 ml triethylamine (TEA)/150 ml dimethylformamide (DMF) was added and mixed thoroughly. It was heated at 80 °C for 6 h (pH of aqueous medium was 6.8 and TEA medium was 10.2). The resulting solid was washed till the pH of the sample was 7.0 and was dried overnight in a vacuum at 40 °C.
Characterization
The morphology of the prepared samples was examined using a Philips CM200 transmission electron microscope and a Zeiss Ultra plus Field Emission Scanning Electron Microscope equipped with an EDS. The IR spectra of the samples were recorded on a PerkinElmer Spectrum Two FT-IR using the KBr pellet preparation method. The powder X-ray diffraction patterns were obtained on a Bruker D8 Advance diffractometer (45 kV, 40 mA) with Ni filtered Cu Kα radiation (λ = 1.5406 Å). The specific surface area was determined according to the Brunauer–Emmett–Teller (BET) method (Quantachrome NOVA 1200e).Hydrogen storage capacity
The high pressure hydrogen adsorption measurements for the synthesized materials were conducted on a BELSORP-HP (BEL, Japan). To get accurate results, ultra-pure (99.9999%) helium and hydrogen gases were used for the measurements. After activating the material for sufficient time, the weight of the sample was calculated again after the evacuation of solvent guest molecules from the pores. Then the hydrogen uptake capacity was measured volumetrically by varying the temperatures (253 K and 298 K) and pressures up to 70 bar.Results and discussion
Morphology
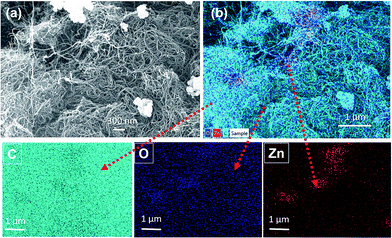
The TEM images of p-MWCNTs, f-MWCNTs and ZnO@f-MWCNTs are shown in Fig. 1. Initially the pristine MWCNTs (p-MWCNTs) were purified and converted into carboxylate functionalized MWCNTs (f-MWCNTs) by the chemical oxidation process. TEM images revealed that both morphology/texture and end-cap structure of carbon nanotubes with the average diameter of 30 nm was well-reversed in f-MWCNTs (Fig. 1b). To identify the optimum conditions required for designing the materials with efficient hydrogen storage properties, a number of chemical reactions were conducted by changing the reaction media and the metal concentrations for decorating the carboxylate functionalized MWCNTs with a desired metal. As shown in Fig. 1c and d, ZnO nanoparticles of various sizes, about 50–60 nm and 10–15 nm, were found on the surface of f-MWCNTs. Fig. 2a shows the SEM image of ZnO@f-MWCNTs. As shown in Fig. 2b the elements C, O and Zn existed in the as-prepared samples, which preliminarily confirmed the presence of the dopant of zinc oxide nanoparticles. Metal content in the samples was analyzed through SEM-EDS. The present study reveals that the quantity of Zn doped on MWCNTs at MHC was about 0.74 wt% and at MLC was about 0.62 wt%.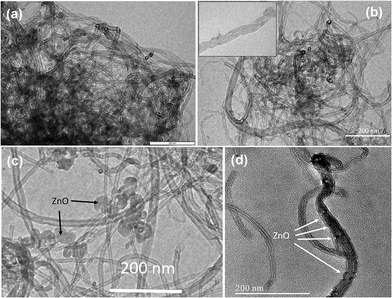 | ||
| Fig. 1 (a) TEM images of (a) p-MWCNTs, (b) f-MWCNTs, (c) ZnO@f-MWCNTs and (d) magnified image of ZnO@f-MWCNTs. | ||
FT-IR analysis
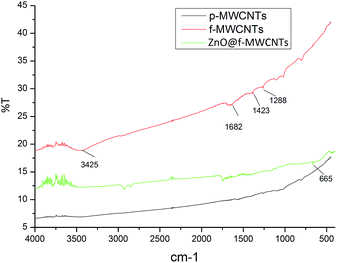
Fig. 3 shows the FT-IR spectra of p-MWCNTs, f-MWCNTs and ZnO@f-MWCNTs. The peaks at 3425 cm−1 and 1682 cm−1 are assigned to the stretching vibrations of O–H and C![[double bond, length as m-dash]](https://www.rsc.org/images/entities/char_e001.gif) O of carboxyl functional groups on f-MWCNTs and ZnO@f-MWCNTs. These results indicate that the acid functionalization of p-MWCNTs resulted in the successful incorporation of carboxyl functional groups on the surface of MWCNTs. The peak at 665 cm−1 corresponds to the Zn–O bond.
O of carboxyl functional groups on f-MWCNTs and ZnO@f-MWCNTs. These results indicate that the acid functionalization of p-MWCNTs resulted in the successful incorporation of carboxyl functional groups on the surface of MWCNTs. The peak at 665 cm−1 corresponds to the Zn–O bond.
Powder XRD analysis
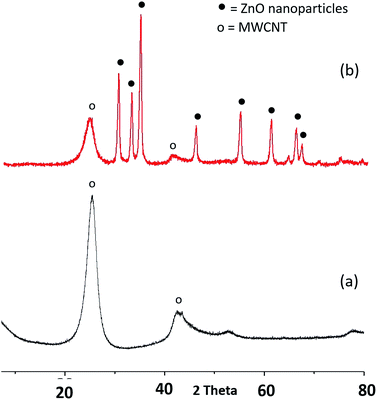
The powder XRD patterns of p-MWCNTs, f-MWCNTs and ZnO@f-MWCNTs are shown in Fig. 4. The diffraction peaks at 25.4 and 42.9° correspond to the graphitic reflections (JCPDS no. 01-0646). The diffraction peaks at 32.0, 34.7, 36.5, 47.7, 56.8, 63.1, 68.1 and 69.2° correspond to (100), (002), (101), (102), (110), (103), (112) and (201) planes of ZnO nanoparticles, respectively (JCPDS no. 36-1451).BET analysis
The BET-specific surface area of p-MWCNTs, f-MWCNTs and ZnO@f-MWCNTs was examined by N2 absorption measurements at 77 K. The surface areas of p-MWCNTs and f-MWCNTs are 360 m2 g−1 and 236 m2 g−1, respectively (Table 1). This decrease in the surface area from pristine to a functionalized one is due to the blockage of pores of the p-MWCNTs by COOH groups. After metal decoration, the surface area was further reduced from 236 m2 g−1 to 218, 210 and 17 m2 g−1 for ZnO@f-MWCNTs prepared in water, amine and DMF, respectively. The lowest surface area observed in the case of ZnO@f-MWCNTs prepared in DMF medium is due to the blockage of pores by the solvent molecules.| Sample | Reaction medium | s BET (m2 g−1) | H2 uptake at 253 K & 70 bar (wt%) | H2 uptake at 298 K & 70 bar (wt%) |
|---|---|---|---|---|
| a MLC = low metal concentration. b MHC = high metal concentration. | ||||
| p-MWCNTs | — | 360 | 0.30 | 0.10 |
| f-MWCNTs | — | 236 | 0.09 | 0.06 |
| Zn@f-MWCNTs | Water | 218 | 0.17a | 0.12a |
| 0.47b | 0.31b | |||
| Zn@f-MWCNTs | Triethylamine | 210 | 0.19a | 0.17a |
| 0.51b | 0.50b | |||
| Zn@f-MWCNTs | DMF | 17 | 0.31a | 0.22a |
| 0.87b | 0.67b | |||
Hydrogen sorption measurements
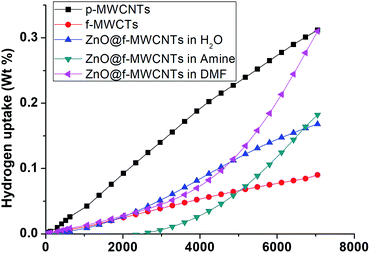
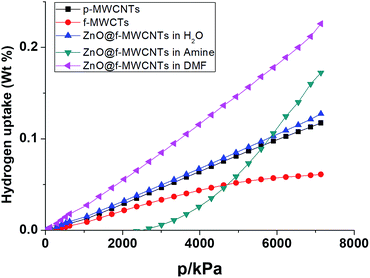
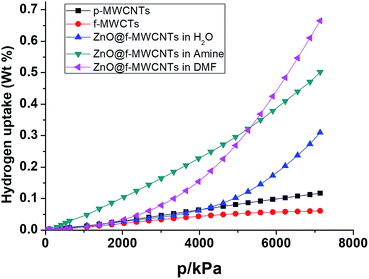
The hydrogen adsorption capacities of ZnO decorated MWCNTs along with pristine and functionalized ones were measured volumetrically at 253 K and 298 K at moderate pressures of 70 bar using a high pressure sorption analyser, BELSORP-HP. Hydrogen excess sorption isotherms for ZnO@f-MWCNTs prepared at different metal concentrations [MHC and MLC] in three different solvents, i.e., water, triethylamine (TEA) and DMF, are shown in Fig. 5–8. As hydrogen adsorption was reversible in all the samples, the desorption curves have not been shown in the figures. The excess sorption isotherms of all the samples display a linear trend typical for monolayer adsorption on porous materials. It was observed that the hydrogen adsorption capacities of pristine and carboxylate functionalized MWCNTs at 253 K and 70 bar pressure are 0.14 and 0.1 wt%, respectively. At 298 K the hydrogen adsorption capacities of pristine and COOH–MWCNTs are 0.09 and 0.06 wt%, respectively. The decrease in hydrogen adsorption capacity from pristine to functionalized MWCNTs at both temperatures is due to the blockage of surface pores by COOH groups. The same was reflected in the decrease of the surface area from 360 m2 g−1 to 235 m2 g−1 (Table 1). The texture of f-MWCNTs was easily changed by decorating with ZnO nanoparticles leading to further decrease in the surface area to about 210 m2 g−1.ZnO@f-MWCNTs prepared at MLC in water, triethylamine, and DMF adsorb 0.17, 0.19, and 0.31 wt% of hydrogen (Fig. 5), whereas ZnO@f-MWCNTs prepared at MHC adsorb 0.47, 0.51, and 0.87 wt% (Fig. 6), respectively, at 253 K. EDAX analysis reveals that the amount of Zn decorated on the surface of f-MWCNTs was 0.74 wt% at MHC. This result indicates that the hydrogen sorption properties drastically increase on increasing the ZnO nanoparticle content on the surface of f-MWCNTs. Under the MLC a linear trend was observed in all the samples. Type III isotherm was observed for the ZnO–MWCNTs prepared at MLC in water and DMF due to multilayer formation.
Fig. 7 shows that the hydrogen adsorption isotherms recorded at 298 K for ZnO@f-MWCNTs prepared at MHC in water, triethylamine, and DMF indicated 0.12, 0.17, 0.22 wt% adsorption. Similarly, ZnO@f-MWCNTs prepared at MHC under the aforementioned reaction conditions adsorbed 0.31, 0.50, and 0.67 wt% of hydrogen (Fig. 8).
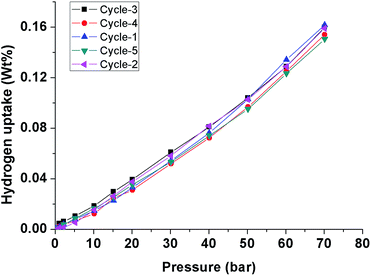
From the abovementioned observations, ZnO@f-MWCNTs prepared in water, triethylamine, and DMF media at low and high concentrations of metals exhibited high adsorption capacities compared to p-MWCNTs and f-MWCNTs. One of the reaction media, DMF, a polar aprotic solvent plays an important role in uniform loading and decoration of ZnO nanoparticles on the surface of MWCNTs.36 Due to this reason high uptake of hydrogen was observed in the case of ZnO@f-MWCNTs prepared in DMF solvent. Also the adsorption capacity significantly increased at 253 K as compared to that observed at 298 K. A comparison of the hydrogen storage capacity of MWCNT-based materials is listed in Table 2.37–45 Multi-cycles of adsorption/desorption of hydrogen on the surface of one of the ZnO@f-MWCNTs (prepared in amine) have been carried out at 298 K (Fig. 9). We found around 6.0% loss in hydrogen uptake capacity after 5 cycles. This negligible loss is also found in earlier reports.46
| Material | Hydrogen uptake (wt%) | Condition (temp, pressure) | Reference |
|---|---|---|---|
| p-MWCNTs | 0.056 | 298 K, 50 bar | 37 |
| p-MWCNTs | 0.09 | 298 K, 20 bar | 38 |
| p-MWCNTs | 0.09 | 298 K, 40 bar | 39 |
| p-MWCNTs | 0.20 | 298 K, 120 bar | 40 |
| ZnO nanoparticles | 0.83 | 298 K, 30 bar | 41 |
| ZnO nanoparticles/ZnO nanofibres | 0.50/1.20 | 298 K, 70 bar | 42 |
| ZnO nanoparticles | 0.09 | 298 K, 1 bar | 43 |
| ZnO nanopowder/ZnO nanowires | 0.50/0.91 | 298 K, 30 bar | 44 |
| ZnO powder | 0.03 | 289 K, 1 bar | 45 |
Conclusions
In order to maximize the hydrogen uptake capacity, ZnO nanoparticle decorated MWCNTs were prepared under different experimental conditions by varying the solvent and metal concentrations. Reaction conditions such as solvent and metal ion content played an important role in the decoration of ZnO nanoparticles on f-MWCNTs subsequently influencing the hydrogen uptake. Particularly, as the DMF solvent facilitates uniform dispersion and decoration of nanoparticles on the surface of f-MWCNTs, a high uptake of hydrogen was observed in both the cases, i.e., low and high concentrations of metal precursors.Conflicts of interest
There are no conflicts to declare.Acknowledgements
This work was supported by the University Grants Commission (UGC), Govt. of India (Project No: 42-258/2013 (SR)). The authors sincerely acknowledge the SAIF, IIT Bombay, for assistance with TEM measurements.References
- R. A. Patricio, A. D. Sales, E. M. Sacramento, L. C. de Lima and T. N. Veziroglu, Int. J. Hydrogen Energy, 2012, 37, 7355–7364 CrossRef CAS.
- K. Mazloomi and C. Gomes, Int. J. Hydrogen Energy, 2012, 16, 3024–3033 CAS.
- S. Chaudhuri and J. T. Muckerman, J. Phys. Chem. B, 2005, 109, 6952–6957 CrossRef CAS PubMed.
- Y. H. Hu and L. Zhang, Adv. Mater., 2010, 22, 117–130 CrossRef PubMed.
- C. K. Ngaw, C.-e. Zhao, V. B. Wang, S. Kjelleberg, T. T. Y. Tan, Q. Zhang and S. C. J. Loo, Sustainable Energy & Fuels, 2017, 1, 191–198 CAS.
- H. Zhou, X. Liu, J. Zhang, X. Yan, Y. Liu and A. Yuan, Int. J. Hydrogen Energy, 2014, 39, 2160–2167 CrossRef CAS.
- P. Dibandjo, C. Zlotea, R. Gadiou, C. M. Ghimbeu, F. Cuevas, M. Latroche, E. Leroy and C. Vix-Guterl, Int. J. Hydrogen Energy, 2013, 38, 952–965 CrossRef CAS.
- K. Xia, Q. Gao, J. Jiang and H. Wang, Mater. Lett., 2013, 100, 227–229 CrossRef CAS.
- Y. J. Han and S. J. Park, Carbon Letters, 2015, 16, 281–285 CrossRef.
- S. Y. Kwak, H. G. Kim, J. M. Byun, J. H. Park, M. J. Suk, S. T. Oh and Y. D. Kim, J. Korean Powder Metall. Inst., 2014, 21, 28–33 CrossRef.
- H. Kim, H. R. Choi, J. M. Byun, M. J. Suk, S. T. Oh and Y. D. Kim, J. Korean Powder Metall. Inst., 2015, 22, 122–128 CrossRef.
- L. Zubizarreta, J. A. Menéndez, J. J. Pis and A. Arenillas, Int. J. Hydrogen Energy, 2009, 34, 3070–3076 CrossRef CAS.
- P. Cote, A. I. Benin, N. W. Ockwig, M. O'Keeffe, A. J. Matzger and O. M. Yaghi, Science, 2005, 310, 1166–1170 CrossRef PubMed.
- N. L. Rosi, J. Eckert, M. Eddaoudi, D. T. Vodak, J. Kim and M. O'Keeffe, Science, 2003, 300, 1127–1129 CrossRef CAS PubMed.
- Z. H. Khan and M. Hussain, Indian J. Eng. Mater. Sci., 2005, 12, 529–551 CAS.
- T. Das, S. Banerjee, K. Dasgupta, J. B. Joshi and V. Sudarsan, RSC Adv., 2015, 5, 41468–41474 RSC.
- S. J. Park and S. Y. Lee, Int. J. Hydrogen Energy, 2010, 35, 13048–13054 CrossRef CAS.
- S. Z. Mortazavi, P. Parvin, A. Reyhani, R. Malekfar and S. Mirershadi, RSC Adv., 2013, 3, 1397–1409 RSC.
- H. Cheng, L. Chen, A. C. Cooper, X. Sha and G. P. Pez, Energy Environ. Sci., 2008, 1, 338–354 CAS.
- N. L. Rosi, J. Eckert, M. Eddaoudi, D. T. Vodak, J. Kim and M. O'Keeffe, Science, 2003, 300, 1127–1129 CrossRef CAS PubMed.
- R. Bacsa, C. Laurent, R. Morishima, H. Suzuki and M. L. Lay, J. Phys. Chem. B, 2004, 108, 12718–12723 CrossRef CAS.
- S. M. Lee, K. H. An, Y. H. Lee, G. Seifert and T. Frauenheim, J. Am. Chem. Soc., 2001, 123, 5059–5063 CrossRef CAS PubMed.
- D. Eder, Chem. Rev., 2010, 110(3), 1348–1385 CrossRef CAS PubMed.
- P. Dibandjo, C. Zlotea, R. Gadiou, C. M. Ghimbell, F. Cuevas, M. Latroche, E. Leroy and C. V. Guters, Int. J. Hydrogen Energy, 2013, 38, 952–965 CrossRef CAS.
- M. Konni, N. Narayanam, A. S. Dadhich and S. B. Mukkamala, Fullerenes, Nanotubes, Carbon Nanostruct., 2015, 23, 782–787 CrossRef CAS.
- M. Konni, A. S. Dadhich and S. B. Mukkamala, Int. J. Hydrogen Energy, 2017, 42, 953–959 CrossRef CAS.
- S. K. Mohanta, D. C. Kim, B. H. Kong, H. K. Cho, W. Liu and S. Tripathy, Sci. Adv. Mater., 2010, 2, 64–68 CrossRef CAS.
- M. V. Pavliuk, A. M. Cieślak, M. Abdellah, A. Budinská, S. Pullen, K. Sokołowski, D. L. A. Fernandes, J. Szlachetko, E. L. Bastos, S. Ott, L. Hammarström, T. Edvinsson, J. Lewiński and J. Sa, Sustainable Energy & Fuels, 2017, 1, 69–73 CAS.
- J. X. Wang, X. W. Sun, A. Wei, Y. Lei, X. P. Cai, C. M. Li and Z. L. Dong, Appl. Phys. Lett., 2006, 88, 233106–233108 CrossRef.
- D. C. Look, J. W. Hemsky and J. R. Sizelove, Phys. Rev. Lett., 1999, 82, 2552–2555 CrossRef CAS.
- G. A. Prinz, Science, 1998, 282, 1660–1663 CrossRef CAS PubMed.
- R. Wahab, F. Khan, N. Ahmed, H. S. Shin, J. Musarrat and A. A. A. Khedhairy, J. Nanomater., 2013, 1–6 Search PubMed.
- C. G. V. D. Walle, Phys. Rev. Lett., 2000, 85, 1012–1015 CrossRef PubMed.
- X. Li, J. Wang, D. Xie, J. Xu, Y. Xia and L. Xiang, Mater. Lett., 2017, 206, 18–21 CrossRef CAS.
- Y. J. Kwon, A. Mirzaei, S. Y. Kang, M. S. Chn and H. W. Kim, Appl. Surf. Sci., 2017, 413, 242–252 CrossRef CAS.
- J. Khanderi, R. C. Hoffmann, A. Gurlo and J. J. Schneider, J. Mater. Chem., 2009, 19, 5039–5046 RSC.
- S. Banerjee, K. Dasgupta, A. Kumar, P. Ruz, B. Vishwanadh, J. B. Joshi and V. Sudarsan, Int. J. Hydrogen Energy, 2015, 40, 3268–3276 CrossRef CAS.
- S. U. Rather, Int. J. Hydrogen Energy, 2017, 42, 11553–11559 CrossRef CAS.
- Z. Chu, R. He, X. Zhang, H. Cheng, X. Li and Y. Wang, Int. J. Hydrogen Energy, 2010, 35, 3165–3169 CrossRef CAS.
- C. Liu, Y. Chen, C. Z. Wu, S. T. Xu and H. M. Cheng, Carbon, 2010, 48, 452–455 CrossRef CAS.
- Q. Wan, C. L. Lin, X. B. Yu and T. H. Wang, Appl. Phys. Lett., 2004, 84, 124–126 CrossRef CAS.
- Z. Yaakob, D. J. Khadem, S. Shahgaldi, W. R. W. Daud and S. M. Tasirin, Int. J. Hydrogen Energy, 2012, 37, 8388–8394 CrossRef CAS.
- N. Bouazizi, T. Boudharaa, R. Bargougui, J. Vieillard, S. Ammar, F. Le Derf and A. Azzouz, J. Colloid Interface Sci., 2017, 491, 89–97 CrossRef CAS PubMed.
- H. Pan, J. Luo, H. Sun, Y. Feng, C. Poh and J. Lin, Nanotechnology, 2006, 17, 2963–2967 CrossRef CAS.
- N. Bouazizi, M. Khelil, F. Ajala, T. Boudhara, A. Benghnia, H. Lachheb, R. Ben Slama, B. Chaouachi, A. M'nif and A. Azzouz, Int. J. Hydrogen Energy, 2016, 41, 11232–11241 CrossRef CAS.
- A. Reyhani, S. Z. Mortazavi, S. Mirershadi, A. Z. Moshfegh, P. Parvin and A. N. Golikand, J. Phys. Chem. C, 2011, 115, 6994–7001 CAS.
| This journal is © The Royal Society of Chemistry 2018 |

