Hollow carbon microtubes from kapok fiber: structural evolution and energy storage performance†
Received
5th October 2017
, Accepted 21st November 2017
First published on 7th December 2017
Abstract
Hollow carbon microtubes, with tunable porosity and surface chemistry, are highly desired for advanced energy conversion and storage applications. Although most natural fibers possess a hollow tubular structure, their original morphology is easily destroyed when they are carbonized directly due to the pyrolysis reactions. In this study, using kapok fiber as a precursor, hollow carbon microtubes were obtained by pre-stabilization and subsequent carbonization–activation in the presence of (NH4)2HPO4. During structural evolution from an organic biomass fiber to a hollow carbon fiber, (NH4)2HPO4 acts not only as a porogen and nitrogen/phosphorus source for in situ activation and doping but also as a crosslinking agent for chemical stabilization. The material exhibited good electrochemical performance in an organic electrolyte when evaluated as a supercapacitor electrode due to highly accessible surface area, convenient ion diffusion, and electron transfer. This study provides insights for the design of an anisotropic porous carbon structure towards next-generation high-power smart devices.
1. Introduction
With the depletion of fossil fuels and deterioration of global environment, exploration of renewable, cost-effective, and eco-friendly materials with high adsorption, fast ion and electron transport, and tunable surface chemistry is urgently needed for the development of energy storage systems, environmental protection materials, and catalysts.1,2 Among different candidates, porous carbon derived from biomass, such as seaweed,3 bagasse,4 eggplant,5 and banana peels,6 has been considered as a promising material due to its abundant and renewable raw materials, high surface area, well-developed porous structure, self-doping of oxygen, and outstanding adsorption and electrochemical performance.7 However, there are still some challenges, such as (1) higher accessible surface area and (2) one-dimensional hierarchical morphology, associated with its use.8–11
Compared with an irregular particle morphology, a 1D hollow architecture can provide a more efficient pathway for ion and electron transport, resulting in a higher effective surface area.12,13 To date, a number of studies have been devoted towards the synthesis of porous carbon materials with a natural 1D hollow micro-structure. For instance, carbon nanofibers derived from natural plants, such as cotton,14 ramie,15 and renewable glucose,16 have been prepared. Due to their unique hollow structure, these biomass-based activated carbon fibers showed an excellent adsorption and electrochemical performance. Unlike cotton and ramie, kapok (having an inner diameter of ∼14 μm) has the highest hollow ratio of 97%, which can provide a larger accessible surface and faster transport channel.4,17,18 However, the wall of the tube is very thin (0.74 μm) such that the natural fibrous morphology is much more easily destroyed via direct carbonization or activation by H3PO4, ZnCl2, or KOH at a high temperature above 500 °C.19
To inherit the natural hollow structure, in this study, kapok-based hollow carbon microtubes were prepared via pre-stabilization followed by carbonization and simultaneous activation in the presence of (NH4)2HPO4. During structural evolution from an organic biomass fiber to a hollow carbon fiber, (NH4)2HPO4 is not only utilized as a porogen and nitrogen/phosphorus source,20–23 but also as an indispensable crosslinking agent to stabilize the kapok structure, which can prevent the destruction of the natural hollow morphology at higher temperatures and increase the carbon yield. Due to the special hollow structure, high specific surface areas, and sufficient active sites originated from N–P co-doping, the obtained material HCMT-650 exhibits excellent electrochemical performance as an electrode material for supercapacitors in an organic electrolyte.
2. Results and discussion
2.1 Micromorphology and pore structure
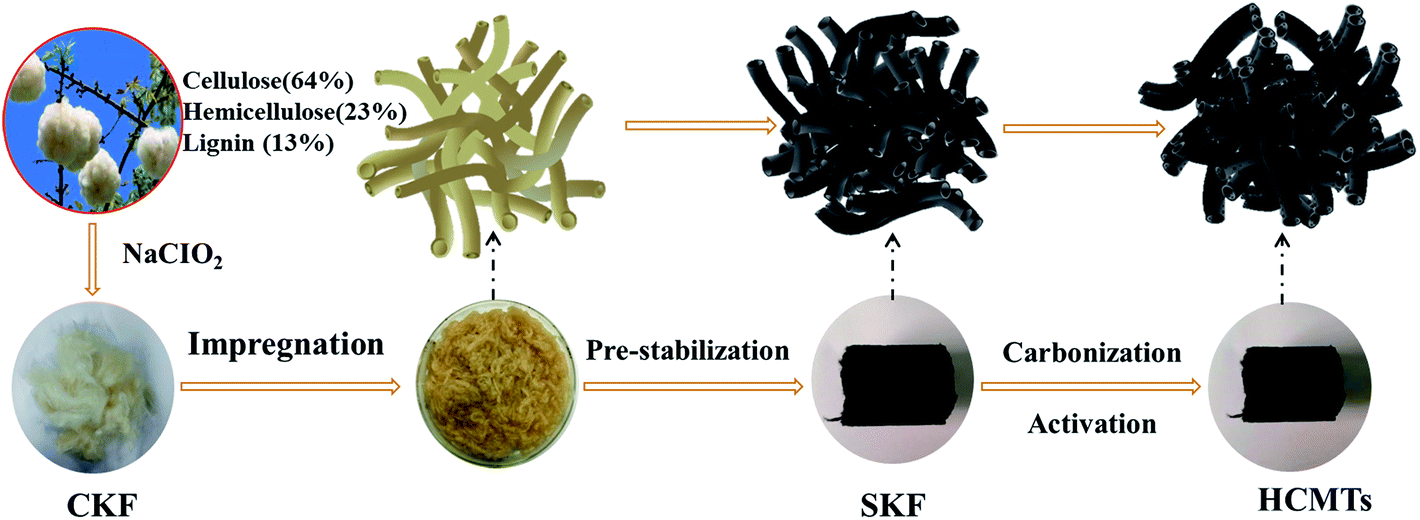
Fig. 1 illustrates the preparation process of the kapok-based activated carbon microtubes. To ensure the preservation of the hollow fiber structure, a clean kapok fiber (CKF) was first immersed in an aqueous solution of (NH4)2HPO4 for 12 h at 115 °C. Then, the resulting samples were dried and pre-oxidized under an air atmosphere at 200 °C for 2 h to prepare a stabilized kapok fiber (SKF). After this, the HCMTs were obtained by direct thermal annealing of the SKF under an argon atmosphere. From a macro point of view, the HCMTs shrink after carbonization–activation, but show a similar shape to the stabilized kapok fiber (SKF) without an obvious break.
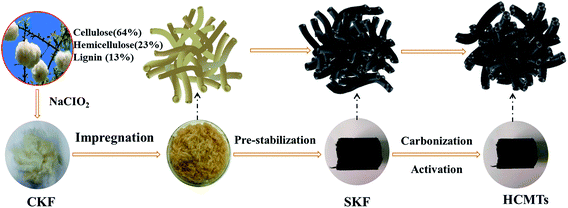 |
| | Fig. 1 Schematic of the synthesis procedure for HCMTs. | |
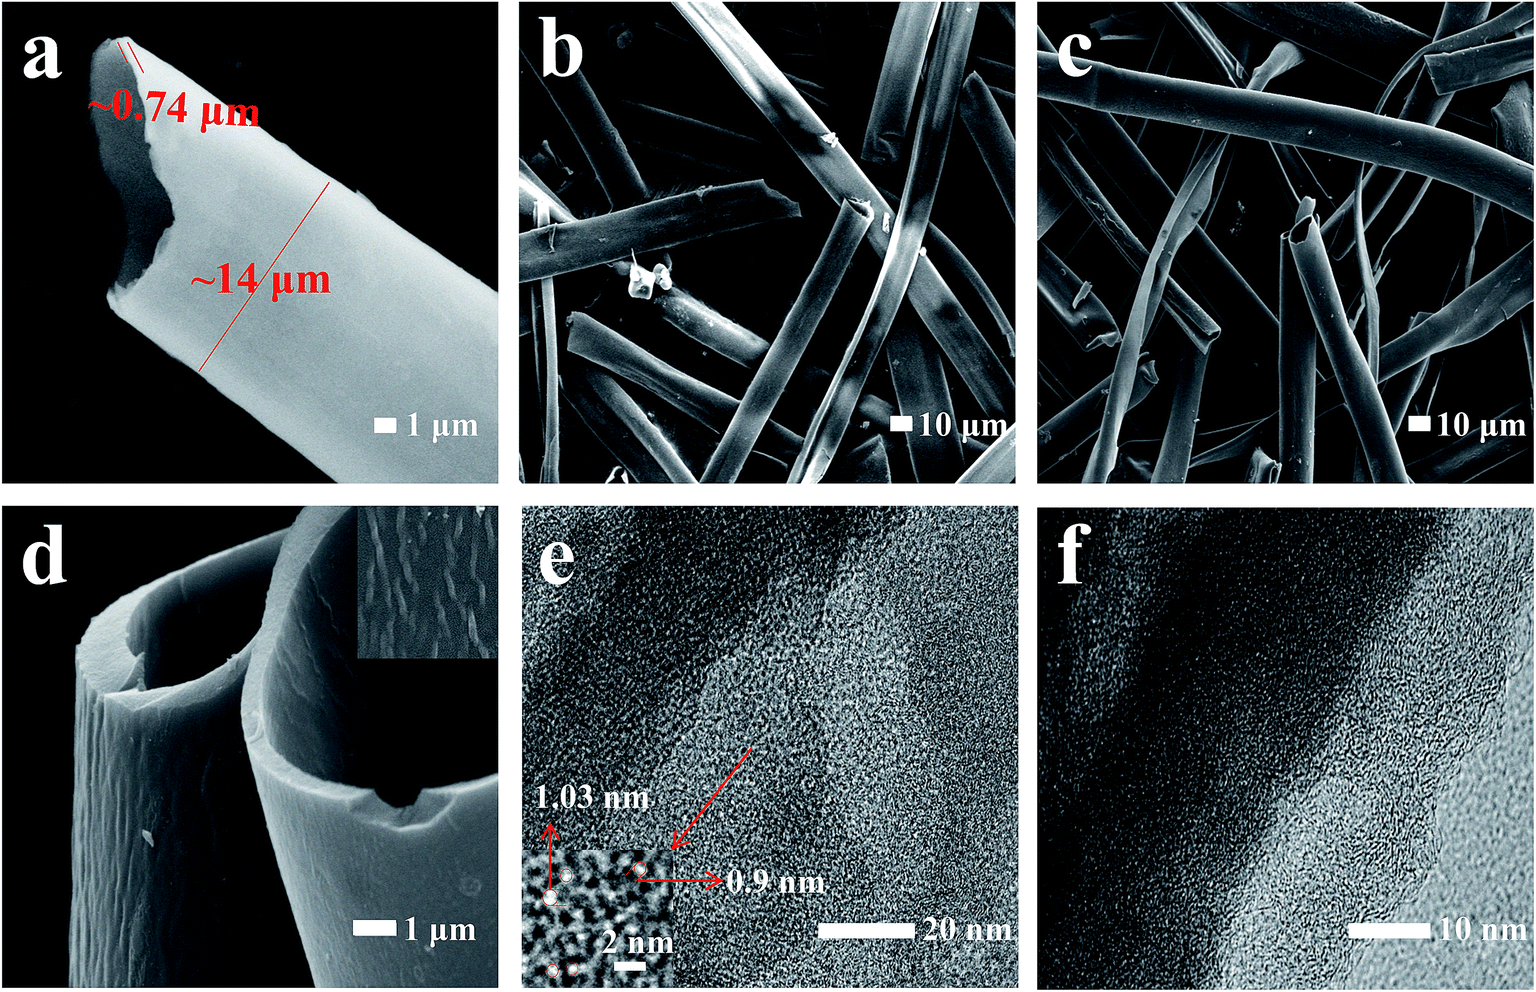
The micromorphology of the CKF, SKF, and HCMT-650 was observed by FESEM and TEM. The clean kapok fibers (CKF) possess a hollow microtube with a diameter of ∼14 μm and a thickness of ∼0.74 μm, as shown in Fig. 2a. The opened hollow structure allows full penetration of (NH4)2HPO4 molecules into the hollow tube and ensures that the activation is significantly sufficient. Fig. 2b demonstrates that the washed SKF (WSKF) maintains the natural hollow morphology well. In comparison, the architecture of OKF (the pre-oxidized kapok fiber without (NH4)2HPO4 is called as the OKF) has been broken into irregular flakes due to serious ablation (Fig. S1a†). The result indicates that (NH4)2HPO4 facilitates the formation of crosslinked kapok to prevent the destruction of the hollow tube during pre-oxidation and even during the following carbonization–activation. As shown in Fig. 2c and S1b–d,† HCMTs inherit the natural hollow morphology without an obvious change. However, the hollow structure has been destroyed in PKAC-650 (PKAC-650 has been prepared by the direct carbonization–activation of the CKF with (NH4)2HPO4); this signifies the importance of pre-oxidation in the preparation of HCMTs. To observe the structure of microtubes more clearly, a high magnification SEM image of HCMT-650 is obtained and shown in Fig. 2d. It can be found that there is no visible pore, but there are ordered grains parallel to the tube axis. The structural properties were further confirmed by high-resolution TEM. As shown in Fig. 2e, there are abundant slits related to the micropores (<2 nm) on the surface, which are favourable for adequate charge storage and high coulombic efficiency. Moreover, some distortion lattice fringes near the edges of HCMT-650 (Fig. 2f) correspond to the disordered carbon structure, which is conducive to improving the electronic conductivity.
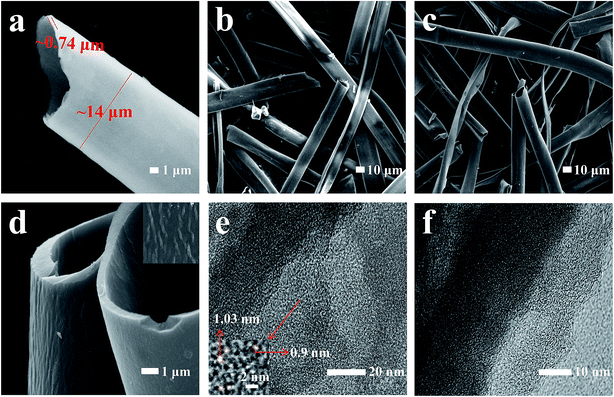 |
| | Fig. 2 SEM images of (a) KF, (b) WSKF, and (c) HCMT-650; (d) the high magnification SEM image of HCMT-650; (e) the low magnification TEM image of HCMT-650; and (f) the HRTEM image of HCMT-650. | |
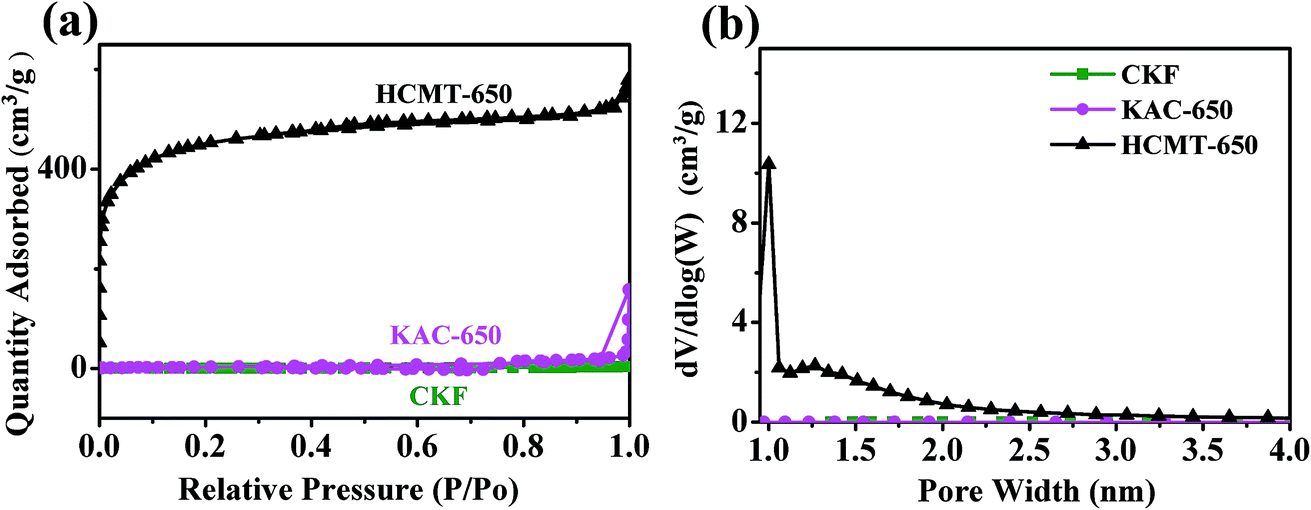
The detailed porous structure of CKF, KAC-650, and HCMT-650 was characterized by N2 adsorption/desorption. It is clear that the isotherm profiles of HCMT-650 show a sharp increase at low relative pressures (P/P0 < 0.01), no visible hysteresis loop extending from P/P0 0.5 to 0.85, and small tails at high relative pressures (P/P0 > 0.9), exhibiting typical type I isotherms, indicative of high micro-porosity in the HCMT-650 (Fig. 3a). The pore-size distribution curves are shown in Fig. 3b, which are obtained by the nonlocal density functional theory (NLDFT) model. Clearly, the pore structure in HCMT-650 mainly consists of micropores (<2 nm). These pores are distributed inside and outside the surface of the tube wall; this can be proven by the EDS analysis (Fig. S2†). The BET surface area and pore structure parameters of the CKF, KAC-650, and HCMTs are summarized in Table 1. With an increase in the activation temperature from 500 to 650 °C, both the surface area and pore volume increase. The specific surface areas of HCMT-500 and HCMT-650 are determined to be 1233 and 1600 m2 g−1, respectively, whereas the pore volumes are 0.7 and 0.90 cm3 g−1, respectively. However, both the surface area and pore volume in HCMT-700 dramatically decrease to 1150 m2 g−1 and 0.62 cm3 g−1, respectively, probably due to the collapse of the pore structure at 700 °C. The hollow channel and the pore structure inside and outside the surface of the tube wall are beneficial for providing a low-resistance pathway and enhancing the electrostatic adsorption areas.14,24 By contrast, in the absence of (NH4)2HPO4 as a porogen, a very low N2 uptake of KAC-650 is similar to that of the original kapok and suggests the nonporous nature of the fiber; this emphasizes the importance of (NH4)2HPO4 in the development of nanopores.
 |
| | Fig. 3 (a) Nitrogen adsorption/desorption isotherms of CKF, KAC-650, and HCMT-650 and (b) pore size distribution of CKF, KAC-650, and HCMT-650. | |
Table 1 The specific surface area and pore volume of CKF, KAC-650, HCMT-500, HCMT-650, and HCMT-700
| Sample |
S
BET [m2 g−1] |
S
micr [m2 g−1] |
V
total [cm3 g−1] |
V
micro [cm3 g−1] |
| CKF |
8.2 |
6.8 |
— |
— |
| KAC-650 |
11.5 |
5.0 |
0.1632 |
0.005 |
| HCMT-500 |
1233.0 |
1001.0 |
0.7000 |
0.500 |
| HCMT-650 |
1600.0 |
837.3 |
0.9000 |
0.680 |
| HCMT-700 |
1150.0 |
799.0 |
0.6200 |
0.420 |
2.2 Evolution from CKF to HCMT-650
Based on these analyses, (NH4)2HPO4 indeed plays a key role in maintaining natural morphology and developing a pore structure during the preparation process. To further discuss the effect of (NH4)2HPO4 on the stabilized kapok fiber, structural evolution, including crystalline evolution and chemical evolution, from organic kapok to porous carbonaceous was first investigated.
2.2.1 Crystalline evolution.
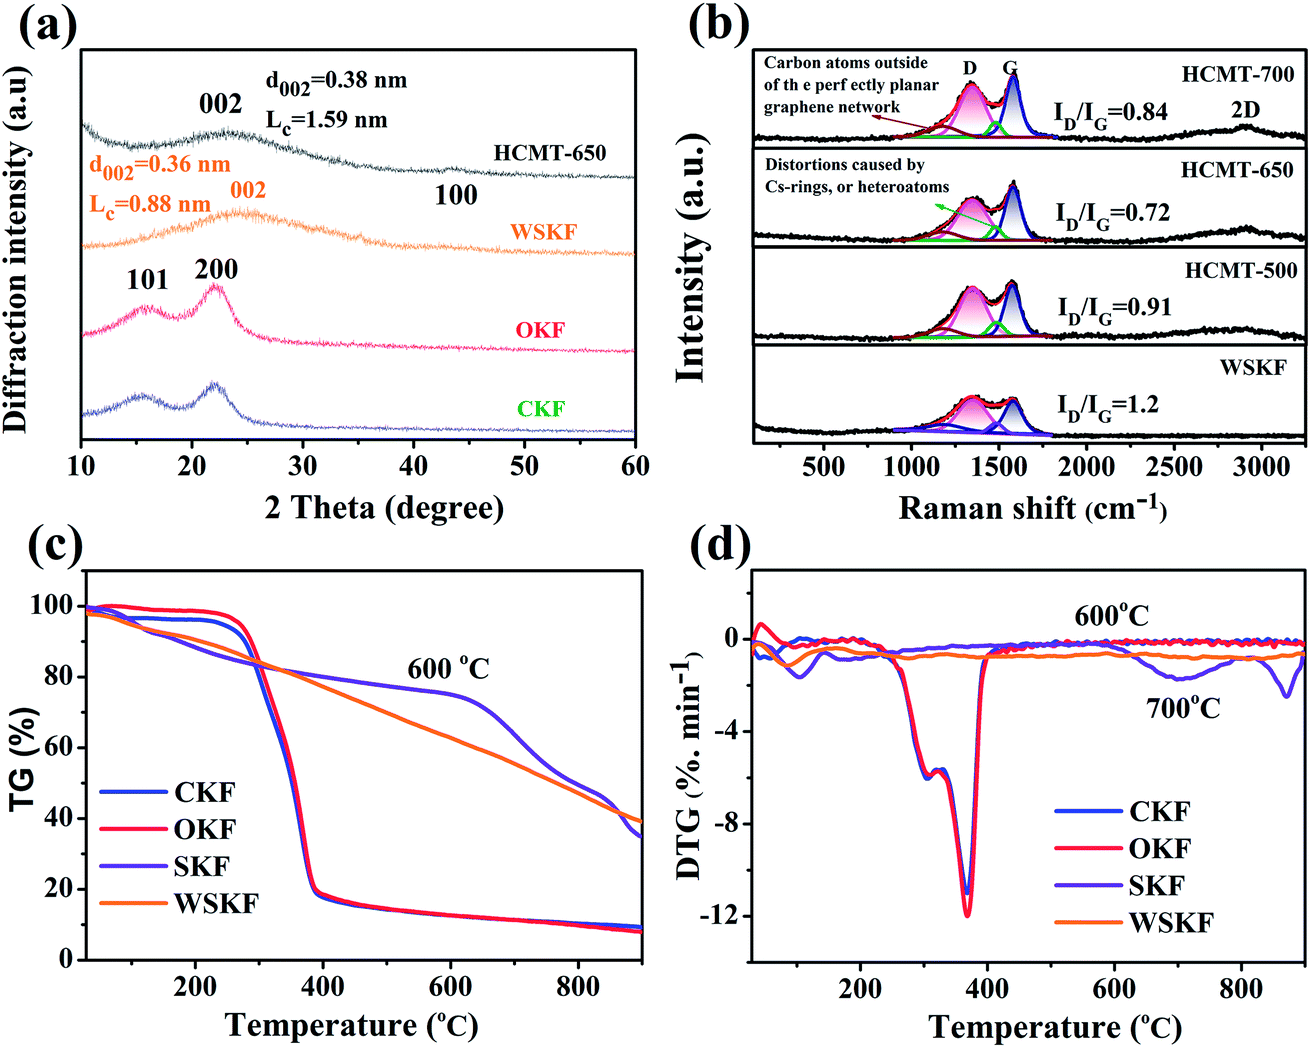
The crystalline evolution was studied by wide-angle X-ray diffraction (XRD) and Raman spectroscopy. Fig. 4a shows the XRD patterns of CKF, OKF, WSKF, and HCMT-650. For the initial kapok (CKF), there are two visible peaks around 15.8° and 22.5° corresponding to the (110) and (200) crystallographic planes, respectively, from a cellulose Iβ pattern. The broad diffraction peak (10–30°) is related to the existence of lignin, amorphous cellulose, and hemicellulose.18,25 The similarity of the diffraction pattern of OKF with that of CKF indicates that direct pre-oxidation makes no obvious effect on the crystalline evolution of kapok. Compared to the OKF, the WSKF has only one broader peak at 24.8° corresponding to the (002) turbostratic carbon structure with an interlayer spacing (d002) of 0.36 nm and stacking height (LC) of 0.88 nm.26 This result also demonstrates that (NH4)2HPO4 promotes the partial carbonization of organic kapok at 200 °C, which can be proven by the subsequent Raman analysis (Fig. 4b). The thermal decomposition behaviour of WSKF, SKF, CKF, and OKF was investigated via TG and DTG analysis under an inert (N2) atmosphere. As shown in Fig. 4c and d, the pyrolysis of CKF and OKF mainly occurs within the range of 250–400 °C, which is related to the degradation of cellulose and lignin, leading to a weight loss of 83 wt%. However, there is no visible thermal decomposition peak in the DTG of WSKF above 100 °C, and the retention of weight in TG can be up to 43 wt% after a 900 °C annealing treatment; this further indicates that the reaction of (NH4)2HPO4 with kapok facilitates the formation of a stabilized structure during pre-oxidation. The detailed changes of the chemical structure can be analysed by subsequent chemical evolution. Moreover, compared with WSKF, SKF shows a lower rate of weight loss and pyrolysis until 600 °C; this suggests that (NH4)2HPO4 can further solidify the kapok structure at high annealing temperatures.
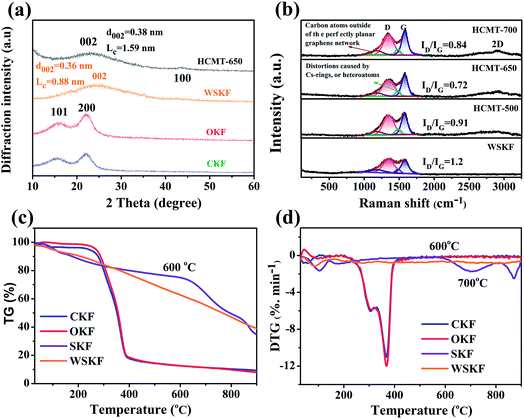 |
| | Fig. 4 (a) XRD patterns of CKF, OKF, WSKF, and HCMT-650; (b) Raman spectra of WSKF and HCMTs; (c) TG and (d) DTG curves of CKF, OKF, SKF, and WSKF under the N2 atmosphere. | |
After carbonization–activation at 650 °C, the broad (002) peak in the XRD diffraction pattern of HCMT-650 shifts from 24.8° to 22.8°; this results in a larger interlayer spacing (d002 = 0.38 nm > 0.36 nm), which may be related to the generation of the pore structure and heteroatom doping. However, the narrower (002) peak, visible increase of the stacking height (LC = 1.57 nm > 0.8 nm), and new weak (100) peak at 43.8° demonstrate a higher ordering of the carbon framework at higher temperatures.26–28 The detailed degree of graphitization in HCMTs was investigated by Raman spectroscopy. As shown in Fig. 4b, there are two characteristic peaks at around 1350 cm−1 (D band) and 1580 cm−1 (G band) in WSKF and HCMTs. The D band is attributed to the disordered structure and sp3 defect sites, mainly due to vacancies and heteroatom-doping,29–31 on the graphitic plane, whereas the G band is commonly induced by the vibration of the sp2-bonded graphitic carbons, including C![[double bond, length as m-dash]](https://www.rsc.org/images/entities/char_e001.gif) C and CN, from the graphitic structures; this has been proven by the subsequent XPS analysis.31–34 Additionally, two visible peaks at 1180 and 1486 cm−1 in WSKF and HCMTs are deconvoluted in the overall Raman spectrum by the Origin Software (Gaussian Multi-peaks Fit), ascribed to the carbon atoms outside an ideal planar graphene (sp2- and sp3-hybridized carbon structure) and the distortions caused by doped heteroatoms or five rings in the graphene-type structures (N- and P-doping), respectively.10 With an increase in the activation temperature, the intensity of the Raman band at 1350 cm−1 first decreases and then increases; this may be the result of a compromise between an increased ordering of the carbon framework (650 °C) and defect introduction as a result of pore generation with an increase of temperature (700 °C).33,35,36 To further qualitatively analyse the number of defects and the degree of graphitization of the carbon materials, the ID/IG ratios in WSKF and HCMTs were calculated, as shown in Fig. 4b. Although HCMT-700 has the highest intensity of the G band, HCMT-650 possesses a relatively higher degree of graphitization in terms of ID/IG that will boost the electron transportability and reduce interfacial charge transfer resistance.26,37
C and CN, from the graphitic structures; this has been proven by the subsequent XPS analysis.31–34 Additionally, two visible peaks at 1180 and 1486 cm−1 in WSKF and HCMTs are deconvoluted in the overall Raman spectrum by the Origin Software (Gaussian Multi-peaks Fit), ascribed to the carbon atoms outside an ideal planar graphene (sp2- and sp3-hybridized carbon structure) and the distortions caused by doped heteroatoms or five rings in the graphene-type structures (N- and P-doping), respectively.10 With an increase in the activation temperature, the intensity of the Raman band at 1350 cm−1 first decreases and then increases; this may be the result of a compromise between an increased ordering of the carbon framework (650 °C) and defect introduction as a result of pore generation with an increase of temperature (700 °C).33,35,36 To further qualitatively analyse the number of defects and the degree of graphitization of the carbon materials, the ID/IG ratios in WSKF and HCMTs were calculated, as shown in Fig. 4b. Although HCMT-700 has the highest intensity of the G band, HCMT-650 possesses a relatively higher degree of graphitization in terms of ID/IG that will boost the electron transportability and reduce interfacial charge transfer resistance.26,37
2.2.2 Chemical evolution.
Along with the crystalline evolution, the chemical evolution was also investigated. The elemental composition of CKF, WSKF, and HCMT-650 was first investigated by elemental analysis (EA), as listed in Table 2. It is shown that the contents of carbon, oxygen, nitrogen, and phosphorus in the CKF are about 45.37 wt%, 47.81 wt%, 0.34 wt%, and 0.07 wt%, respectively. After pre-oxidation, a significant increase in the nitrogen content is observed in the WSKF (14.88 wt%), indicating that large quantities of N from (NH4)2HPO4 have been doped into the chemical structure of kapok.38 However, the content of phosphorus in WSKF (0.5 wt%) is mainly attributed to adsorption and the residue of the decomposition product of (NH4)2HPO4;39 after carbonization–activation, the contents of oxygen and nitrogen in HCMT-650 respectively decrease to 12.05 wt% and 6.67 wt%. Moreover, the content of carbon increases to 78.4 wt%. Notably, phosphorus (1.06 wt%) has also been doped into the carbon skeleton at higher carbonization and activation temperatures. This heteroatom doping can provide more active sites for electrochemical adsorption.
Table 2 The elemental analysis and XPS analysis-C 1s of the CKF, WSKF, and HCMT-650
| Elemental analysis (wt%) |
XPS analysis-C 1s (%) |
| Sample |
C |
H |
O |
N |
P |
sp2-C |
sp3-C |
C–O/C–N |
CO |
C–O–CO |
| CKF |
45.37 |
6.41 |
47.81 |
0.34 |
0.07 |
16.87 |
66.79 |
10.47 |
3.29 |
2.58 |
| WSKF |
49.30 |
6.48 |
28.84 |
14.88 |
0.50 |
21.02 |
50.82 |
19.84 |
6.30 |
2.03 |
| HCMT-650 |
78.40 |
1.82 |
12.05 |
6.67 |
1.06 |
60.22 |
27.12 |
5.83 |
6.84 |
— |
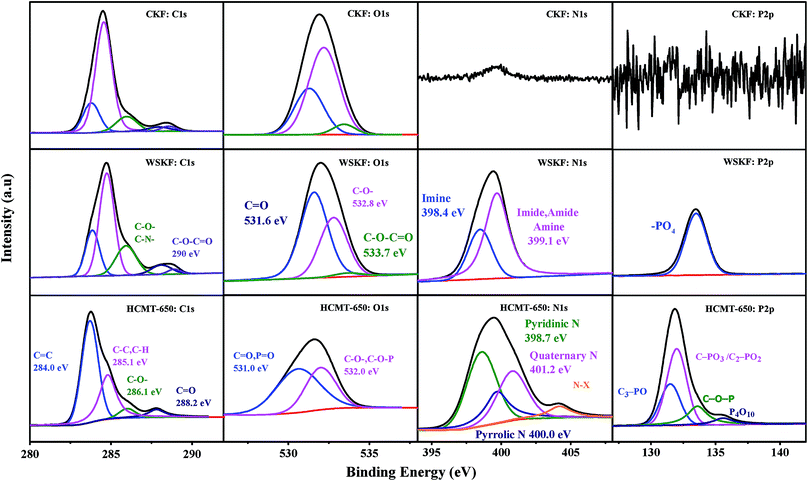
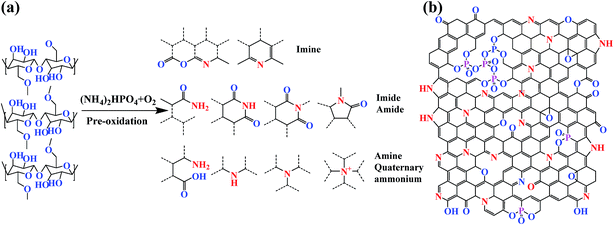
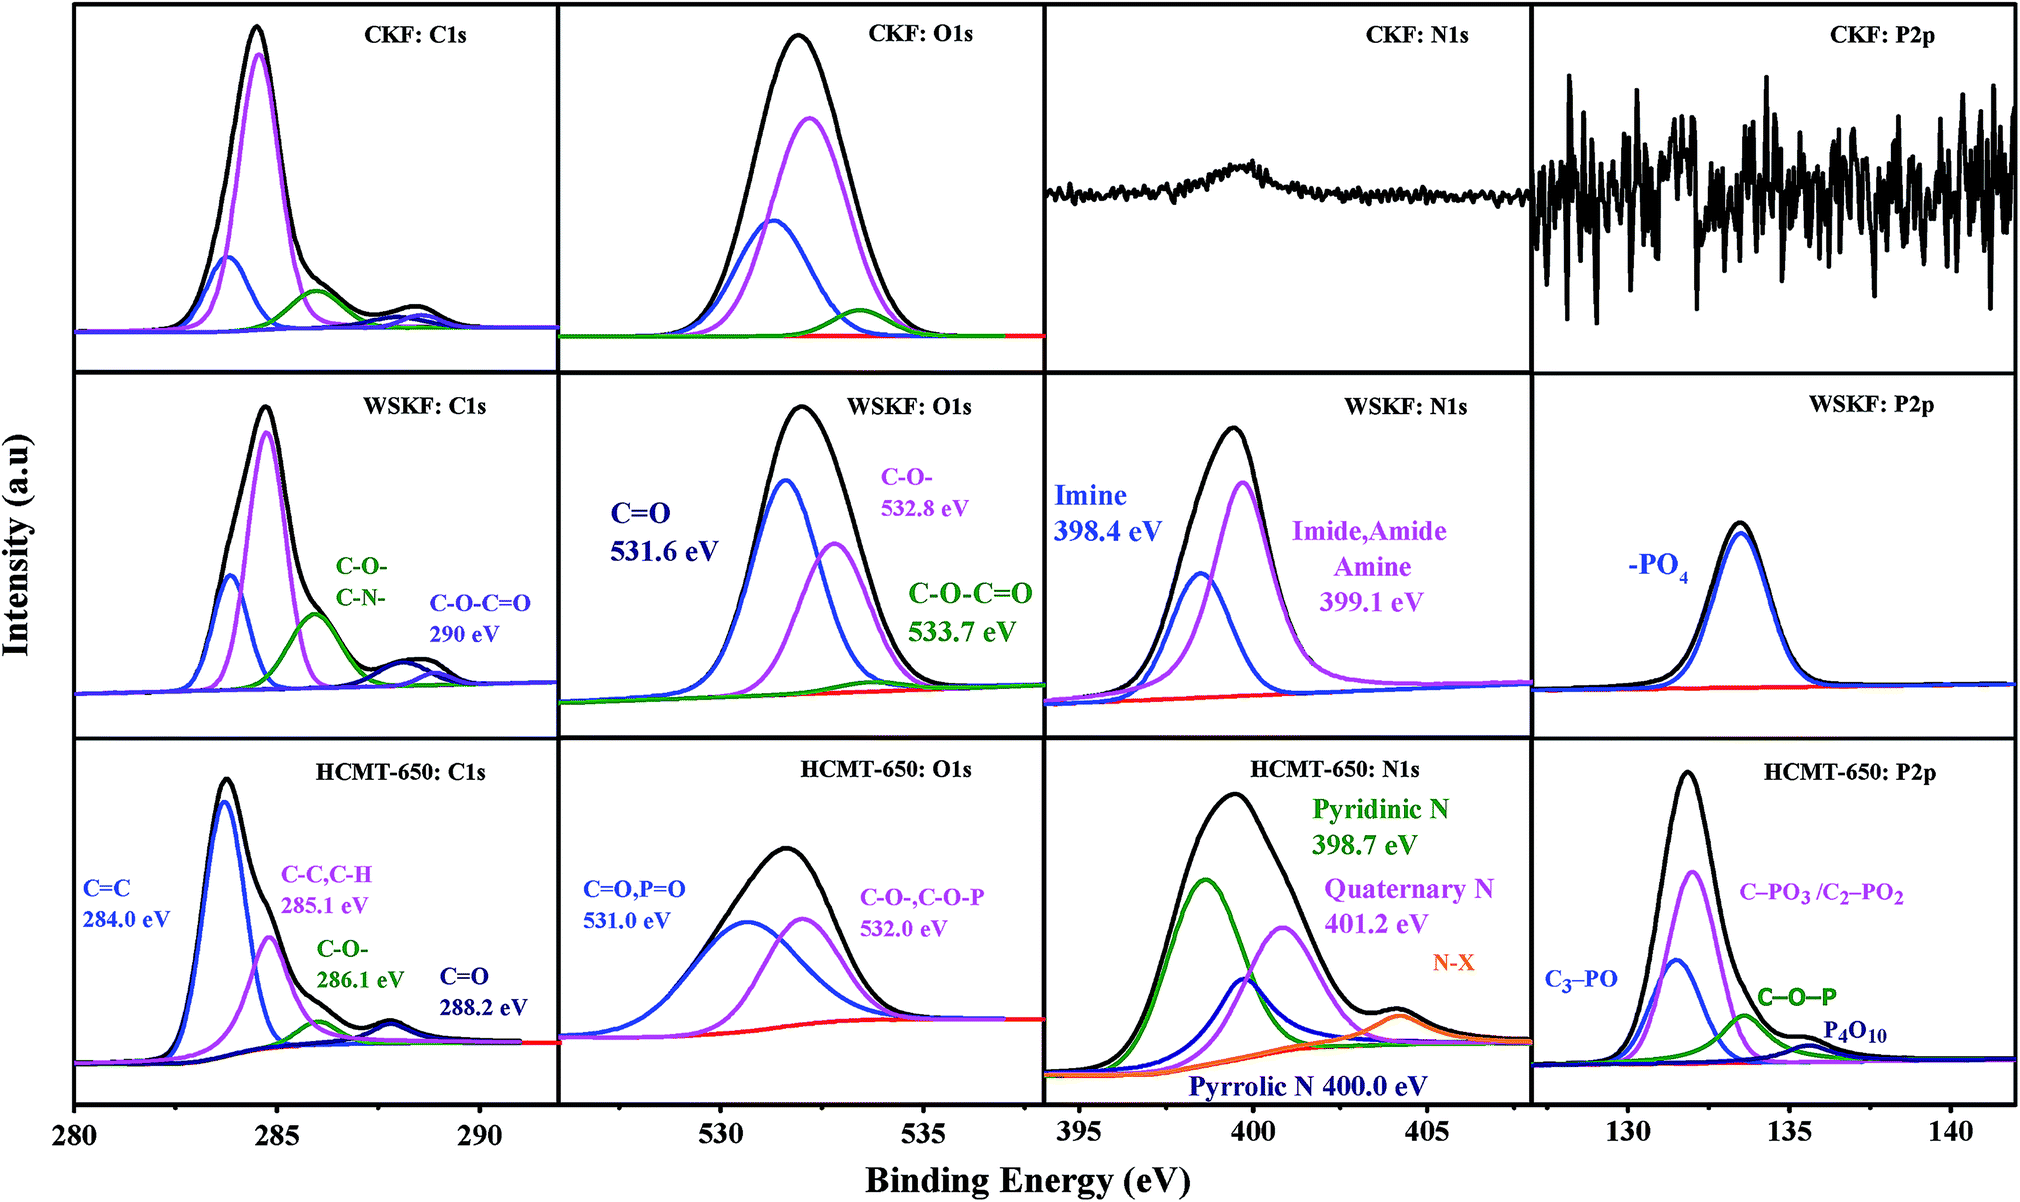
The detailed chemical composition and chemical status of C, O, N, and P in the CKF, WSKF, and HCMT-650 were determined by XPS measurements. As shown in the survey spectra (Fig. S3†), two obvious peaks at 284.6 eV (C 1s) and 533 eV (O 1s) are distinguished in all the samples, whereas the N 1s peak at 401 eV and P 2p peak at 132 eV can only be observed in WSKF and HCMT-650, which is consistent with the elemental analysis (EA). Fig. 5 shows a high-resolution spectrum of C 1s, O 1s, N 1s, and P 2p in CKF, WSKF, and HCMT-650. The relative content of different carbon functional groups in CKF, WSKF, and HCMT-650 was calculated, as presented in Table 2. For the initial kapok (CKF), the peaks of sp2-C (284.0 eV), sp3-C (285.0 eV), C–O– (286.1 eV), CO (288.2 eV), and C–O–CO (290.0 eV) are ascribed to cellulose, hemicellulose, and lignin.40 After pre-oxidation, the relative contents of sp2-C (284.0 eV) in WSKF increase; this is in accordance with the XRD analysis. In the O 1s spectra, the intensity of CO (531.6 eV) increases and the content of C–O–CO significantly decreases due to hydrogenation and oxidative cyclization.41,42 In addition, large N elements from (NH4)2HPO4 are doped into the kapok structure of WSKF. The high-resolution spectrum of N 1s is deconvoluted into two peaks at 398.3 eV and 399.1 eV corresponding to –CN–C–(imine) and –C–N–(imide, amide, amine), respectively.43 As shown in Fig. 6a, these CN/C–N– bonds crosslinked with CO and CC– are conducive to converting the linear structure into the cyclic structure by polymerization, oxidative cyclization, and random scission reaction, resulting in a more stabilized structure.44 After further carbonization–activation, the relative contents of sp2-C in HCMT-650 have been increased to 64.4%; this is related to the increased ordering of the carbon framework. Moreover, –CN–(imine) and –C–N–(imide, amide, and amine) in WOKFDAP are converted into the pyridinic-N (398.7 eV), pyrrolic/pyridone-N (400.0 eV), quaternary-N (401.2 eV), and pyridine-N-oxide (403.6 eV), respectively. As shown in Fig. 6b, pyridinic-N is a six-membered ring of C atoms, where the sp2-hybridized N atom has one pair of lone electrons and can afford a Pπ electron to the graphitic system; on the other hand, pyrrolic N belongs to a five-membered ring of C atoms and possesses two pairs of lone electrons.26 Both pyridinic-N and pyrrolic-N have a relatively high reactivity for oxidation–reduction reaction. Moreover, quaternary-N is denoted as graphitic N, and the N atom incorporated into the graphene hexagonal ring can contribute two Pπ electrons to the graphitic system that can promote the charge-transfer rate at the electrode/electrolyte interface.10,45–48
 |
| | Fig. 5 The high-resolution spectra of C 1s, O 1s, N 1s, and P 2p in CKF, WSKF, and HCMT-650. | |
 |
| | Fig. 6 (a) Schematic for the synthesis of nitrogen-containing functional groups and possible cyclization structures in WSKF and (b) schematic of the binding conditions of carbon, oxygen, nitrogen, and phosphorus in HCMT-650. | |
Furthermore, P-doing can only be observed in HCMT-650. As shown in Fig. 5 and 6b, the high-resolution spectrum of P 2p in HCMT-650 has four distinguished phosphorous signals: C3–PO groups (132.2 eV); C–PO3 or C2–PO2 groups (133.1 eV); C–O–P type groups (134.0 eV), such as (CO)3PO, (CO)2PO2, and (CO)PO3; and phosphorus pentoxide (P4O10) (136.0 eV).49–51 Among them, the formation of C–O–P and (P4O10) can not only result in the disturbance of the delocalized electrons,39,51,52 but also act as bridges, preventing the shrinkage of the pores and collapse of the hollow structure.51,53
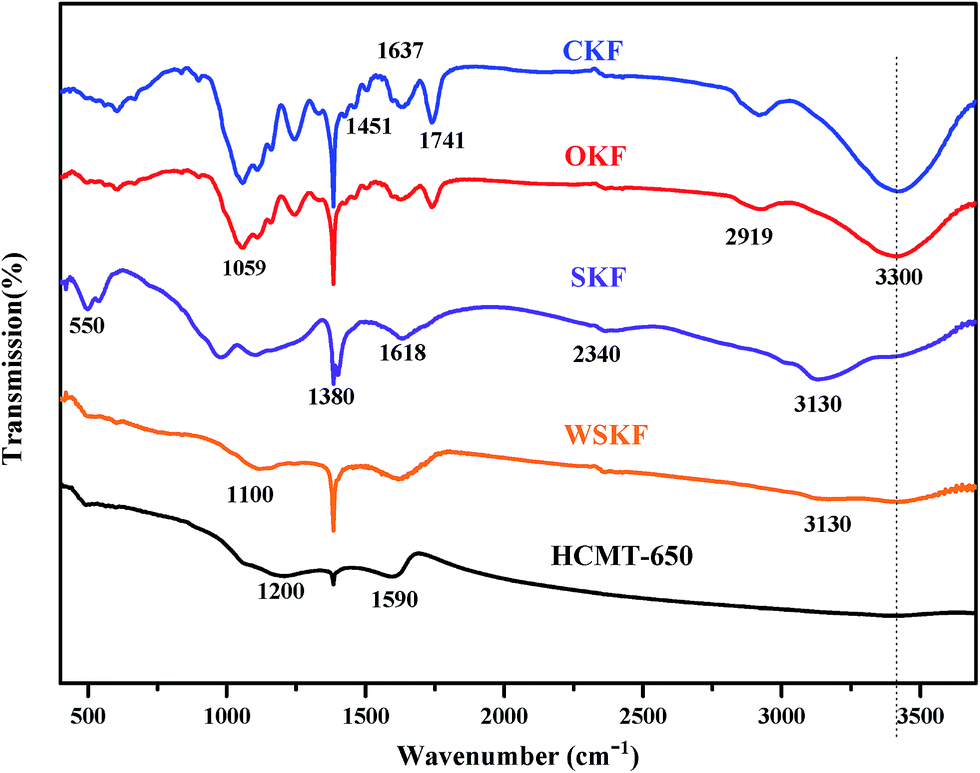
To further explain the chemical evolution from the initial kapok to the final carbon microtubes, the FTIR spectra of the initial CKF, stabilized WSKF, and HCMT-650 was characterized, as shown in Fig. 7. For the CKF, the main characteristic bands of CKF are the stretching vibration of O–H at 3400 cm−1, the vibrations of the aliphatic CH groups at 2910 cm−1, the stretching vibration of CO at 1720 cm−1 (carboxyl, aldehyde and ketone) and at 1637 cm−1 (the CO conjugated with aromatic rings), the bending vibration of C–H2 at 1451 cm−1, the bending vibration of C–H at 1386 cm−1, and the stretching vibration of C–O– at 1075 cm−1 (ether and alcohol). For the stabilized WSKF and SKF, the peaks of the aliphatic CH groups (2910 cm−1 and 1451 cm−1) and the CO groups in the linear structure (1720 cm−1) completely disappear, and the intensity of the peaks at 3400 cm−1 and 1075 cm−1 significantly decreases. Moreover, the adsorption band of CO shifts from 1637 cm−1 to 1614 cm−1; this is mainly attributed to the predominantly mixed modes of CC, C–C, and CN (imine) stretching vibration and –N–H (imide, amide, and amine) bending in the aromatic rings. These nitrogen-containing functional groups are indicated by the presence of the bands at 3300, 3130, 1386, 1100, and 550 cm−1, corresponding to the stretching vibration of N–H in primary amines, the stretching vibration of N–H in imides, the stretching vibration of CN– in imine, the out of plane bending of C–N + N–H, and the plane bending of C–N–C in imide, respectively. Usually, these bonds conjugated with the aromatic rings are not easily pyrolyzed; this results in a more stabilized structure.44,54–57 After carbonization and activation at 650 °C, the peak at 1586 cm−1 in HCMT-650 is mainly assigned to the combination of CC and CN stretching and N–H (pyridinic-N and quaternary-N) in-plane bending.54,58,59 In addition, the further reduced intensity of the peak at 3400 cm−1, 1386 cm−1, and 1075 cm−1 in HCMT-650 is associated with the increased ordering of the carbon framework. Moreover, the new peak at 1250 cm−1 is ascribed to P-doping (P4O10), which may be conducive to the preservation of the natural morphology.
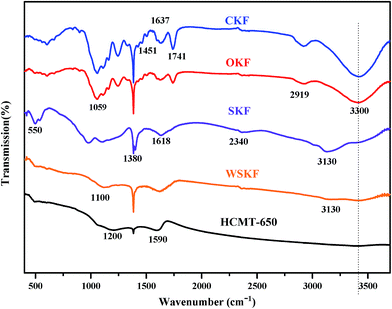 |
| | Fig. 7 The FTIR spectra of the initial CKF, WSKF, SKF, and HCMT-650. | |
2.3 Electrochemical performance
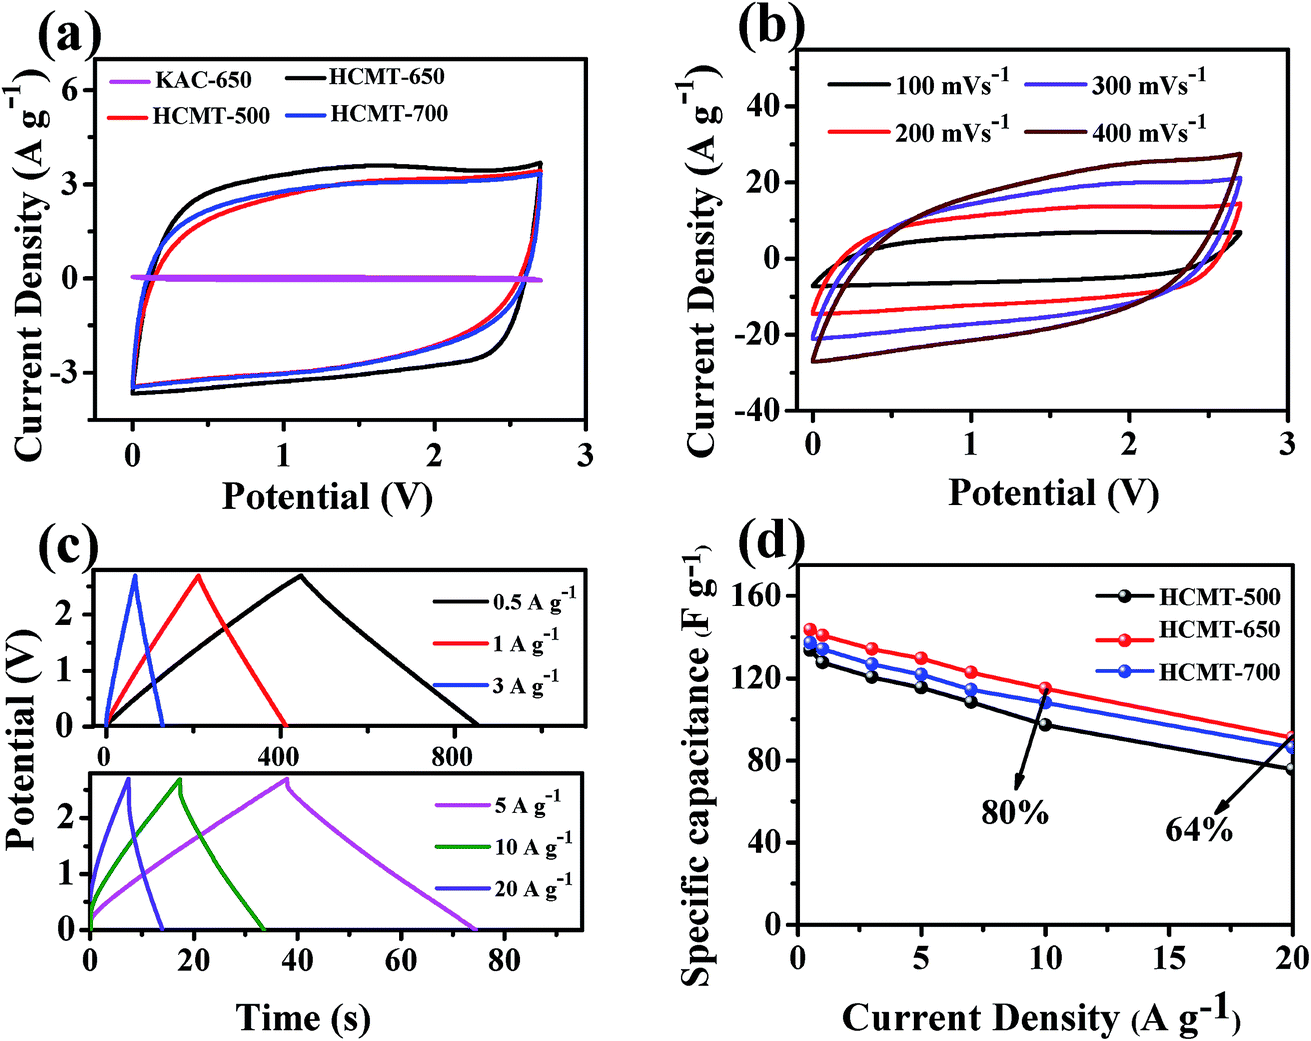
Based on the abovementioned analysis, it can be concluded that HCMT-650 possesses a high specific surface area, a unique hollow structure, and sufficient active sites from heteroatom doping and some graphitized structure, including CC and CN. Fig. 8a and S4† show respectively the simulated diagram and the SEM image of the electrode based on HCMT-650. It can be easily found that the hollow fibers are still mostly intact. The special tube herein can act as a continuous electron pathway and a channel to facilitate the ion transport and access to the whole surface area. Cyclic voltammetry (CV) and galvanostatic charge/discharge (GCD) analysis were conducted in 1 M TEABF4/PC. As shown in Fig. 9a, the cyclic voltammetry (CV) curves of HCMTs exhibit a quasi-rectangular shape at a scan rate of 50 mV s−1 in the voltage window of 0–2.7 V, except for the case of KAC-650, indicating a near ideal EDL behaviour. Notably, the slight bumps, as shown in Fig. 9a, might be caused by the redox reactions of the oxygen and nitrogen functional groups.60 Moreover, it is clearly found that HCMT-650 shows a more quasi-rectangular shape and its encircled area is largest, which may be related to its highest specific surface areas. Even at a high scan rate of 400 mV s−1, the CV curves of HCMT-650 with an ultrahigh microporosity still exhibit a near rectangular-like shape (Fig. 9b), revealing a fast and efficient ion transport due to its special chemical and physical structure.60 The charge–discharge curves of HCMT-650 at different current densities are shown in Fig. 9c. These curves are quasi-linear and nearly symmetrical, demonstrating an excellent capacitive behavior, which is in accordance with the cyclic voltammetry result. Fig. 9d summarizes the gravimetric specific capacitance of HCMTs calculated from the galvanostatic charge/discharge curves at a current density ranging from 1 to 10 A g−1. In comparison, HCMT-650 exhibits best electrochemical performance and rate capability, which is ascribed to the synergistic effect of the unique hollow structure, the highest specific surface areas, and the sufficient surface chemistry. The specific capacitance of 140.7 F g−1 (40.8 F cm−3 at 3 mA cm−2) in HCMT-650 is achieved at 1 A g−1, and the high capacitance retention can be up to 82% and 64% at a higher current density of 10 A g−1 (30 mA cm−2) and 20 A g−1 (60 mA cm−2), respectively, confirming the outstanding capacitance and high-rate performances. The electrochemical performance of HCMT-650 is higher than that of the conventional fibers derived from PAN or at least comparable to those of the reported hierarchical porous carbon materials (Table 3).60–67
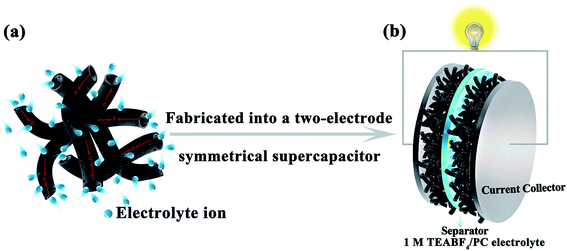 |
| | Fig. 8 The simulated diagram of the electrode materials and a two-electrode symmetrical supercapacitor. | |
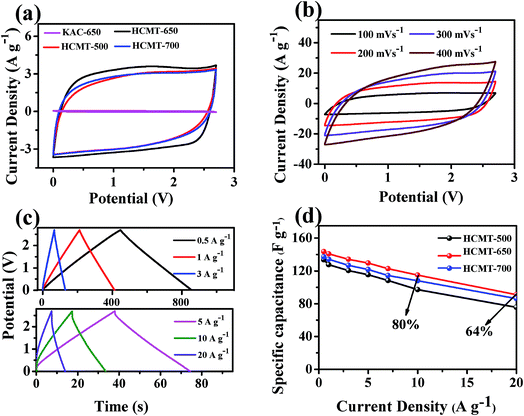 |
| | Fig. 9 The electrochemical performance characteristics of KAC-650 and HCMTs measured in a symmetric two-electrode system in the 1 M TEABF4/PC electrolyte: the CV curves of (a) KAC-650 and HCMTs at 50 mV s−1 and (b) HCMT-650 at different scan rates; (c) galvanostatic charge/discharge curves of HCMT-650 at six current densities; and (d) specific capacitances of HCMTs at different current densities. | |
Table 3 The comparison of the specific capacitance and rate capability of different porous carbon materials in the literature
| Materials |
S
BET (m2 g−1) |
V
micr/Vtotal |
Activating agent |
C
S (F g−1) |
Electrolyte (1 M) |
Retention |
Ref. |
| HPC |
3548 |
40% |
KOH |
159 (2 mV s−1) |
TEABF4/PC |
— |
60
|
| Lotus-HA |
3037 |
18% |
KOH |
185 (1 A g−1) |
TEABF4/AN |
93% (10 A g−1) |
61
|
| KPAC-800 |
2988 |
40% |
H3PO4 + KOH |
143 (1 A g−1) |
TEABF4/AN |
80% (10 A g−1) |
62
|
| GPCNF-SC |
2026 |
14% |
ZnCl2 |
142 (1 A g−1) |
TEABF4/AN |
81% (10 A g−1) |
63
|
| aPG-10 |
2582 |
— |
KOH |
126 (1 A g−1) |
TEABF4/AN |
— |
64
|
| GAC10 |
1266 |
— |
— |
99.1 (1 A g−1) |
TEABF4/PC |
74.5% (6 A g−1) |
65
|
| F1320 |
2441 |
63% |
KOH |
115.4 (10 mV s−1) |
TEABF4/PC |
— |
66
|
| N-rGO |
677 |
— |
— |
58 (1 A g−1) |
TEABF4/PC |
89% (10 A g−1) |
67
|
| HCMT-650 |
1600 |
70% |
(NH4)2HPO4 |
141 (1 A g−1) |
TEABF4/PC |
82% (10 A g−1) |
This work |
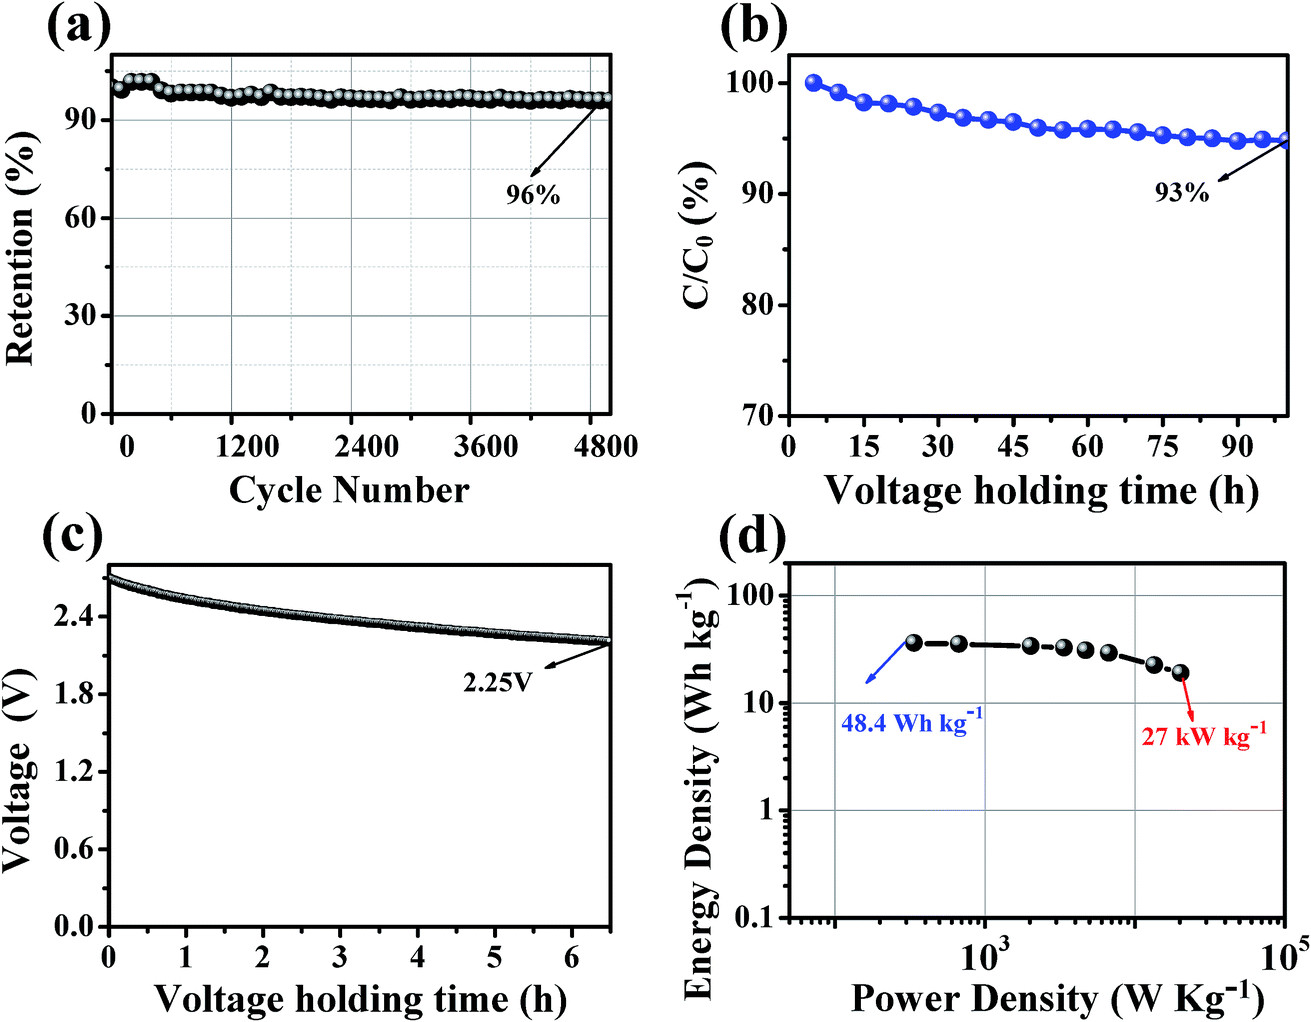
The stability of the supercapacitor based on HCMT-650 was evaluated by the cycling stability, floating test, and voltage holding. As shown in Fig. 10a, the capacitance of HCMT-650 remains at almost 96% of the initial capacitance after 5000 cycles at a current density of 5.0 A g−1, indicating a good cycling stability. Fig. 10b displays the regression of the cell capacitance with voltage floating over a time of 100 h at 2.7 V and 3 A g−1. A capacitance decrease of 7% can be found, which is within the acceptable values for a potential electrode for electrochemical applications. Voltage holding test is related to the self-discharge of supercapacitors mainly caused by the redox reactions. As shown in Fig. 10c, the voltage decreases from 2.7 to 2.25 V after keeping open-circuit for 6.5 h. The voltage decay might be mainly attributed to the irreversible redox reactions resulting from the doped heteroatoms (N, O, and P). However, the supercapacitor based on HCMT-650 as an electrode shows relatively stable electrochemical performances.
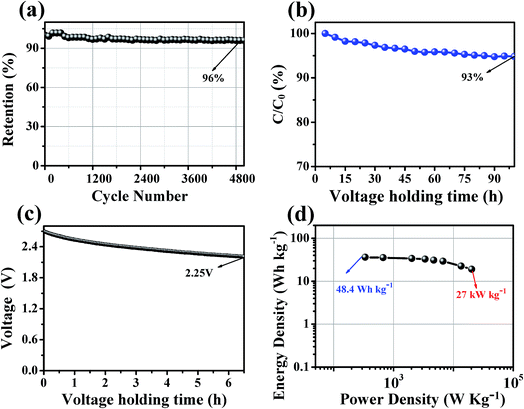 |
| | Fig. 10 (a) Cycling stability at a current density of 5 A g−1 up to 5000 cycles for HCMT-650; (b) long-time floating stability testing at 2.7 V for HCMT-650; (c) self-discharging curves of the open-circuit voltage changes over time for HCMT-650; and (d) the Ragone plot of the symmetrical system for HCMT-650. | |
To investigate the ion transport kinetics within the electrodes and verify the role of the hollow structure, electrochemical impedance spectroscopy (EIS) was performed, and the results are shown in Fig. S5a.† In the Nyquist plot, the almost vertical lines in a low-frequency range and much shorter Warburg region in a middle-frequency range indicate the fast ion transport and a smaller ion diffusion resistance in HCMT-650, leading to a smaller IR drop of 0.15 V at 5.0 A g−1 (Fig. S5b†). The fast ion kinetics is mainly attributed to the special hollow structure and good wettability, resulting from heteroatom doping, which allows the HCMT-650 electrode to deliver a high-power capability. Fig. 10d shows the Ragone plot of HCMT-650. The energy density of the HCMT-650-based supercapacitor can reach 48.3 W h kg−1 (14.0 W h L−1) at a power density of 450 W kg−1 (130.5 W h L−1) in the TEABF4/PC electrolyte. Even at a very high power density of 27 kW kg−1 (7.83 kW L−1), a specific energy of 25.5 W h kg−1 (7.4 W h L−1) can still be achieved, indicating a high power capability. Based on the abovementioned electrochemical analysis, the synthesized HCMT-650 will be a superior electrode material for high-rate and cost-effective supercapacitors.
3. Conclusions
In summary, N–P co-doped hollow carbon microtubes derived from kapok with high specific surface areas (1600 cm2 g−1) can be synthesized using (NH4)2HPO4 as a crosslinking agent, porogen, and nitrogen/phosphorus source. The formation of the turbostratic carbon structure and oxidative cyclization structure consisting of carbon (49.3 wt%), nitrogen (14.88 wt%), and oxygen (28.84 wt%) in the pre-oxidized kapok indicates that (NH4)2HPO4 plays a key role in the transformation from the organic kapok into the stabilized kapok, which provides a new option for the design of other biomass-based carbon materials maintaining their natural micromorphology. In application, using the obtained HCMT-650 as the electrodes, the as-assembled supercapacitor device in 1 M TEABF4/PC exhibits an excellent rate performance (140 F g−1 at 1.0 A g−1 and a capacitance retention of 82% at 10.0 A g−1) and a high energy/power density (48.3 W h kg−1 at 450 W kg−1 and 27 kW kg−1 at 25.5 W h kg−1). Moreover, this kapok-based hollow carbon microtube is very promising material in other applications, such as in energy storage, environmental protection, and catalysis, due to its good transmission and adsorption performance.
4. Experimental
4.1 Synthesis of HCMT-650
The kapok fiber was first washed by a sodium chlorite solution (1.5 wt%) to remove the surface paraffin as well as ash content and dried at 60 °C overnight in a vacuum oven to obtain the cleaned kapok (denoted as CKF). Then, the dried CKF (5 g) was impregnated with a 40 wt% (NH4)2HPO4 (DAP) solution (weightDAP/weightCKF = 3![[thin space (1/6-em)]](https://www.rsc.org/images/entities/char_2009.gif) :1), sealed in vacuum, dried in an oven at 115 °C for 12 h to ensure that (NH4)2HPO4 fully penetrated into the internal tube of CKF, and then dried at 115 °C. The dried sample was subsequently pre-oxidized under the air atmosphere at 200 °C for 2 h to prepare the stabilized kapok fiber (SKF), and the SKF washed with deionized water was marked as WSKF. After this, the obtained SKF was heated in a furnace under an argon atmosphere at an elevating rate of 2 °C min−1 from room temperature to a specified temperature in the range of 500–700 °C for 1 h and then cooled down under an argon atmosphere to room temperature. Finally, the resulting sample was impregnated in distilled water at 115 °C for 48 h, washed with distilled water until the pH of the filtrate became neutral, and then dried at 115 °C for 24 h. The prepared products are denoted as HCMT-500, HCMT-650, and HCMT-700. In comparison, the CKF without impregnation of (NH4)2HPO4 was pre-oxidized (OKF) and carbonized in the same way. The final product was denoted as KAC-650. The PKAC-650 was prepared by the direct pyrolysis of CKF with the impregnation of (NH4)2HPO4.
:1), sealed in vacuum, dried in an oven at 115 °C for 12 h to ensure that (NH4)2HPO4 fully penetrated into the internal tube of CKF, and then dried at 115 °C. The dried sample was subsequently pre-oxidized under the air atmosphere at 200 °C for 2 h to prepare the stabilized kapok fiber (SKF), and the SKF washed with deionized water was marked as WSKF. After this, the obtained SKF was heated in a furnace under an argon atmosphere at an elevating rate of 2 °C min−1 from room temperature to a specified temperature in the range of 500–700 °C for 1 h and then cooled down under an argon atmosphere to room temperature. Finally, the resulting sample was impregnated in distilled water at 115 °C for 48 h, washed with distilled water until the pH of the filtrate became neutral, and then dried at 115 °C for 24 h. The prepared products are denoted as HCMT-500, HCMT-650, and HCMT-700. In comparison, the CKF without impregnation of (NH4)2HPO4 was pre-oxidized (OKF) and carbonized in the same way. The final product was denoted as KAC-650. The PKAC-650 was prepared by the direct pyrolysis of CKF with the impregnation of (NH4)2HPO4.
4.2 Physicochemical characterization
The morphology was examined by scanning electron microscopy (SEM) using the JSM-700 microscope instrument at an accelerating voltage of 10.0 kV. The microstructures of the samples were observed using a Tecnai G2 F20 S-Twin field-emission transmission electron microscope (FETEM) operated at an acceleration voltage of 200 kV. N2 adsorption isotherms were obtained at 77 K using a micromeritics ASAP 2020 analyzer. The samples were degassed at 200 °C for 8 h prior to the measurement. The specific surface area was calculated by the Brunauer–Emmett–Teller (BET) method using the adsorption data in the relative pressure (P/P0) range of 0.05–0.2. The pore size distribution (PSD) was analyzed using a nonlocal density functional theory (NLDFT) model speculating the cylinder pore geometry from the adsorption data. The powder X-ray diffraction pattern was obtained using an X-ray diffractometer (Bruker D8) with Cu Kα radiation ( 0.15406 nm). The Raman spectra were obtained at ambient temperature via a Nanofinder 3.0 Raman spectrometer (Tokyo Instrument) using a visible laser beam of 488 nm as the excitation source. The thermogravimetric (TG) and derivative thermogravimetric (DTG) analyses were carried out using a Perkin-Elmer TG/DTA-6300 instrument in the temperature range of 30–900 °C at a heating rate of 10 °C min−1 under a N2 atmosphere with a flow rate of 20 mL min−1. The element analysis was conducted using a Vario EL cube elemental analyzer, and the P content was measured by inductively coupled plasma emission spectrometry. The X-ray photoelectron spectroscopy (XPS) spectra were obtained using an AXIS Ultra DLD spectrometer with an excitation source of Mg Kα (1486.6 eV). The chemical structure of nanofibers was investigated using a Nicolet Magna IR560F FTIR spectrometer in the range of 600–4000 cm−1 with a resolution of ±4 cm−1 in the transmission mode.
4.3 Electrochemical tests
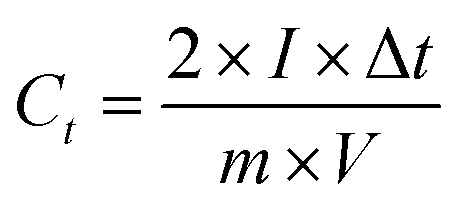
The electrochemical performances of the electrode materials were characterized by cyclic voltammetry (CV) and galvanostatic charge–discharge using a CHI760D electrochemical workstation and electrochemical impedance spectroscopy (EIS) via an Autolab workstation (PGSTSAT 302N, Metrohm) in a two-electrode system with 1 M TEABF4/PC as the electrolyte. The working electrode was prepared by coating a mixture slurry of 90 wt% active material, 6 wt% carbon black, and 4 wt% polytetrafluoroethylene (PTFE) onto an aluminum foil and then dried under vacuum at 120 °C for 6 h. The mixture slurry is prepared by co-dispersion of the abovementioned components in deionized water via ultrasonication (100 W) for 5 h. After drying, the electrodes were cut into disks. The loading density was controlled at 3 mg/0.625 cm2 (the thickness of a single disk is 0.15 mm, ρelectrode = 0.32 g cm−3, and ρ = ρelectrode × 0.9). The two symmetrical electrodes were assembled into a CR2032 coin cell with polypropylene as a separator in a Mikrouna Super glove box under a dry argon atmosphere. The used electrolyte in the coin cell is TEABF4/PC. The cyclic voltammetry and galvanostatic charge–discharge tests for the coin cell were performed in the potential range of 0–2.7 V. The gravimetric capacitance of the single electrode was calculated according to eqn (1):| |  | (1) |
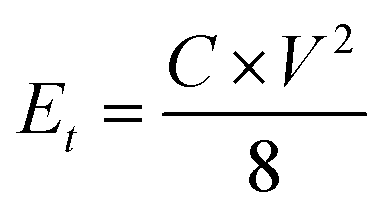
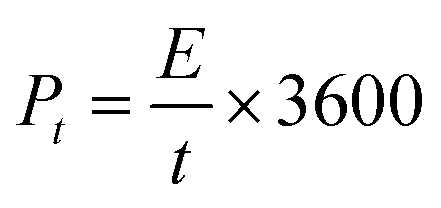
where I [A] is the constant discharging current, Δt [V] is the potential change within the discharge time Δt [s], and m [g] is the mass load of one carbon electrode. The energy density and power density of symmetrical supercapacitor systems were calculated using eqn (2) and (3):68| |  | (2) |
| |  | (3) |
where Et [W h kg−1] is the specific energy density, Pt [W kg−1] is the specific power density of the symmetrical supercapacitor system, C [F g−1] is the specific capacitance of the total symmetrical system, Δt [V] is the cell voltage for charging and discharging, and t [h] is the discharge time.
The volumetric capacitance is calculated using the eqn (4) and (5):
where the
Cv is the volumetric capacitance (F cm
−3) and
ρelectrode is the density of the electrode.
69
Voltage holding was realized by first charging up to 2.7 and then keeping open-circuit for 6.5 h. The floating test was performed as follows: after every 5 h of aging, five charge–discharge cycles at the maximum voltage of 2.7 V with the current density of 3 A g−1 were conducted, and the specific capacitance was calculated from the first and fifth discharge cycle. These sequences were repeated 20 times. The total floating time was 100 h.70
Conflicts of interest
There are no conflicts of interest to declare.
Acknowledgements
We gratefully acknowledge the support to this study provided by the National Natural Science Foundation of China (No. 51302281, No. 51402324, No. 51402325), Youth Innovation Promotion Association of CAS, and Natural Science Foundation of Shanxi Province (2015021077).
References
- J. Kong, N. R. Franklin, C. W. Zhou, M. G. Chapline, S. Peng, K. J. Cho and H. J. Dai, Science, 2000, 287, 622–625 CrossRef CAS PubMed.
- A. S. Arico, P. Bruce, B. Scrosati, J. M. Tarascon and W. Van Schalkwijk, Nat. Mater., 2005, 4, 366–377 CrossRef CAS PubMed.
- E. Raymundo-Pinero, M. Cadek and F. Beguin, Adv. Funct. Mater., 2009, 19, 1032–1039 CrossRef CAS.
- S. Wang, Z. Ren, J. Li, Y. Ren, L. Zhao and J. Yu, RSC Adv., 2014, 4, 31300–31307 RSC.
- Z. Li, W. Lv, C. Zhang, B. Li, F. Kang and Q.-H. Yang, Carbon, 2015, 92, 11–14 CrossRef CAS.
- R.-L. Liu, Y. Liu, X.-Y. Zhou, Z.-Q. Zhang, J. Zhang and F.-Q. Dang, Bioresour. Technol., 2014, 154, 138–147 CrossRef CAS PubMed.
- J. R. Miller and P. Simon, Science, 2008, 321, 651–652 CrossRef CAS PubMed.
- Q. Wang, J. Yan and Z. Fan, Energy Environ. Sci., 2016, 9, 729–762 CAS.
- O. Barbieri, M. Hahn, A. Herzog and R. Kotz, Carbon, 2005, 43, 1303–1310 CrossRef CAS.
- Z. Liu, K. Xiao, H. Guo, X. Ning, A. Hu, Q. Tang, B. Fan, Y. Zhu and X. Chen, Carbon, 2017, 117, 163–173 CrossRef CAS.
- Y. Li, Z. Li and P. K. Shen, Adv. Mater., 2013, 25, 2474–2480 CrossRef CAS PubMed.
- Y. Zhao, M. Liu, X. Deng, L. Miao, P. K. Tripathi, X. Ma, D. Zhu, Z. Xu, Z. Hao and L. Gan, Electrochim. Acta, 2015, 153, 448–455 CrossRef CAS.
- M. Liu, J. Qian, Y. Zhao, D. Zhu, L. Gan and L. Chen, J. Mater. Chem., 2015, 3, 11517–11526 RSC.
- W. Shen, T. Hu, P. Wang, H. Sun and W. Fan, ChemPlusChem, 2014, 79, 284–289 CrossRef CAS.
- X. Du, W. Zhao, S. Ma, M. Ma, T. Qi, Y. Wang and C. Hua, Ionics, 2016, 22, 545–553 CrossRef CAS.
- H. Y. Wang, J. Deng and Y. Q. Chen, Nano Res., 2016, 9, 2672–2680 CrossRef CAS.
- W. Xu, B. Mu and A. Wang, Electrochim. Acta, 2016, 194, 84–94 CrossRef CAS.
- W. Xu, B. Mu, W. Zhang and A. Wang, RSC Adv., 2016, 6, 68302–68311 RSC.
- W. Xu, B. Mu and A. Wang, RSC Adv., 2016, 6, 6967–6977 RSC.
- S. Liodakis, I. K. Fetsis and I. P. Agiovlasitis, J. Therm. Anal. Calorim., 2009, 98, 285–291 CrossRef CAS.
- P. Gao, Z. H. Liu, G. Xue, B. Han and M. H. Zhou, Bioresour. Technol., 2011, 102, 3645–3648 CrossRef CAS PubMed.
- Y. Li, Z. Wang, L. Li, S. Peng, L. Zhang, M. Srinivasan and S. Ramakrishna, Carbon, 2016, 99, 556–563 CrossRef CAS.
- Y. Chen, Q. Yan, S. Zhang, L. Lu, B. Xie, T. Xie, Y. Zhang, Y. Wu, Y. Zhang and D. Liu, J. Power Sources, 2016, 333, 125–133 CrossRef CAS.
- D. W. Wang, F. Li, M. Liu, G. Q. Lu and H. M. Cheng, Angew. Chem., Int. Ed., 2009, 48, 1525 CrossRef CAS.
- A. D. French, Cellulose, 2014, 21, 885–896 CrossRef CAS.
- L. Sun, C. Tian, Y. Fu, Y. Yang, J. Yin, L. Wang and H. Fu, Chemistry, 2014, 20, 564–574 CrossRef CAS PubMed.
- W. He and L. Lu, Adv. Funct. Mater., 2012, 22, 2542–2549 CrossRef CAS.
- J. P. Paraknowitsch, J. Zhang, D. Su, A. Thomas and M. Antonietti, Adv. Mater., 2010, 22, 87–92 CrossRef CAS PubMed.
- H.-G. Jung, J. Hassoun, J.-B. Park, Y.-K. Sun and B. Scrosati, Nat. Chem., 2012, 4, 579–585 CrossRef CAS PubMed.
- F. Liu, H. Peng, C. You, Z. Fu, P. Huang, H. Song and S. Liao, Electrochim. Acta, 2014, 138, 353–359 CrossRef CAS.
- Y. S. Yun, S. Y. Cho, J. Shim, B. H. Kim, S.-J. Chang, S. J. Baek, Y. S. Huh, Y. Tak, Y. W. Park, S. Park and H.-J. Jin, Adv. Mater., 2013, 25, 1993–1998 CrossRef CAS PubMed.
- Z. Mo, R. Zheng, H. Peng, H. Liang and S. Liao, J. Power Sources, 2014, 245, 801–807 CrossRef CAS.
- C. Guo, B. Wen, W. Liao, Z. Li, L. Sun, C. Wang, Y. Wu, J. Chen, Y. Nie, J. Liao and C. Chen, J. Alloys Compd., 2016, 686, 874–882 CrossRef CAS.
- B. Cao, B. Zhang, X. Jiang, Y. Zhang and C. Pan, J. Power Sources, 2011, 196, 7868–7873 CrossRef CAS.
- P. K. Tripathi, M. Liu, Y. Zhao, X. Ma, L. Gan, O. Noonan and C. Yu, J. Mater. Chem. A, 2014, 2, 8534–8544 CAS.
- H. Wang, J. Deng, C. Xu, Y. Chen, F. Xu, J. Wang and Y. Wang, Energy Storage Materials, 2017, 7, 216–221 CrossRef.
- M. Kruk, K. M. Kohlhaas, B. Dufour, E. B. Celer, M. Jaroniec, K. Matyjaszewski, R. S. Ruoff and T. Kowalewski, Microporous Mesoporous Mater., 2007, 102, 178–187 CrossRef CAS.
- X. Xu, Y. Gao, B. Gao, X. Tan, Y. Q. Zhao, Q. Yue and Y. Wang, J. Hazard. Mater., 2011, 192, 1690–1696 CrossRef CAS PubMed.
- Y. Liu, K. Li, Y. Liu, L. Pu, Z. Chen and S. Deng, J. Mater. Chem. A, 2015, 3, 21149–21158 CAS.
- L. Hao, X. Li and L. Zhi, Adv. Mater., 2013, 25, 3899–3904 CrossRef CAS PubMed.
- S. Arbab, A. Teimoury, H. Mirbaha, D. C. Adolphe, B. Noroozi and P. Nourpanah, Polym. Degrad. Stab., 2017, 142, 198–208 CrossRef CAS.
- P.-W. Xiao, Q. Meng, L. Zhao, J.-J. Li, Z. Wei and B.-H. Han, Mater. Des., 2017, 129, 164–172 CrossRef CAS.
- K. Jurewicz, K. Babel, A. Ziolkowski and H. Wachowska, Electrochim. Acta, 2003, 48, 1491–1498 CrossRef CAS.
- J. M. V. Nabais, P. J. M. Carrott and M. Carrott, Mater. Chem. Phys., 2005, 93, 100–108 CrossRef CAS.
- T. Z. Ren, Z. Y. Yuan, A. Azioune, J. J. Pireaux and B. L. Su, Langmuir, 2006, 22, 3886–3894 CrossRef CAS PubMed.
- C. Ma, C. Ma, J. Wang, H. Wang, J. Shi, Y. Song, Q. Guo and L. Liu, Carbon, 2014, 72, 38–46 CrossRef CAS.
- C. Shan, W. Zhao, X. L. Lu, D. J. O'Brien, Y. Li, Z. Cao, A. L. Elias, R. Cruz-Silva, M. Terrones, B. Wei and J. Suhr, Nano Lett., 2013, 13, 5514–5520 CrossRef CAS PubMed.
- C. Tang, Q. Zhang, M.-Q. Zhao, J.-Q. Huang, X.-B. Cheng, G.-L. Tian, H.-J. Peng and F. Wei, Adv. Mater., 2014, 26, 6100–6105 CrossRef CAS PubMed.
- P. Y. Shih, S. W. Yung and T. S. Chin, J. Non-Cryst. Solids, 1998, 224, 143–152 CrossRef CAS.
- X. X. Wu and L. R. Radovic, Carbon, 2006, 44, 141–151 CrossRef CAS.
- L. Xie, G. Sun, F. Su, X. Guo, Q. Kong, X. Li, X. Huang, L. Wan, W. Song, K. Li, C. Lv and C.-M. Chen, J. Mater. Chem. A, 2016, 4, 1637–1646 CAS.
- H.-R. Yu, S. Cho, M.-J. Jung and Y.-S. Lee, Microporous Mesoporous Mater., 2013, 172, 131–135 CrossRef CAS.
- R. Li, Z. Wei, X. Gou and W. Xu, RSC Adv., 2013, 3, 9978–9984 RSC.
- H. S. Fochler, J. R. Mooney, L. E. Ball, R. D. Boyer and J. G. Grasselli, Spectrochim. Acta, Part A, 1985, 41, 271–278 CrossRef.
- M. M. Coleman and R. J. Petcavich, J. Polym. Sci., Polym. Phys. Ed., 1978, 16, 821–832 CrossRef CAS.
- İ. Karacan and G. Erdoğan, Polym. Eng. Sci., 2012, 52, 937–952 Search PubMed.
- J. M. Valente Nabais, P. J. M. Carrott and M. M. L. Ribeiro Carrott, Mater. Chem. Phys., 2005, 93, 100–108 CrossRef.
- J. Mittal, O. P. Bahl, R. B. Mathur and N. K. Sandle, Carbon, 1994, 32, 1133–1136 CrossRef CAS.
- I. Karacan and G. Erdogan, Polym. Eng. Sci., 2012, 52, 937–952 CAS.
- S.-M. Li, S.-Y. Yang, Y.-S. Wang, H.-P. Tsai, H.-W. Tien, S.-T. Hsiao, W.-H. Liao, C.-L. Chang, C.-C. M. Ma and C.-C. Hu, J. Power Sources, 2015, 278, 218–229 CrossRef CAS.
- Y. Guo, Z.-Q. Shi, M.-M. Chen and C.-Y. Wang, J. Power Sources, 2014, 252, 235–243 CrossRef CAS.
- L. Zhang, F. Zhang, X. Yang, K. Leng, Y. Huang and Y. Chen, Small, 2013, 9, 1342–1347 CrossRef CAS PubMed.
- P. Cheng, S. Gao, P. Zang, X. Yang, Y. Bai, H. Xu, Z. Liu and Z. Lei, Carbon, 2015, 93, 315–324 CrossRef CAS.
- W. Tian, Q. Gao and W. Qian, ACS Sustainable Chem. Eng., 2016, 5, 1297–1305 CrossRef.
- J. Xu, Z. Tan, W. Zeng, G. Chen, S. Wu, Y. Zhao, K. Ni, Z. Tao, M. Ikram, H. Ji and Y. Zhu, Adv. Mater., 2016, 28, 5222–5228 CrossRef CAS PubMed.
- Q. Zhou, J. Gao, C. Li, J. Chen and G. Shi, J. Mater. Chem. A, 2013, 1, 9196 CAS.
- P.-P. Chang, K. Matsumura, C.-Y. Wang, T. Kinumoto, T. Tsumura, M.-M. Chen and M. Toyoda, Carbon, 2016, 108, 225–233 CrossRef CAS.
- D. Kang, Q. Liu, J. Gu, Y. Su, W. Zhang and D. Zhang, ACS Nano, 2015, 9, 11225–11233 CrossRef CAS PubMed.
- A. B. Fuertes, G. A. Ferrero and M. Sevilla, Energy Storage Materials, 2016, 4, 154–155 CrossRef.
- A. Bello, F. Barzegar, M. J. Madito, D. Y. Momodu, A. A. Khaleed, T. M. Masikhwa, J. K. Dangbegnon and N. Manyala, Electrochim. Acta, 2016, 213, 107–114 CrossRef CAS.
Footnote |
| † Electronic supplementary information (ESI) available: SEM and TEM images, BET, XPS spectra, XRD patterns, electrochemical capacitive performances, and tables. See DOI: 10.1039/c7se00481h |
|
| This journal is © The Royal Society of Chemistry 2018 |
Click here to see how this site uses Cookies. View our privacy policy here. 
 b and
Cheng-Meng
Chen
b and
Cheng-Meng
Chen


 0.15406 nm). The Raman spectra were obtained at ambient temperature via a Nanofinder 3.0 Raman spectrometer (Tokyo Instrument) using a visible laser beam of 488 nm as the excitation source. The thermogravimetric (TG) and derivative thermogravimetric (DTG) analyses were carried out using a Perkin-Elmer TG/DTA-6300 instrument in the temperature range of 30–900 °C at a heating rate of 10 °C min−1 under a N2 atmosphere with a flow rate of 20 mL min−1. The element analysis was conducted using a Vario EL cube elemental analyzer, and the P content was measured by inductively coupled plasma emission spectrometry. The X-ray photoelectron spectroscopy (XPS) spectra were obtained using an AXIS Ultra DLD spectrometer with an excitation source of Mg Kα (1486.6 eV). The chemical structure of nanofibers was investigated using a Nicolet Magna IR560F FTIR spectrometer in the range of 600–4000 cm−1 with a resolution of ±4 cm−1 in the transmission mode.