Synthesis of yolk–shell spheres based on molybdenum diselenide-encapsulated molybdenum oxide for efficient electrocatalytic hydrogen evolution†
Xiaohong
Xia
 *a,
Chunming
Wang
b,
Lang
Liu
a,
Yonglin
Du
b and
Weichun
Ye
 b
b
aCollege of Chemistry and Chemical Engineering, Xinjiang University, Shengli Road, Tianshan District, Wulumuqi, Xinjiang 830000, China. E-mail: x2hong@126.com
bCollege of Chemistry and Chemical Engineering, Lanzhou University, Tianshuinan Road, Chengguan District, Lanzhou, Gansu 730000, China
First published on 24th November 2017
Abstract
Transition metal dichalcogenides for electrocatalytic water splitting are important in renewable energy research, with studies showing that the edge structure and specific surface area are crucial to their electrocatalytic activity. Herein, the design and construction of yolk–shell nanospheres based on molybdenum diselenide-encapsulated molybdenum oxide are reported. Their structures were characterized using various techniques, which showed that the void space between the interior core and outer shell increased the number of active sites. This yolk–shell structure exhibited enhanced and stable electrocatalytic activity in the hydrogen evolution reaction (HER). The HER current density at −0.5 V vs. the reversible hydrogen electrode was increased by 95% (to −256 mA cm−2) compared to that of traditional flower-like molybdenum diselenide. The overpotential of this yolk–shell structure, which was required to drive a current density of −10 mA cm−2, was 65 mV lower than that of flower-like molybdenum diselenide (286 mV). Furthermore, long-term potential cycling and potentiostatic measurement of this catalyst showed favorable stability and durability of electrocatalytic activity. This yolk–shell structure plays a key role in energy conversion processes central to several renewable energy technologies.
1. Introduction
In the past decade, steam reformed hydrogen from fossil fuels, including coal and natural gas, has been widely utilized, with hydrogen production from abundant renewable energy sources becoming pivotal in many research areas.1 Recently, electrochemical methods have gradually attracted the attention of more researchers as environmental friendly and green technologies. Splitting water into hydrogen and oxygen using an electrocatalyst would allow the development of many renewable and sustainable energy technologies.2,3 Electrocatalytically produced hydrogen offers a high energy conversion efficiency, less pollution, and produces a much lower carbon monoxide content, mitigating the poisoning effect that often decreases the activity of catalysts used in HER.4 As previously reported, the change in Gibbs free energy required to split a water molecule is 1.23 V per electron transferred, with water electrolysis typically requiring an overpotential to drive the multistep reduction half-reactions.3 By using a catalyst to decrease the energy consumption and promote these reactions, hydrogen could easily be generated at a lower overpotential. Hydrogen evolution catalysts are a key component that must be able to drive current densities at low overpotential while remaining stable in the chosen electrolyte. However, the development of a single material to meet these requirements represents a significant unmet challenge. One strategy is to meet these various requirements using multiple materials. For example, the activity of silicon photocathodes has already been enhanced by depositing hydrogen evolution catalysts on the Si surface.5 The catalytic activity of heterogeneous catalysts in proportion to active surface area, high active surface area, and surface free energy can effectively enhance the catalytic performance.Advanced materials with yolk–shell structures are ideal catalysts due to their appealing structures and controllable chemical composition. As a material with an interior core, void space, and permeable outer shell, yolk–shell structures have become the focus of intensive research owing to their unique properties, such as low density, large surface area, high permeability, and excellent loading capacity.6 More importantly, the void space in yolk–shell structures provides a compartmentalized and confined environment for guest molecules. Furthermore, the properties and functionality, which rely on both the core and shell, can be tailored, making these structures attractive for applications in catalysis and energy storage.7 The design and controllable fabrication of sub-micron materials with yolk–shell structures have recently become increasingly important in materials and catalyst research. According to a previous report, one-dimensional yolk–shell nanorods have been successfully constructed and their properties evaluated in lithium batteries.8 At present, the most efficient water-splitting catalysts contain scarce metals, such as platinum (for the HER).9 Owing to their abundant sources, low price, and safety of storage and transportation, the development of active HER catalysts comprising earth-abundant elements would be a key step in HER development. To date, HER catalysis has been demonstrated using catalysts made from earth-abundant elements such as nickel–molybdenum alloys,10–12 which require an overpotential of 50 mV to drive the HER at a current density of −10 mA cm−2. However, nickel–molybdenum alloys are unstable in strongly acidic solutions, where proton-exchange membranes are operational and voltage loss due to the formation of a pH gradient across the membrane can be minimized.13,14
Recently, transition metal dichalcogenides have been widely studied as HER catalysts, demonstrating good stability in acidic media.15,16 Transition metal dichalcogenides, such as MoS2, MoSe2, WS2, and WSe2, which are composed of earth-abundant elements, are stable in acid media,9,11,15,17 and catalyze the HER with reported overpotentials of 200–350 mV to drive current densities of −10 mA cm−2. By analysis and comparison, we found that each HER catalyst reported previously has different strengths and weaknesses, such as excellent catalytic activity coupled with high price, poor electrical conductivity, and unreasonable microstructure. To maximize the effects of hydrogen evolution, it is necessary to combine the advantages of various types of HER catalyst. Herein, a yolk–shell structure based on MoSe2 and MoO3 has been designed as an earth-abundant HER catalyst with increased active area. As a HER catalyst, this yolk–shell structure had advantages of high specific surface area and comprising cost-effective earth-abundant materials. Moreover, in the yolk–shell structure, the MoSe2 shell with high catalytic activity and stability in the HER can protect the MoO3 core from dissolving under HER conditions, while the MoO3 core, which has better conductivity than MoSe2, can improve the catalyst conductivity. By combining the MoO3 core and MoSe2 shell, we have successfully created a structure with high surface area, catalytic activity, and stability in strong acids.
2. Experimental section
2.1 Materials synthesis
MoO3 was prepared using a conventional hydrothermal reaction.18 To synthesize MoO3, (NH4)6Mo7O24 (Aladdin, analytically pure, 0.49 g) was dissolved in distilled water (20 mL) with continuous stirring. HNO3 solution (7.5 mL, 3 M) was added to the above solution and the mixture was transferred into a Teflon-lined stainless steel autoclave (100 mL) and heated at 180 °C for 20 h in an electric oven. At reaction completion, the obtained precipitates were separated by filtration, washed with redistilled water and ethanol, and finally dried at 100 °C in an oven. Yolk–shell MoO3@MoSe2 spheres were obtained through the hydrothermal reaction of MoO3. Hydrazine hydrate–Se (0.125 g of selenium dispersed in 2 mL of 80% hydrazine hydrate) was added to an aqueous dispersion of MoO3 (0.1 g of MoO3 in 50 mL of distilled water). The mixture was transferred into a Teflon-lined stainless steel autoclave (100 mL), heated at 180 °C for 5 h, and then at 120 °C for 10 h. At reaction completion, the precipitate was washed with distilled water and dried in a vacuum. To perform the contrast experiment, we also synthesized MoSe2 using a process similar to that of yolk–shell MoO3@MoSe2, except that the heating process was conducted at 180 °C for 20 h. Pt/C used in this work was obtained from Alfa Aesar and had a 10% Pt content. Typically, an aqueous dispersion of Pt/C (5 mL, 1 mg mL−1) was drop cast onto the glassy carbon electrode (GCE) using a micro-injector. When not in use, the sensor was preserved at room temperature.2.2 Characterization
The material morphology was investigated using scanning electron microscopy (SEM, J4800 Japan) and transmission electron microscopy (TEM, Tecnai G2 F30, FEI, USA). The phase structures of the samples were measured by X-ray diffraction (XRD, Rigaku D/max-2400). The chemical composition was determined by energy dispersive X-ray spectroscopy (EDS) and X-ray photoelectron spectroscopy (XPS, ESCALAB250xi X-ray Monochromatisation 200W Spot/power: Mono 650 μm). Energy calibrations were performed against the C 1s peak to eliminate charging of the sample during analysis. Raman spectra were also measured (HORIBA Jobin Yvon LabRAM HR 800, 532 nm laser, CCD 200–1050 nm probe).Electrochemical experiments were carried out in an electrochemical cell with a three-electrode configuration on a electrochemical workstation (CHI, USA, CHI660C). A material-modified GCE was used as the working electrode, while Pt wire and a saturated calomel electrode (SCE) served as the counter electrode and reference electrode, respectively. For each material, an aqueous dispersion (5 μL, 1 mg mL−1) was dropcast onto the GCE. All tests were performed in H2SO4 electrolyte (80 mL, 0.5 M). The stability and catalytic activity of the materials in the HER were studied using cyclic voltammetry (CV) and linear sweep voltammetry (LSV). The electrode conductivity was determined using electrochemical impedance spectroscopy (EIS). EIS measurements were performed with the same configuration at an open circuit potential of 106 to 0.01 Hz with an AC voltage of 5 mV. A potentiostatic method was used to evaluate the material durability. To measure the electrochemical capacitance, the potential was swept from −0.1 to 0.1 V vs. SCE and back to −0.1 V three times at each scan rate. The obtained voltammograms were calibrated against the reversible hydrogen electrode (RHE).
3. Results and discussion
3.1 Morphology characterization
By partially reducing MoO3 using hydrazine under thermal annealing using Se powder as a source of selenium atoms, MoO3@MoSe2 was synthesized successfully. Fig. 1(a) shows that the obtained MoO3@MoSe2 particles were spherical with an average radius of 200 nm and a bumpy surface. Fig. 1(b) shows the surface morphology of a broken sphere, with the surface holes indicating that the spheres had a hollow structure. This hollow structure allows the electrolyte to contact both the inner and outer surface of the hollow spheres, with the void space between the interior core and outer shell improving the adsorption and HER catalysis capabilities. This structural feature increased the effective active surface area of the catalyst. Fig. 1(c) is an enlarged SEM image of a broken sphere, showing a microspheric core encapsulated in the hollow sphere with space between the core and shell, indicating that this material had a yolk–shell structure. The bumpy shell was about 50 nm thick, and seemed to be composed of many vertical nanosheets of different orientations. The radius of this microspheric core was about 100 nm. High-resolution SEM images of the MoO3@MoSe2 spheres and MoSe2 shell are shown in Fig. S1,† where the bumpy surface was more clearly observed and seemed to be composed of many vertical nanosheets of different orientations. Fig. 1(d) shows the morphology of the contrast material, single MoSe2, which has a flower-like structure consistent with MoSe2 reported previously.11 Compared with the yolk–shell structure, the flower-like structure had an insufficient effective active surface area to act as a catalyst for the HER. In the follow-up experiment, this conclusion was confirmed by electrochemical investigation. The chemical compositions of the shell and core in the yolk–shell structure were characterized by EDS. The EDS results are shown in Fig. S2 and S3,† with the peak position and area indicating the element type and proportion. This confirmed that the shell was MoSe2 and the core was MoO3, indicating that the yolk–shell structure was MoO3@MoSe2.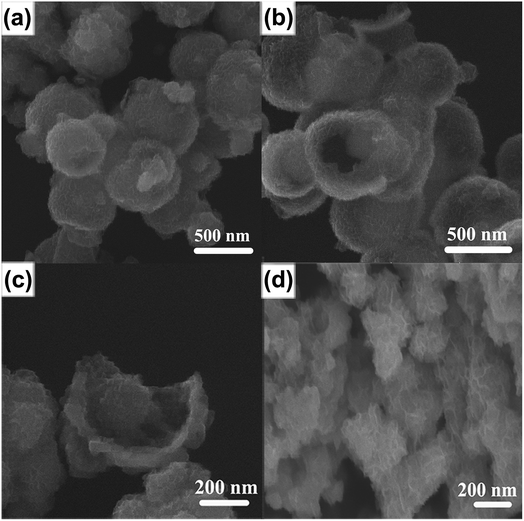 | ||
| Fig. 1 Typical SEM images of (a) MoO3@MoSe2 spheres and (b) broken MoO3@MoSe2 spheres. (c) Enlarged SEM image of a broken yolk–shell MoO3@MoSe2 sphere. (d) SEM image of flower-like MoSe2. | ||
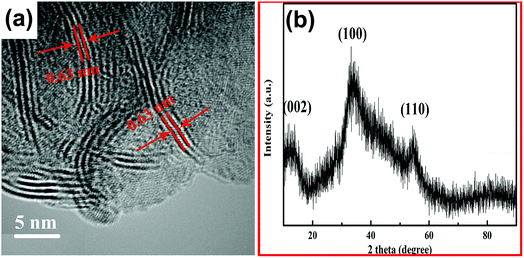
As shown in Fig. 2(a), the yolk–shell structure was observed more clearly in the TEM image of MoO3@MoSe2. The microspheric cores were encapsulated in the hollow spheres, with space between the core and shell, and holes on the spheres were also observed. Fig. 2(b) shows a TEM image of an empty MoSe2 shell, in which a hole in the MoSe2 shell can be observed clearly. When the hole is large enough, the encapsulated core can escape from the shell, leaving only an empty shell. This shell is formed by the aggregation of small sheets with a wave-like shape. This structure has a surface area (including inner and outer surfaces of the shell) that is larger than the surface area of traditional flower-like MoSe2 (Fig. 2(d)). This yolk–shell MoO3@MoSe2 can drive the HER on the inner and outer surface of the shell, making its catalytic performance for HER more satisfactory than that of flower-like MoSe2. In the follow-up experiment, the electrocatalytic properties of these two materials were studied to prove the above conclusion. The enlarged TEM image of the MoSe2 shell in Fig. 2(c) shows vertically aligned 2D layers with exposed edge sites. This structure was consistently observed in all enlarged TEM images collected from random areas of the shell, confirming the vertical growth of MoSe2 nanosheets. Fig. 3(a) is the high resolution transmission electron microscopy (HRTEM) image of the MoSe2 shell, in which the spacing between adjacent 2D layers was determined from its HRTEM image and measured to be 0.63 nm, corresponding to the interplanar distance of (002) planes in MoSe2.19,20 The 2D molecular layers of MoSe2 were vertically assembled to preferably expose the edge-sites of the layers rather than basal planes, which is useful for the HER owing to the enhanced chemical reactivity of the preferably exposed dangling bonds on the edge sites. No other lattice parameters were observed, except for the spacing between adjacent 2D layers, which indicated that MoSe2 in the yolk–shell structure had poor crystallinity.
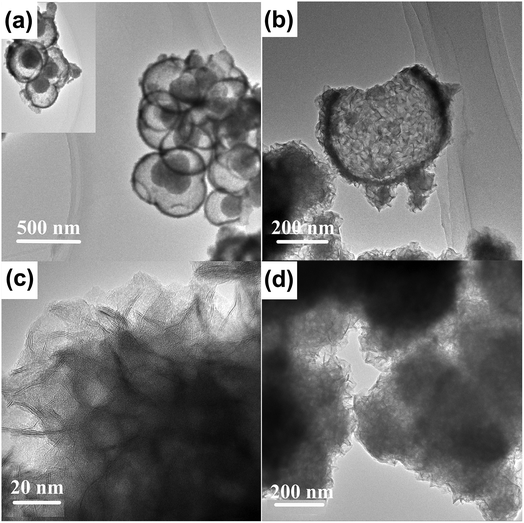 | ||
| Fig. 2 Low magnification TEM images of (a) MoO3@MoSe2 and (b) the MoSe2 shell of a yolk–shell sphere. (c) Enlarged TEM image of the MoSe2 shell. (d) TEM image of flower-like MoSe2. | ||
The XRD pattern of the yolk–shell structure is shown in Fig. 3(b), which exhibits three XRD diffraction peaks that do not present good peak shapes. The diffraction peaks appearing at 12.8°, 32.8°, and 55.2° corresponded to the (002), (100), and (110) planes of MoSe2, respectively.20 Compared with the standard XRD pattern of MoSe2, the XRD diffraction peaks of the yolk–shell structure are broad, indicating that MoSe2 in the yolk–shell structure had poor crystallinity. This result was in good agreement with the results of HRTEM analysis, further evidencing that MoSe2 contained in the yolk–shell structure had poor crystallinity. No diffraction peak was observed for MoO3 in the XRD pattern, probably due to the MoO3 core having an amorphous structure.
3.2 X-ray photoelectron spectroscopy and Raman spectra
High-resolution XPS was used to investigate the chemical states of Mo, O, and Se contained in yolk–shell MoO3@MoSe2. As shown in Fig. 4(a)–(c), the high-resolution XPS of Mo 3d, Se 3d, and O 1s regions provided information about both stoichiometry and bonding. According to a previous study,21 the Mo 3d region is fitted by doublets with fixed spectroscopic parameters, such as spin–orbit separation, Mo 3d3/2 to Mo 3d5/2, intensity ratio, and full width at half maximum, but with independent and variable positions and intensities as optimized by the program. The Mo 3d XPS spectrum of this yolk–shell structure was decomposed with the Gaussian distribution, as shown in Fig. 4(a). The results showed a perfect fit to two sets of doublet peaks corresponding to Mo contained in the MoSe2 shell and MoO3 core, respectively, indicating a mixture of Mo oxidation states. The lower binding energy doublet located at 228.3 and 231.4 eV, corresponding to Mo 3d5/2 and Mo 3d3/2, respectively, originated from Mo4+ in MoSe2.22 The other doublet located at higher binding energies of 232.5 and 235.6 eV, corresponding to Mo 3d5/2 and Mo 3d3/2, respectively, was attributed to Mo6+ in MoO3.23 The existence of the Mo6+ peak indicated that Mo6+ was only partially reduced to Mo4+. Based on the peak areas of Mo4+ and Mo6+, obtained by fitting with XPS analysis software MDI Jade 5.0, the ratio of MoSe2![[thin space (1/6-em)]](https://www.rsc.org/images/entities/char_2009.gif) :
:![[thin space (1/6-em)]](https://www.rsc.org/images/entities/char_2009.gif) MoO3 was 0.4
MoO3 was 0.4![[thin space (1/6-em)]](https://www.rsc.org/images/entities/char_2009.gif) :
:![[thin space (1/6-em)]](https://www.rsc.org/images/entities/char_2009.gif) 1. The ratio of Mo
1. The ratio of Mo![[thin space (1/6-em)]](https://www.rsc.org/images/entities/char_2009.gif) :
:![[thin space (1/6-em)]](https://www.rsc.org/images/entities/char_2009.gif) Se
Se![[thin space (1/6-em)]](https://www.rsc.org/images/entities/char_2009.gif) :
:![[thin space (1/6-em)]](https://www.rsc.org/images/entities/char_2009.gif) O was 1
O was 1![[thin space (1/6-em)]](https://www.rsc.org/images/entities/char_2009.gif) :
:![[thin space (1/6-em)]](https://www.rsc.org/images/entities/char_2009.gif) 0.6
0.6![[thin space (1/6-em)]](https://www.rsc.org/images/entities/char_2009.gif) :
:![[thin space (1/6-em)]](https://www.rsc.org/images/entities/char_2009.gif) 4.4 and, when excluding the content of chemically absorbed oxygen, the ratio of MoSe2
4.4 and, when excluding the content of chemically absorbed oxygen, the ratio of MoSe2![[thin space (1/6-em)]](https://www.rsc.org/images/entities/char_2009.gif) :
:![[thin space (1/6-em)]](https://www.rsc.org/images/entities/char_2009.gif) MoO3 obtained from Se2− and O2− spectra was consistent with that obtained from the Mo4+ and Mo6+ spectra. The XPS spectrum of Se was also decomposed with the Gaussian distribution, as shown in Fig. 4(b), and was divided into Se 3d5/2 and 3d3/2, with peak positions at 53.9 and 54.7 eV, respectively, which were associated with Se2− species in the MoSe2.24 The XPS spectrum of O 1s also decomposed with the Gaussian distribution, as shown in Fig. 4(c). The lower binding energy component located at 530.4 eV originated from the lattice oxygen in MoO3, while the peak located at 532.3 eV was related to the chemically absorbed oxygen site.24,25 Therefore, the XPS results further demonstrated that the chemical composition of this yolk–shell structure was MoO3@MoSe2.
MoO3 obtained from Se2− and O2− spectra was consistent with that obtained from the Mo4+ and Mo6+ spectra. The XPS spectrum of Se was also decomposed with the Gaussian distribution, as shown in Fig. 4(b), and was divided into Se 3d5/2 and 3d3/2, with peak positions at 53.9 and 54.7 eV, respectively, which were associated with Se2− species in the MoSe2.24 The XPS spectrum of O 1s also decomposed with the Gaussian distribution, as shown in Fig. 4(c). The lower binding energy component located at 530.4 eV originated from the lattice oxygen in MoO3, while the peak located at 532.3 eV was related to the chemically absorbed oxygen site.24,25 Therefore, the XPS results further demonstrated that the chemical composition of this yolk–shell structure was MoO3@MoSe2.
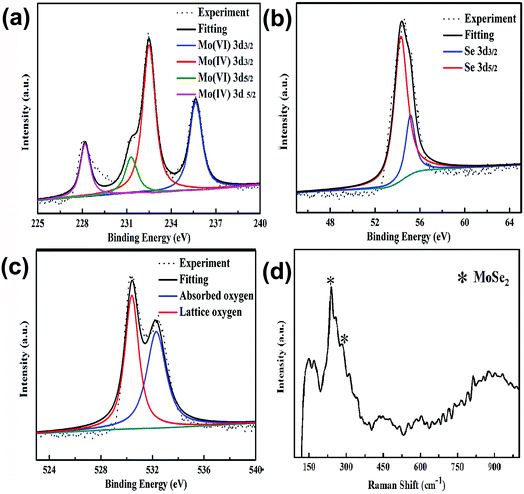 | ||
| Fig. 4 High-resolution XPS of (a) Mo 3d, (b) Se 3d, and (c) O 1s regions of the yolk–shell structure. (d) Raman spectrum of yolk–shell MoO3@MoSe2. | ||
Raman spectroscopy is an effective method for the material characterization. This yolk–shell structure was characterized by Raman spectroscopy using a laser wavelength of 532 nm. Fig. 4(d) shows the Raman spectrum of MoO3@MoSe2. The peak at a lower wavelength (241.6 cm−1) was characteristic of the A1g mode of MoSe2 (out-of-plane vibration), while the peak at a higher wavelength (284.3 cm−1) was characteristic of the E12g mode of MoSe2 (in-plane vibration). Compared with the Raman characteristic peaks of monolayer MoSe2,26 which has the out-of-plane vibrational mode (A1g) located at 241 cm−1 and in-plane vibrational mode (E12g) located at 287 cm−1, the Raman characteristic peaks of MoSe2 contained in the yolk–shell structure have shifted. Some reports have checked the thickness-dependent shift of A1g and E12g from monolayer to bilayer, during which the high-frequency mode shifts from 241 to 241.5 cm−1, whereas the low-frequency mode shifts from 287.3 to 285.3 cm−1. The A1g was found to be blue-shifted, while the E12g was red-shifted with increasing MoSe2 thickness, with the shifts in the high-frequency vibrational modes not being as sensitive as those in the low-frequency modes. As expected, the blue-shift of A1g and red-shift of E12g indicated that MoSe2 in the yolk–shell structure was not monolayer, but a multilayer. This result was consistent with that obtained from HRTEM analysis. Except the characteristic peaks of MoSe2, all other characteristic peaks present in the Raman spectrum of the yolk–shell structure were attributed to MoO3. According to a previous report,27,28 the Raman spectrum of MoO3 can be discussed in terms of internal and external modes. The intensity of the Raman peaks varies based on crystal orientation and laser source polarization. The vibration modes in MoO3 appear at around 1000–600 cm−1, 600–400 cm−1, and below 200 cm−1, which correspond to stretching, deformation, and lattice modes, respectively.29 Under ambient conditions, the positions of all Raman peaks are in good agreement with those described in the literature.28 The peak at 816.4 cm−1 represents symmetric Mo–O3–Mo stretching (Ag) with the bonding aligning along the axis direction. Two bands at 667.0 and 470.5 cm−1 resulted from antisymmetric νMo–O2–Mo stretching (B2g) and bending (Ag), respectively. The peaks at 365.3 cm−1 are the Ag modes corresponding to the δO2![[double bond, length as m-dash]](https://www.rsc.org/images/entities/char_e001.gif) Mo
Mo![[double bond, length as m-dash]](https://www.rsc.org/images/entities/char_e001.gif) O2 scissor. The band at 337.6 cm−1 was characteristic of δO3–Mo–O3 deformation (B1g). The peaks at 245.7 and 176.4 cm−1 corresponded to B3g and B2g modes, respectively, due to the δO2–Mo–O2 scissor. Finally, the peak at 146.3 cm−1 was attributed to the δ(O2Mo2)n mode.30
O2 scissor. The band at 337.6 cm−1 was characteristic of δO3–Mo–O3 deformation (B1g). The peaks at 245.7 and 176.4 cm−1 corresponded to B3g and B2g modes, respectively, due to the δO2–Mo–O2 scissor. Finally, the peak at 146.3 cm−1 was attributed to the δ(O2Mo2)n mode.30
3.3 Electrochemical investigation
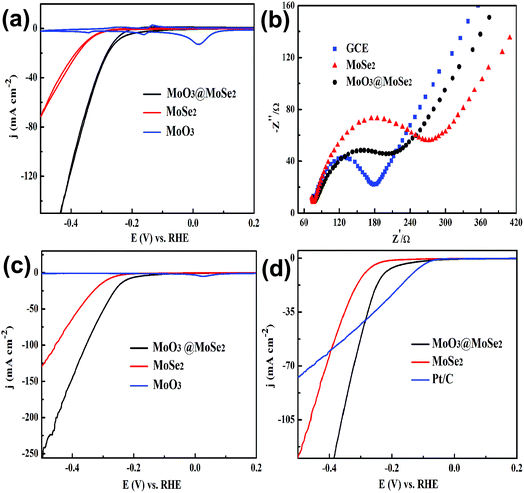
Cyclic voltammograms (CVs) of MoO3, MoSe2, and yolk–shell MoO3@MoSe2 were measured to compare their electrochemical stabilities under HER conditions. As shown in Fig. 5(a), MoO3 showed extreme instability under the testing conditions, immediately producing anodic peaks and cathodic peaks that corresponded to redox behavior of MoO3. This expected behavior from the Pourbaix diagram of the Mo–O system indicates that MoO3 has a limited window of stability (only at anodic potentials and in acidic media).30 However, CV of MoSe2 showed no obvious redox peak, which illustrated that MoSe2 was more stable than MoO3 under HER conditions. Furthermore, no redox peaks were observed in CV of yolk–shell MoO3@MoSe2, indicating the direct protective effect of MoSe2 against MoO3 dissolution through surface coverage of MoSe2. Comparing CV of MoO3, MoSe2, and MoO3@MoSe2 showed that yolk–shell MoO3@MoSe2 was more stable than MoO3. As shown in Fig. 5(b), the conductivity of these materials ware studied by EIS. Compared with the bare GCE, a loss of conductivity in the MoSe2-modified GCE was observed. However, with MoO3 incorporation, the resistance of the MoO3@MoSe2-modified GCE was lower than that of the MoSe2-modified GCE, which indicated that the presence of MoO3 in catalyst improved the conductivity of the catalyst effectively. The results shown in Fig. 5(a) and (b) indicate that, for this yolk–shell structure, the MoSe2 shell, which has high stability in the HER, can protect the MoO3 core from the dissolving under HER conditions, and that MoO3, which has better conductivity than MoSe2, can improve the catalyst conductivity. Linear scanning voltammetry (LSV) images of MoO3, MoSe2, and the proposed yolk–shell MoO3@MoSe2 were also studied to compare their HER catalytic activity. As shown in Fig. 5(c), no HER current density was observed in the LSV of MoO3, which suggested that MoO3 in this study had almost no catalytic activity for the HER. Compared with MoO3, an obvious HER current density was observed in the LSV of MoSe2. For yolk–shell MoO3@MoSe2, the current density obtained at −500 mV vs. RHE was −256 mA cm−2, which was almost twice that of flower-like MoSe2 (−131 mA cm−2). The activity of a catalyst is known to increase along the active edge when the active catalyst surface area increases. From structural characterization, this yolk–shell structure was found to have MoSe2 shells with clear vertically aligned 2D layers with exposed edge sites. As shown in Fig. 6, the HER can be driven on the inner and outer surface of the MoSe2 shell based on the hollow structure of yolk–shell MoO3@MoSe2, while flower-like MoSe2 can only catalyze the HER on its outer surface. This yolk–shell structure, with a specific surface area about two-fold that of the flower-like structure, led to enhanced electrochemical catalytic activity in the HER. As shown in Fig. 5(c), flower-like MoSe2 exhibited an overpotential of 286 mV to drive the HER at a benchmark current density of −10 mA cm−2, which was consistent with previous reports.20,31 In comparison, the overpotential of yolk–shell MoO3@MoSe2 required to drive the HER at a benchmark current density of −10 mA cm−2 was only 221 mV. As MoO3 in this paper showed no catalytic activity for HER, the lower overpotential and higher HER current density of yolk–shell MoO3@MoSe2 was due to its higher active surface area. This was consistent with results obtained from structural characterization, further proving the effect of active surface area on catalytic activity. As shown in Fig. 5(d), the catalytic activities of flower-like MoSe2, yolk–shell MoO3@MoSe2, and 10% Pt/C were compared. The catalytic activities of MoO3@MoSe2 and Pt/C were demonstrably superior to that of flower-like MoSe2. The LSVs of Pt/C and MoO3@MoSe2 were compared to analyze their catalytic activities, with the two curves crossing each other at −283 mV vs. RHE. The overpotential of Pt/C required to drive the HER at a benchmark current density of −10 mA cm−2 was 133 mV, which represented a decrease of 88 mV compared to that of MoO3@MoSe2. In the low overpotential region, the catalytic activity of Pt/C in the HER was higher than that of MoO3@MoSe2; however, at higher overpotentials, the catalytic activity of Pt/C in the HER was lower than that of MoO3@MoSe2. According to a previous report, in the low overpotential region, H coverage is too low to produce (and release) molecular H2, while at higher over-potentials, H coverage increases along the edge. As H2 is released, the local coverage is reduced once again, leaving open sites at which more protons can adsorb and produce H2. According to this previous work and the LSV results of Pt/C and MoO3@MoSe2 herein, the catalytic activities of these two materials was compared and reasons for differences in catalytic activity were analyzed. Based on a previous study,3 the catalyst can drive the HER at a lower overpotential by decreasing the energy consumption of water electrolysis and promoting the multistep reduction half-reactions. In the low overpotential region, the Pt/C catalyst can drive the HER at a lower overpotential than the MoO3@MoSe2 catalyst because Pt/C decreased the required Gibbs free energy more easily than MoO3@MoSe2. However, at higher overpotentials, the MoO3@MoSe2 catalyst showed better catalytic activity than Pt/C due to its higher active surface area.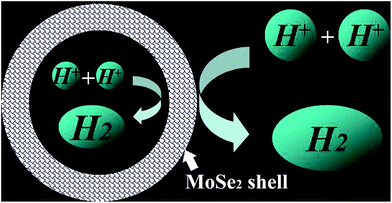 | ||
| Fig. 6 Illustration of the hydrogen evolution reaction on the inner and outer surfaces of the MoSe2 shell in the yolk–shell structure. | ||
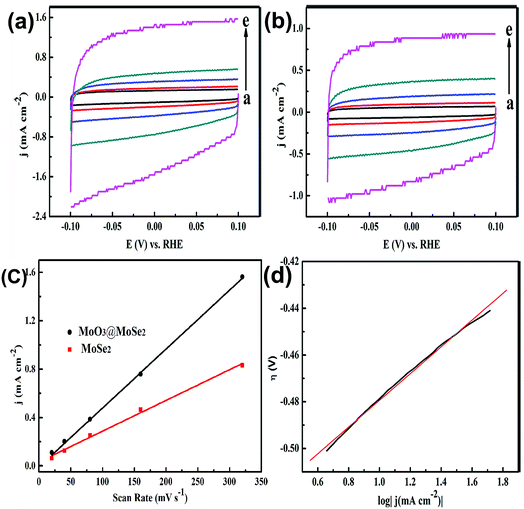
To further validate the increase in active surface area from flower-like structure to yolk–shell structure, electrochemical capacitance surface area measurements were performed, as shown in Fig. 7(a) and (b). The non-faradic capacitive current associated with an electrochemical double layer charging upon repeated potential cycling was measured to study the electrochemically active surface area of the materials. A potential range of 0.15–0.35 V vs. RHE was selected for the capacitive current measurements because no obvious electrochemical features corresponding to faradic current were observed in this region. The double layer charging current, ic, is proportional to both the scan rate, ν, and the electrochemically active surface area of the electrode, Aechem, as shown below:32
| ic ∝ v × Aechem | (1) |
Electrochemical capacitance was measured to determine the active surface area of the different catalysts and the capacitive current density measured at 0.25 V vs. RHE was plotted as a function of scan rate for flower-like MoSe2 and yolk–shell MoO3@MoSe2 (Fig. 7(c)). The slope of the linear regression equation reflects the relative size of the electrochemically active surface area of the material to a certain extent. Therefore, comparing the slopes allows rough determination of the size of the active area of a material. As shown in Fig. 7(c), the dependence of the current density on the scan rate in this region was linear for both materials, which was consistent with the capacitive charging behavior. Yolk–shell MoO3@MoSe2 had a slope of 4.9 × 10⁻³, which was about twice that of flower-like MoSe2 (2.5 × 10⁻³). This result could explain why the HER current density of the yolk–shell structure was larger than that of the flower-like structure. From flower-like to yolk–shell structure, the active surface area increases with the changes in the structure. The increase in active surface area is related to improved HER performance, and is a very useful approach to improving catalytic performance.
3.4 Tafel analysis and stability study
Tafel analysis was performed on the Tafel polarization curves of yolk–shell MoO3@MoSe2, as shown in Fig. 7(d). The Tafel equation, which relates the current and overpotential for electrocatalytic reactions such as hydrogen evolution, as shown below:| η = a + b × log(i) | (2) |
Discharge reaction (Volmer step):
| H3O+ + e− → Had + H2O, b = 120 mV | (3) |
Ion–atom reaction (Heyrovsky step):
| Had + H3O+ + e− → H2 + H2O, b = 40 mV | (4) |
Combination reaction (Tafel step):
| Had + Had → H2, b = 30 mV | (5) |
Therefore, for many electrodes, Tafel slopes of about 30, 40, or 120 mV dec−1 should be observed. However, deviations from these values are also common. Many factors can cause such deviation. For example, the surface coverage of hydrogen might be intermediate and potential dependent, or the discharge reaction may have a significant activation barrier.30,33 According to the Tafel slope calculated from Fig. 7(d), we estimated the rate-determining steps for the yolk–shell material. Due to the Tafel slope of MoO3@MoSe2 being 56 mV dec−1, the main HER mechanism was the Heyrovsky step. The low HER overpotential and Tafel slope showed that there were adequate active sites for the reaction.34,35 These parameters indicated that yolk–shell MoO3@MoSe2 was a good HER catalyst.
To evaluate the stability of yolk–shell MoO3@MoSe2 in the HER, we compared it with commercial 10% Pt/C. Their stability was investigated by sequential LSV scans and a potentiostatic method. Fig. 8(a) and (b) show sequential scanned LSVs of MoO3@MoSe2 and Pt/C, respectively. In the 1st cycle, compared with MoO3@MoSe2, Pt/C had a lower hydrogen evolution overpotential and higher hydrogen evolution current density. However, with increasing scan time, the overpotential increased and current density decreased obviously. At the 1000th cycle, the overpotential required by Pt/C to drive the HER at a benchmark current density of −10 mA cm−2 was 502 mV, which represented an increase of 369 mV compared to the 1st cycle (133 mV). However, Fig. 8(a) shows little change in the overpotential and current density of MoO3@MoSe2 with continuous LSV scanning. After 1000 cycles, the overpotential required to drive the HER at a benchmark current density of −10 mA cm−2 had increased only 15% compared with the 1st cycle (221 mV). MoO3@MoSe2 retained its activity throughout extended reductive potential cycling. A potentiostatic method was also used to compare the stability of the two materials. As shown in Fig. 8(c), for MoO3@MoSe2, the current density remained almost unchanged for 7200 s, while the current density of Pt/C decreased obviously with time (Fig. 8(d)). The results in Fig. 8 show that, compared with Pt/C, yolk–shell MoO3@MoSe2 had better stability under acid conditions. Furthermore, the scarcity and high cost of the noble metal materials prohibit the wide-scale deployment of Pt/C. Therefore, for practical application under acid conditions, yolk–shell MoO3@MoSe2 is a more suitable and promising as a HER catalyst. To compare this catalyst with those from previous studies, the characteristics of different HER catalysts are shown in Table 1. The catalyst prepared in this study offers reasonable electrochemical activity for the HER, and is an appropriate catalyst for electrocatalytic hydrogen generation.
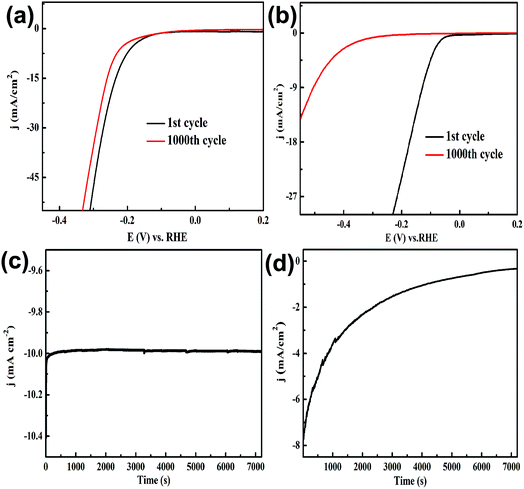 | ||
| Fig. 8 Comparison of electrochemical stability: sequential linear sweep voltammograms of (a) MoO3@MoSe2 and (b) Pt/C, and current density vs. time behavior of (c) MoO3@MoSe2 and (d) Pt/C. | ||
| Catalysts | Synthetic method | Onset potential [mV vs. RHE] | overpotential [mV] at −10 mA cm−2 | Tafel slope [mV dec−1] | Ref. |
|---|---|---|---|---|---|
| MoS2 | Hydrothermal method | −54 | 200 | 100 | 34 |
| MoS2/carbon | Hydrothermal method | −130 | 250 | 83 | 36 |
| MeSe2 | Operando method | −150 | 250 | 105 | 31 |
| MoSe2/graphene | Hydrothermal method | −50 | 175 | 69 | 19 |
| MoO3/Ag | Operando method | −48 | 145 | 43 | 37 |
| MoSe2/NG | High-temperature annealing | −30 | 106 | 57 | 38 |
| CNT@MoSe2 | One-step solvothermal reaction | −70 | 178 | 58 | 39 |
| MoSe2/graphene | In situ growth | −50 | 159 | 61 | 40 |
| MoO3/MoSe2 | Hydrothermal method | −52 | 221 | 56 | This work |
4. Conclusions
In this work, yolk–shell MoO3@MoSe2 has been synthesized and efficiently drove the HER due to its high active surface area and good electrocatalytic properties. Electrochemical capacitance measurements showed that this yolk–shell structure had an active surface area almost twice that of the traditional flower-like structure. In this yolk–shell structure, the MoSe2 shell can drive the HER efficiently and protect the MoO3 core from dissolving under HER conditions, while the MoO3 core can improve the electrical conductivity of the catalyst. This proposed yolk–shell MoO3@MoSe2 catalyst exhibited excellent electrocatalytic activity in the HER, with a current density reaching −256 mA cm−2 at −0.5 V vs. RHE, which was 1.9 times higher than that of the traditional flower-like structure. The overpotential required to drive a current density of −10 mA cm−2 was 221 mV, which was 65 mV lower than that of the traditional flower-like structure (286 mV). Further long-term potential cycling and potentiostatic measurements of this catalyst demonstrated the favorable stability and durability of electrocatalytic activity. This yolk–shell structure with a high active surface area is a promising candidate for enabling the widespread deployment of cost-effective systems for electrochemical hydrogen production.Conflicts of interest
There are no conflicts to declare.Acknowledgements
This work was supported by the National Science Foundation of China under Grant No. 51372106.References
- M. G. Walter, E. L. Warren, J. R. McKone, S. W. Boettcher, Q. Mi, E. A. Santori and N. S. Lewis, Chem. Rev., 2010, 110, 6446 CrossRef CAS PubMed.
- T. R. Cook, D. K. Dogutan, S. Y. Reece, Y. Surendranath, T. S. Teets and D. G. Nocera, Chem. Rev., 2010, 110, 6474 CrossRef CAS PubMed.
- E. L. Warren, J. R. McKone, S. W. Boettcher, Q. Mi, E. A. Santori and N. S. Lewis, Chem. Rev., 2011, 111, 5815 CrossRef.
- N. R. Elezovića, L. Gajić-Krstajićb, V. Radmilovićc, L. Vračard and N. V. Krstajićd, Electrochim. Acta, 2009, 54, 1375 CrossRef.
- Y. Hou, B. L. Abrams, P. C. K. Vesborg, M. E. Bjorketun, K. Herbst, L. Bech, A. M. Setti, C. D. Damsgaard, T. Pedersen, O. Hansen, J. Rossmeisl, S. Dahl, J. K. Nørskov and I. Chorkendorff, Nat. Mater., 2011, 10, 434 CrossRef CAS PubMed.
- J. Liu, S. Z. Qiao, J. S. Chen, X. W. Lou and X. Xing, Chem. Commun., 2011, 47, 12578 RSC.
- C. H. Kuo, Y. Tang, L. Y. Chou, B. T. Sneed and C. N. Brodsky, J. Am. Chem. Soc., 2012, 134, 14345 CrossRef CAS PubMed.
- Z. Y. Cai, L. Xu, M. Y. Yan, C. H. Han, L. He, K. M. Hercule, C. J. Niu, Z. F. Yuan, W. W. Xu, L. B. Qu, K. N. Zhao and L. Q. Mai, Nano Lett., 2015, 15, 738 CrossRef CAS PubMed.
- A. B. Laursen, S. Kegnæs, S. Dahl and I. Chorkendorff, Energy Environ. Sci., 2012, 5, 5577 CAS.
- J. R. McKone, B. F. Sadtler, C. A. Werlang, N. S. Lewis and H. B. Gray, ACS Catal., 2013, 3, 166 CrossRef CAS.
- D. Merki, S. Fierro, H. Vrubel and X. Hu, Chem. Sci., 2011, 2, 1262 RSC.
- J. R. McKone, E. L. Warren, M. J. Bierman, S. W. Boettcher, B. S. Brunschwig, N. S. Lewis and H. B. Gray, Energy Environ. Sci., 2011, 4, 3573 CAS.
- E. J. Popczun, J. R. McKone, C. G. Read, A. J. Biacchi, A. M. Wiltrout, N. S. Lewis and R. E. Schaak, J. Am. Chem. Soc., 2013, 135, 9267 CrossRef CAS PubMed.
- E. A. Hernandez-Pagan, N. M. Vargas-Barbosa, T. Wang, Y. Zhao, E. S. Smotkin and T. E. Mallouk, Energy Environ. Sci., 2012, 5, 7582 CAS.
- T. F. Jaramillo, K. P. Jorgensen, J. Bonde, J. H. Nielsen, S. Horch and I. Chorkendorff, Science, 2007, 317, 100 CrossRef CAS PubMed.
- A. I. Carim, F. H. Saadi, M. P. Soriaga and N. S. Lewis, J. Mater. Chem. A, 2014, 2, 5979 Search PubMed.
- T. F. Jaramillo, J. Bonde, J. Zhang, B. L. Ooi, K. Andersson, J. Ulstrup and I. Chorkendorff, J. Phys. Chem. C, 2008, 112, 17492 CAS.
- A. Phuruangrata, D. J. Hamb, S. Thongtema and J. S. Leeb, Electrochem. Commun., 2009, 11, 1740 CrossRef.
- Y. Jung, J. Shen, Y. Sun and J. J. Cha, ACS Nano, 2014, 8, 9550 CrossRef CAS PubMed.
- H. Tang, K. Dou, C. C. Kaun, Q. Kuang and S. H. Yang, J. Mater. Chem. A, 2014, 2, 360 CAS.
- T. H. Chiang, M. Y. Chen, M. H. Li and M. Y. Yen, J. Mater. Sci., 2013, 48, 6994 CrossRef CAS.
- X. l. Wang, Y. J. Gong, G. Shi, W. L. Chow, K. Keyshar, G. L. Ye, R. Vajtai, J. Lou, Z. Liu, E. Ringe, B. K. Tay and P. M. Ajayan, ACS Nano, 2014, 8, 5125 CrossRef CAS PubMed.
- J. Meyer, R. Khalandovsky, P. Görrn and A. Kahn, Adv. Mater., 2011, 23, 70 CrossRef CAS PubMed.
- K. Xu, F. M. Wang, Z. X. Wang, X. Y. Zhan, Q. S. Wang, Z. Z. Cheng, M. Safdar and J. He, ACS Nano, 2014, 8, 8468 CrossRef CAS PubMed.
- S. Murase and Y. Yang, Adv. Mater., 2012, 24, 2459 CrossRef CAS PubMed.
- X. Lu, M. I. Utama, J. H. Lin, X. Gong, J. Zhang, Y. Y. Zhao, S. T. Pantelides, J. X. Wang, Z. L. Dong, Z. Liu, W. Zhou and Q. H. Xiong, Nano Lett., 2014, 14, 2419 CrossRef CAS PubMed.
- L. Q. Mai, B. Hu, W. Chen, Y. Y. Qi, C. S. Lao, R. S. Yang, Y. Dai and Z. L. Wang, Adv. Mater., 2007, 19, 3712 CrossRef CAS.
- Y. C. Mao, W. Li, X. F. Sun, Y. J. Ma, J. Xia, Y. F. Zhao, X. H. Lu, J. Y. Gan, Z. Q. Liu, J. Chen, P. Liu and Y. X. Tong, CrystEngComm, 2012, 14, 1419 RSC.
- Y. P. Chen, C. L. Lu, L. Xu, Y. Ma, W. H. Hou and J. J. Zhu, CrystEngComm, 2010, 12, 3740 RSC.
- Z. B. Chen, D. Cummins, B. N. Reinecke, E. Clark, M. K. Sunkara and T. F. Jaramillo, Nano Lett., 2011, 11, 4168 CrossRef CAS PubMed.
- F. H. Saadi, A. I. Carim, J. M. Velazquez, J. H. Baricuatro, C. C. L. McCrory, M. l. P. Soriaga and N. S. Lewis, ACS Catal., 2014, 4, 2866 CrossRef CAS.
- J. D. Benck, Z. B. Chen, L. Y. Kuritzky, A. J. Forman and T. F. Jaramillo, ACS Catal., 2012, 2, 1916 CrossRef CAS.
- D. Merki, H. Vrubel, L. Rovelli, S. Fierro and X. L. Hu, Chem. Sci., 2012, 3, 2515 RSC.
- D. Y. Chung, S. K. Park, Y. H. Chung, S. H. Yu and D. H. Lim, Nanoscale, 2014, 6, 2131 RSC.
- Y. Zhang, J. J. Ji, G. F. Han, J. Ju, J. P. Shi, D. L. Ma, J. Y. Sun, Y. S. Zhang, M. J. Li, X. Y. Lang, Y. F. Zhang and Z. F. Liu, ACS Nano, 2014, 8, 8617 CrossRef CAS PubMed.
- X. H. Xia, Z. X. Zheng, Y. Zhang, X. J. Zhao and C. M. Wang, Int. J. Hydrogen Energy, 2014, 39, 9638 CrossRef CAS.
- X. H. Xia, X. Shen, X. J. Zhao, W. C. Ye and C. M. Wang, ChemCatChem, 2015, 7, 2517 CrossRef CAS.
- M. H. Zhuang, Y. Ding, X. W. Ou and Z. T. Luo, Nanoscale, 2017, 9, 4652 RSC.
- Y. P. Huang, H. Y. Lu, H. H. Gu, J. Fu, S. Y. Mo, C. Wei, Y. E. Miao and T. X. Liu, Nanoscale, 2015, 7, 18595 RSC.
- S. Mao, Z. H. Wen, S. Q. Ci, X. R. Guo, K. K. Ostrikov and J. H. Chen, Small, 2015, 11, 414 CrossRef CAS PubMed.
Footnote |
| † Electronic supplementary information (ESI) available. See DOI: 10.1039/c7se00466d |
| This journal is © The Royal Society of Chemistry 2018 |

