DOI:
10.1039/C8SC02653J
(Edge Article)
Chem. Sci., 2018,
9, 8937-8945
Post-transition state bifurcations induce dynamical detours in Pummerer-like reactions†
Received
16th June 2018
, Accepted 25th September 2018
First published on 4th October 2018
Abstract
A post-transition state bifurcation (PTSB) involved in a Pummerer-type rearrangement is characterized using density functional theory (DFT) calculations on potential energy stationary points and direct dynamics simulations. A sensitivity of the ratio of products produced via this PTSB to solvent dielectric constant is revealed and implications of such a dependence for selectivity control of organic reactions are discussed.
Introduction
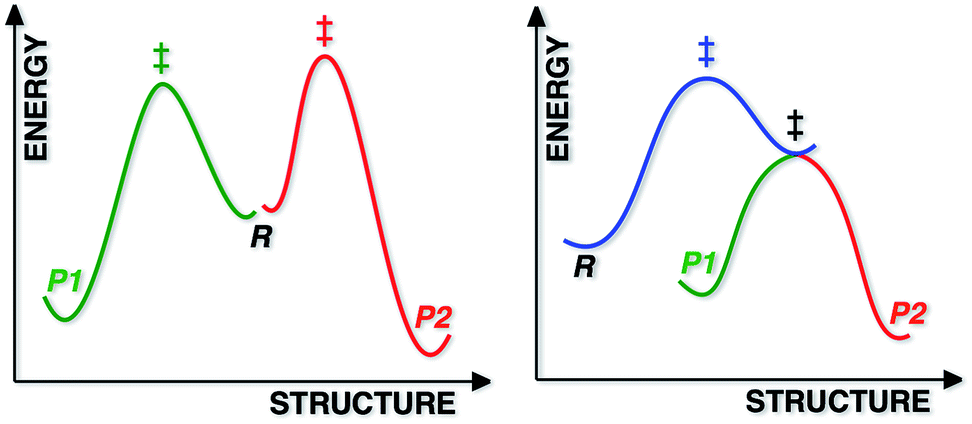
Most reactions displaying kinetic selectivity conform to the scenario shown at the left of Fig. 1; separate transition state structures (TSSs) lead to separate products and the product ratio can be predicted by the energy difference between the two TSSs (for cases with a single reactant conformation or assuming Curtin–Hammett conditions).1 However, a growing number of reactions have been shown to involve reaction coordinates in which a single “ambimodal”2 TSS leads to two (or more) products without passage through any intermediate potential energy surface (PES) minima (a second, lower energy TSS interconverts the two products; Fig. 1, right), i.e., the reaction coordinate bifurcates after the TSS. Although a straightforward stationary point analysis (i.e., comparison of competing TSSs) is not possible for such scenarios, product ratios can be predicted via dynamics simulations in which multiple trajectories are initiated in the region of the ambimodal TSS by giving the optimized TSS a random distribution of potential and kinetic energy, then propagated forward and backward in time; product ratios are predicted based on the frequency of formation of each product.3
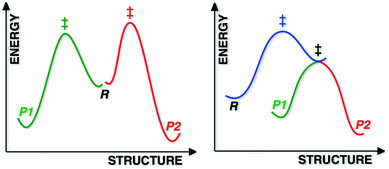 |
| | Fig. 1 Schematic representations of a reaction with two products, each formed via a different TSS (left) and a reaction with a PTSB (right). For the latter, it is inappropriate, but convenient for purposes of illustration, for both the green and red portions of the reaction coordinate to be projected into the same two dimensions as the blue portion. | |
The relevance of non-statistical dynamic effects4 and reaction coordinates with post-transition state bifurcations (PTSBs)3,5 to synthetic organic and organometallic chemistry is becoming clear.5g,i,6 PTSBs have been reported for a variety of reaction types, the most common being pericyclic reactions, carbocation rearrangements and organometallic reactions involving electrophilic addition to π-bonds.5i Here we disclose evidence for a possible PTSB in a Pummerer-type reaction of vinylsulfones, which is related to all three of these reaction classes: it involves a combination of pericyclic reactions, carbocation intermediates and a TSS resembling those expected for the addition of an electrophile to a π-bond. We analyse in detail the origins of selectivity for this reaction in terms of existing models and propose a new model for selectivity control.
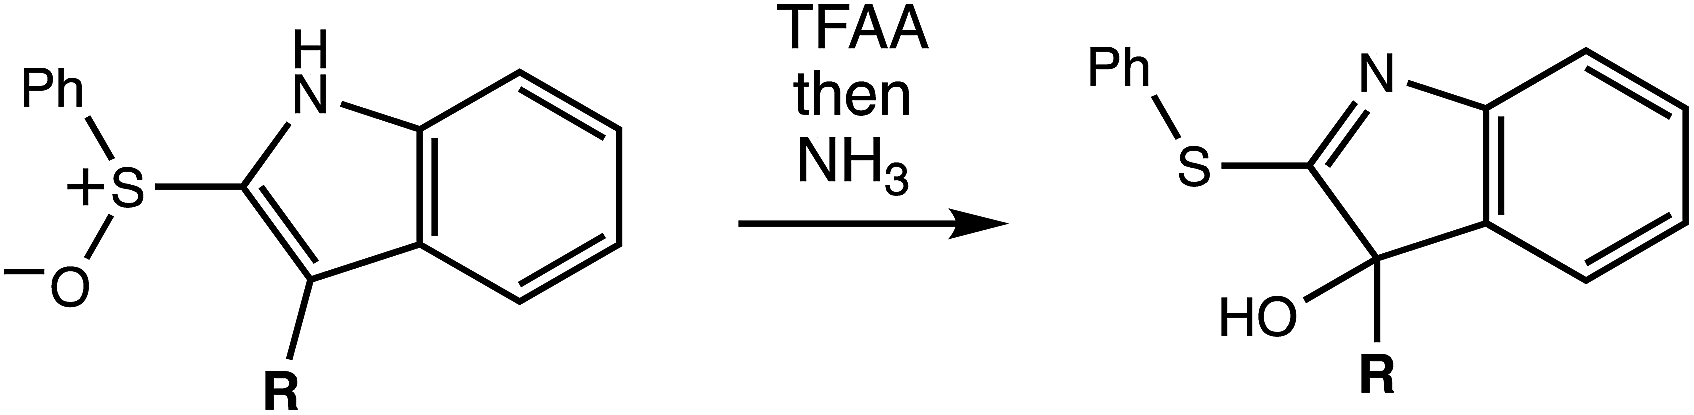
The reaction in question is shown in Scheme 1. Initially, we examined reactions of this type in order to rationalize and predict their selectivity in the context of a natural product total synthesis (i.e., involving a complicated R group), but the results of our computations led us down an unexpected path toward new fundamental, potentially general, insights into dynamically controlled selectivity.
 |
| | Scheme 1 Rearrangement reaction that inspired the computations described herein. | |
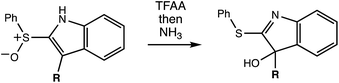
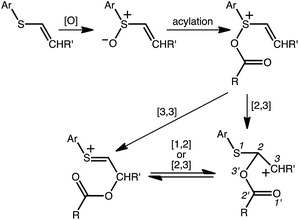
A reasonable mechanism for the Pummerer-type reaction of a vinylsulfone is shown in Scheme 2. The oxygen of the vinylsulfone (generally formed via oxidation of a thioether, as shown) is first acylated. The resulting cation can then rearrange directly to the sulfur-stabilized carbocation product shown via [3,3] sigmatropic shift.7 Alternatively, a [2,3]-shift could occur to provide a carbocation that could be trapped by a nucleophile or could rearrange to form the product that would be derived from [3,3]-shift via a [1,2]-shift (in which O3′ becomes attached to C3) or a [2,3]-shift (in which O1′ becomes attached to C3). The [3,3]-shift product could be trapped by a nucleophile or be deprotonated to form an aryl/vinyl thioether. The product shown in Scheme 1 would be derived from a version of the [3,3] product in which the indole nitrogen is in conjugation with the carbocation, allowing for NH deprotonation rather than CH deprotonation to occur (Fig. 2).
 |
| | Scheme 2 Proposed mechanistic pathways. | |
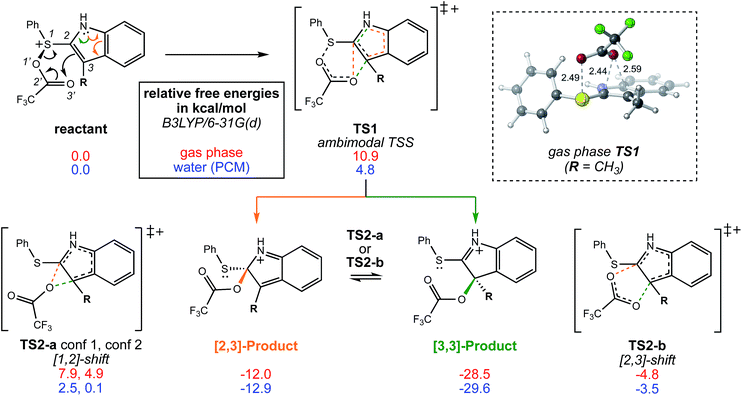 |
| | Fig. 2 The bifurcating reaction scheme investigated in this study, along with a CYLview14 image of TS1 in the gas phase showing the trifluoroacetyl oxygen's approach to the π-bond of the indole ring. The atom numbers shown do not correspond to those used to name the sigmatropic shifts. Relative free energies shown are for stationary points optimized in the gas phase (red) and in water using a polarized continuum solvent model (PCM, blue). Stationary points were optimized at the B3LYP/6-31G(d) level of theory. | |
Methods
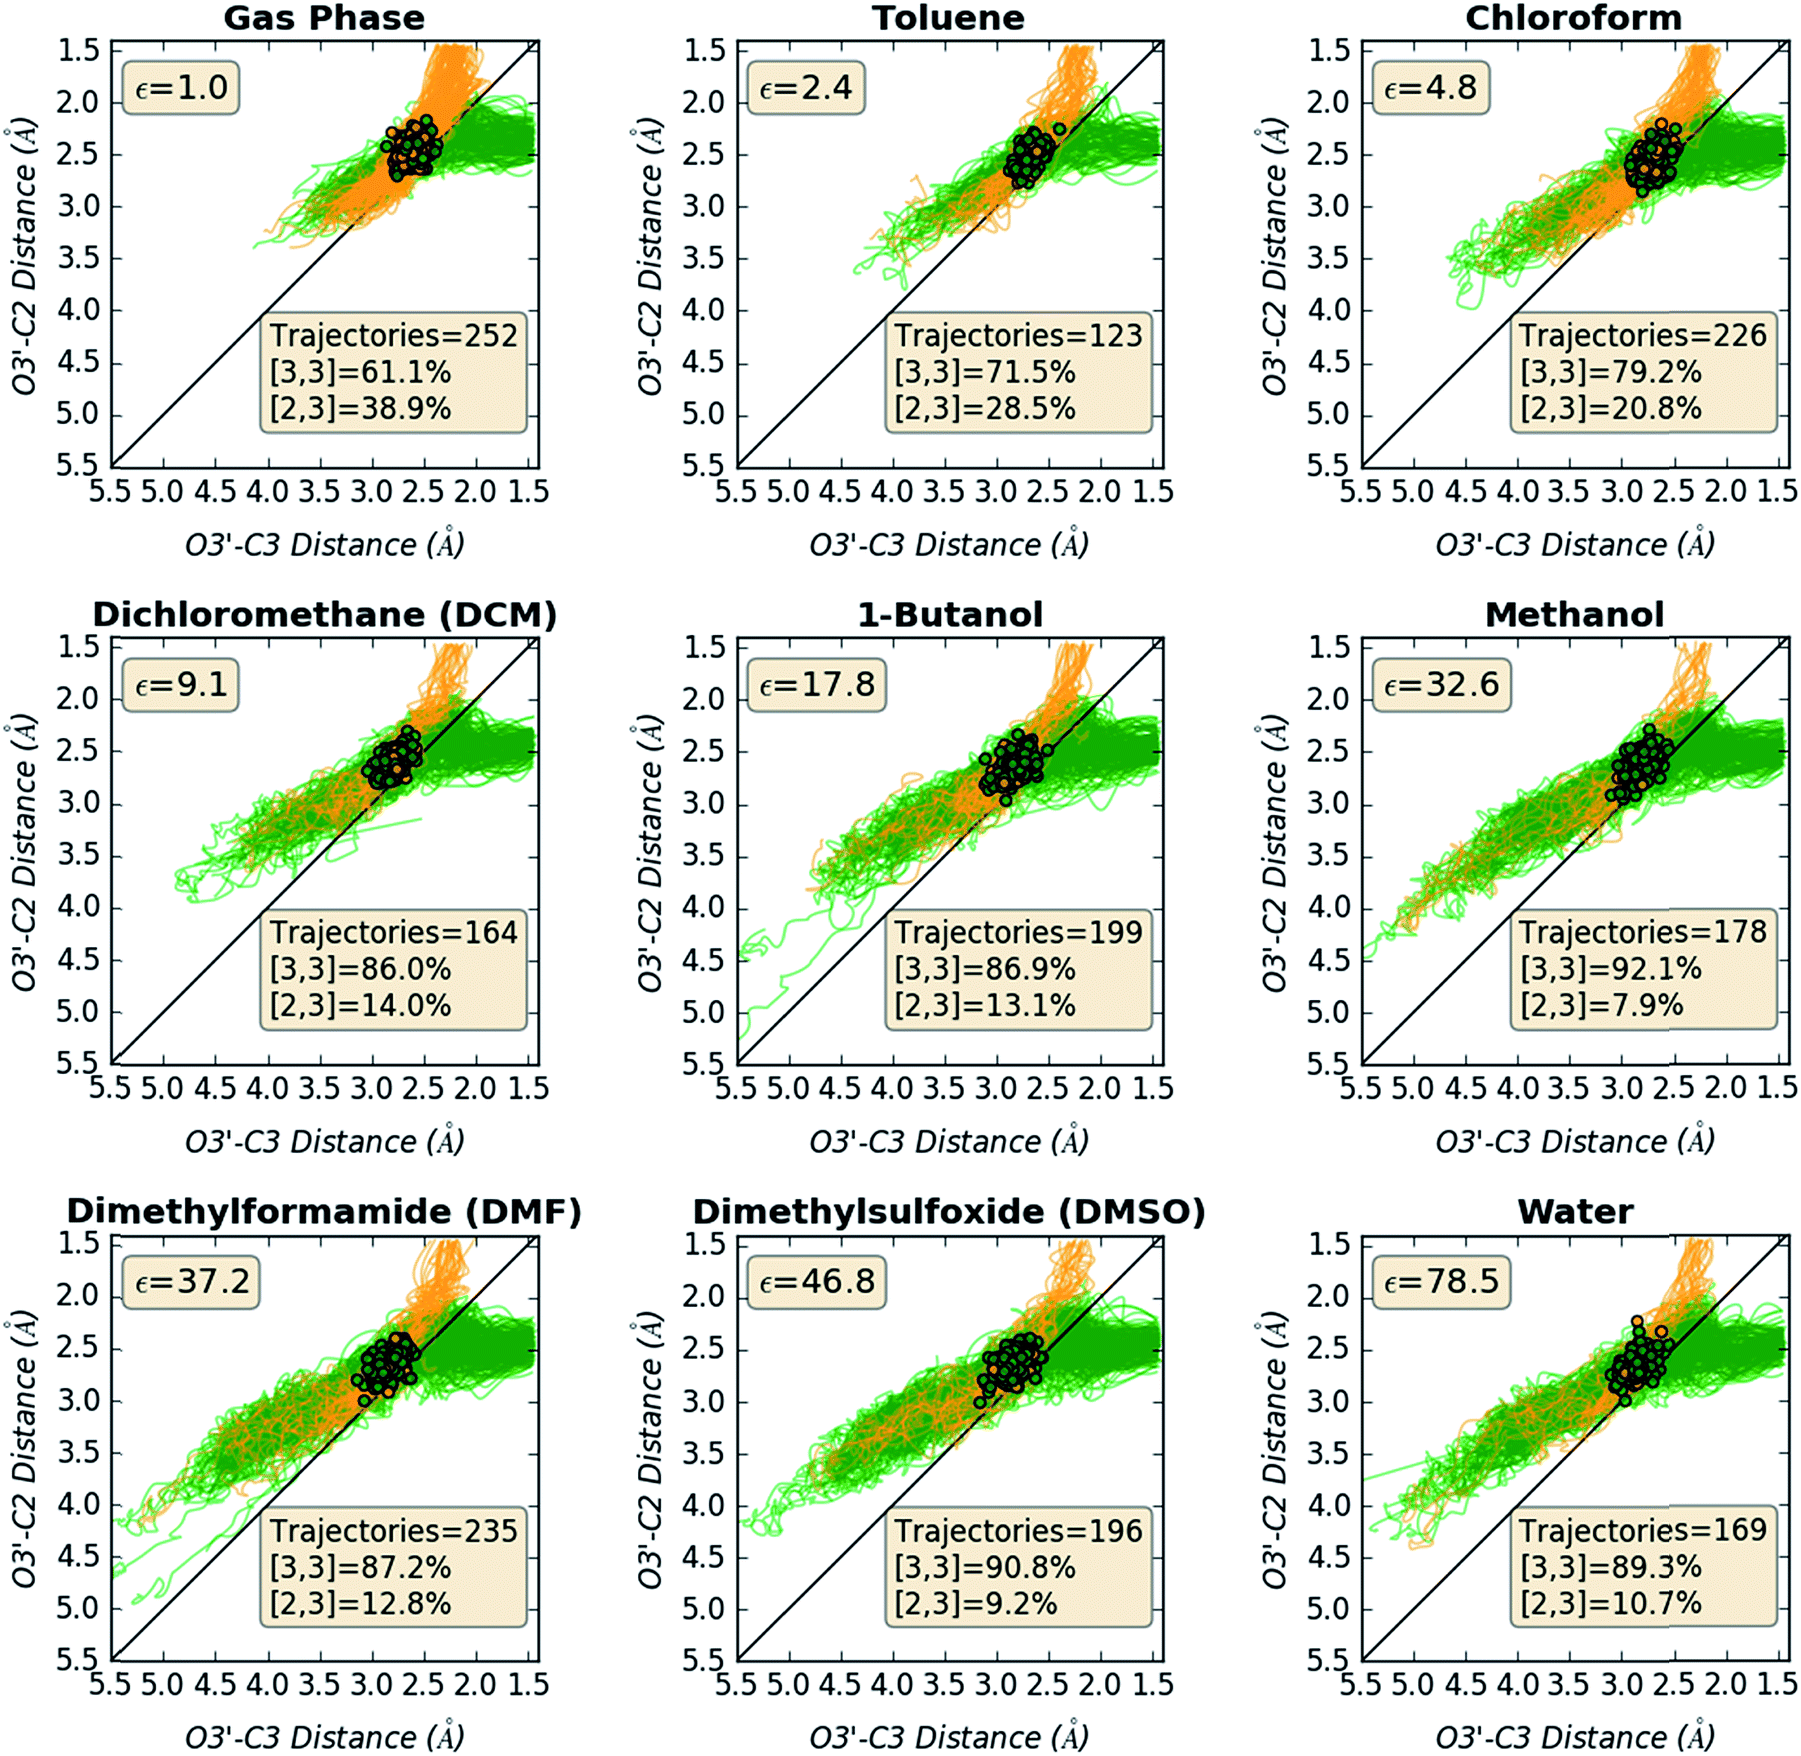
Geometry optimizations and energy calculations were conducted using Gaussian098 at the B3LYP9/6-31G(d)10 level of theory with various implicit solvents using the polarizable continuum model (PCM).11 Intrinsic reaction coordinates (IRCs) were computed for key TSSs.12 Molecular dynamics simulations were conducted using Singleton's Progdyn13 program, which interfaces with Gaussian09 to calculate force constants at each time step along a trajectory. Progdyn generates starting geometries by taking as input a high-precision frequency calculation for an optimized transition state structure (in this case, TS1; see Fig. 2) and randomly populating the vibrational modes with kinetic and potential energy sampled from a Boltzmann distribution of energies at 298 K. A starting geometry (with energy within 1 kcal mol−1 of the desired total energy of the molecule) is then propagated both forward and backward in time using 1 fs time steps, where at each time step the nuclei are propagated classically and the electronic structure is calculated quantum mechanically with Gaussian. The following geometric stop criteria (atom numbers in Fig. 2) were used to determine the outcome of each trajectory: a trajectory was labelled as forming the reactant when the S1–O1′ distance dropped below 1.90 Å. A trajectory was labelled as forming the [2,3] product when the O3′–C2 distance dropped below 1.50 Å. A trajectory was labelled as forming the [3,3] product when the O3′–C3 distance dropped below 1.50 Å.
Results and discussion
Parent system: R = CH3
We begin by describing results for the R = CH3 system. The PTSB for the reaction from Scheme 1 is outlined in Fig. 2. The transition state structure TS1 was found, in both the gas phase and all solvents examined, to be an ambimodal TSS, leading to two products via trajectories that do not pass through any structures that could be optimized as minima (vide infra). As shown in the inset in Fig. 2, short distances (comparable to that of the breaking S–O bond) are found between one oxygen atom of the trifluoracetyl group and both carbon atoms 2 and 3 in this TSS. Two types of TSSs were located that interconvert the [2,3] and [3,3] products (Scheme 2, bottom), one involving a [1,2]-shift (TS2-a) and the other involving a [2,3]-shift (TS2-b). Two different conformations of the [1,2]-shift TSS, TS2-a, could be optimized (dubbed conf 1 and conf 2). Though TS2-a conf 2 is a lower energy TSS, TS2-a conf 1 is similar in geometry to TS1 (Fig. 3), with both conformations of TS2-a differing from TS1 primarily in the orientation of their trifluoracetyl groups. TS2-a conf 1 is accessible directly from TS1, since both TS1 and TS2-a involve the same oxygen atom bridging between C2 and C3. However, TS2-b is lower in energy than both conformations of TS2-a (Fig. 2) and thus would be the preferred route to interconvert the two products. This scenario differs from those observed for many other reactions involving PTSBs, where the interconversion of products is often assumed to occur via a TSS connected directly to the ambimodal TSS, i.e., whose geometry resides on the portion of the PES expected to be sampled during dynamics trajectory calculations.5
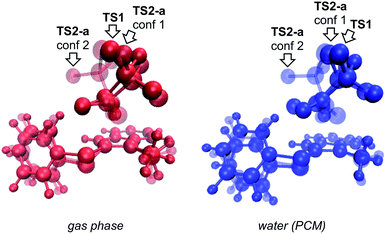 |
| | Fig. 3 Overlays of TS1 (the ambimodal TSS leading to both [2,3]- and [3,3] products) and two conformations of TS2-a (the TSS interconverting the [2,3]- and [3,3] products via a [1,2]-shift), showing that all three stationary points have very similar geometries (particularly TS1 and TS2-a conf 1). This implies that they lie close to one another on the potential energy surface. The IRC initiated from TS1 in the gas phase led to the [3,3] product, but an IRC could not be completed for TS1 in implicit water solvent. Image was made using VMD.15 | |
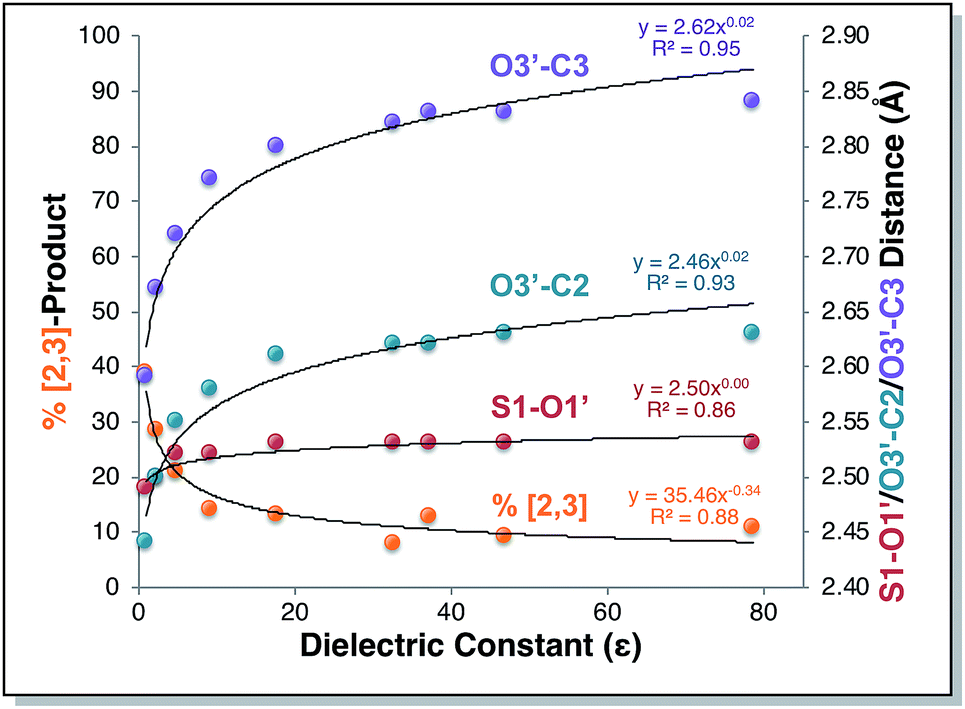
Direct dynamics trajectories initiated from the region of TS1 in a variety of solvents with different dielectric constants show that both [2,3] and [3,3] products are indeed accessible from TS1 (Fig. 4). In fact, the ratio of [2,3] and [3,3] products formed (i.e., directly from trajectories, without subsequent interconversion of products) is correlated with the dielectric constant of the solvent (Fig. 4, orange dots). For the reaction described here, this selectivity would be obliterated by rapid product equilibration, but for other systems, such solvent dependent dynamically controlled selectivity might be preserved and applied in a synthetically useful manner, a subject of on-going research. A caveat is in order, however. The calculations employed here involve reoptimization of the solvent field at each step of a trajectory, while explicit solvent will take time to reorganize in response to a changing dipole moment (the continuum solvation calculations used also only affect the potential energy, not the kinetic energy). Reorganization of the solvent contacting the TSS is likely to be considerably slower than product formation (hundreds of fs versus ≲100 fs).16 As a result, it is not yet clear whether inclusion of explicit solvent in trajectory simulations may modulate or even negate the effects observed here, but research into this issue is ongoing.
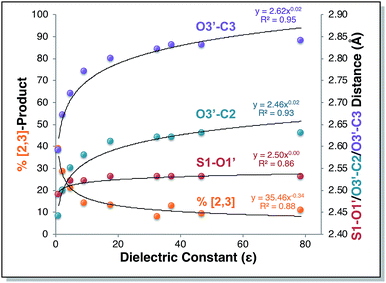 |
| | Fig. 4 Outcomes of molecular dynamics trajectories initiated from TS1 in the gas phase and in various implicit solvents (PCM). The percentage of [2,3] product formed as well as three bond distances were correlated with the solvent dielectric constant: S1–O1′, O3′–C2′, and O3′–C3 (red, cyan, and purple dots, respectively, righthand axis). These distances, plotted on the secondary y-axis, correspond to those for the optimized TSSs in each solvent, which were also the TSSs from which dynamics trajectories were initiated. The numerical data used to make these plots can be found in the ESI,† along with a plot correlating % [2,3] product with each of the three key bond distances and a plot of the difference between O3′–C2′ and O3′–C3 vs. dielectric constant. | |
Is the product ratio for this reaction related to solvent-induced geometric changes? The geometries of stationary points on the PES for this reaction do not appear at first glance to change significantly in polar versus nonpolar environments (see ESI† for RMSDs for each stationary point in the gas phase and in water). However, there does appear to be a correlation between key interatomic distances in TS1 and [2,3]/[3,3] product ratio (Fig. 4, red, cyan, and purple dots). While the S1–O1′ distance did not vary much with dielectric constant, both the O3′–C2 and O3′–C3 distances increased with increasing ε. An increase in both O–C distances led to an increase in selectivity for [3,3] product (i.e., less [2,3] product). If one expects that a “looser” transition state structure would lead to lower selectivity, this result is surprising. However, such an assumption is unlikely general and clearly not borne out here. The difference between the O3′–C2 and O3′–C3 distances also increased with increasing ε (see ESI† for a plot; correlations between differences in key bond lengths and selectivity have been reported for cycloadditions with PTSBs),17i.e., a shift further to the C2 side of the C2–C3 bond in the TSS correlates with increased formation of the [3,3] product, which arises from O3′–C3 bond formation; this also appears to be counterintuitive at first blush, but is consistent with the TSSs in more polar solvents being earlier and residing along reaction coordinates in which O3′ passes by C2 en route to C3.
Why is the [2,3] vs. [3,3] selectivity sensitive to dielectric constant, with a higher percentage of [3,3] product formed as the dielectric constant is increased? To answer this question, we set out to determine if this dynamical preference could be rationalized using (1) analysis of the extent of dynamic matching between each product and the reaction coordinate vector and/or (2) arguments based on the shapes of potential energy surfaces (PESs).
Dynamic matching
It is reasonable to hypothesize that dynamic matching may control the selectivity of a reaction with a PTSB.18 That is, roughly, if the directions in which the atomic vectors are pointing in the imaginary vibrational mode “point” in the direction of one product more than another, that product will be formed preferentially in molecular dynamics simulations. This predicted preference can be quantified using Carpenter's Newton program (Fig. 5).19 While this program accurately predicted the product preference in a previously examined reaction with a PTSB,20 that is not the case here. While the preference for [3,3] product formation was correctly predicted for both the gas phase and water (Table 1), the difference in product ratios between the two systems was not predicted. Interestingly, the predicted ratios in both cases were very similar and essentially at the midpoint between the two systems' calculated product ratios. Thus, it appears that the effect of solvent on this particular system does more than simply manipulate the geometry of the TSS and the nature of its imaginary vibrational mode.
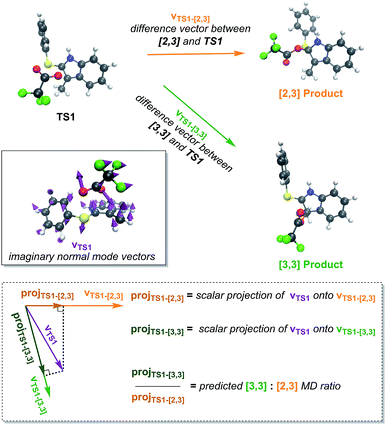 |
| | Fig. 5 A pictorial representation of the Newton19 program procedure used to predict dynamical preferences of an ambimodal TSS. The 3N-dimensional vector corresponding to motion along the TSS's imaginary vibrational mode (vTS1) is projected onto the vectors that correspond to changing the TS1 geometry to the geometry of each of the possible products (vTS1-[2,3] and vTS1-[3,3]). These projections are meant to quantify how well each product is “dynamically matched” to motion along the reaction coordinate for the TSS. The ratio of these projections is then used to predict the ratio of products expected from molecular dynamics trajectories. Here, this method did not predict the difference in product ratios seen between trajectories run in the gas phase and in implicit water. | |
Table 1 Results from the Newton19 program for predicting dynamic matching compared to product ratios calculated from running molecular dynamics trajectories. While the preference for [3,3] product was borne out in the Newton predictions, the difference in product ratios between trajectories in the gas phase and in water was not correctly predicted
| Solvent |
Newton calculations |
Trajectories |
| Dot products ([2,3], [3,3]) |
Predicted MD ratio ([2,3]![[thin space (1/6-em)]](https://www.rsc.org/images/entities/char_2009.gif) :[3,3]) :[3,3]) |
Calculated MD ratio ([2,3]:[3,3]) |
| Gas phase |
19.0, 73.7 |
20:80 |
39:61 |
| Water |
21.2, 75.6 |
22:78 |
11:89 |
PES features
3-Dimensional PESs, as well as their projections onto contour plots in the x–y plane, for the gas phase and water reactions are shown in Fig. 6. The energy of each point on these surfaces is taken relative to the electronic energy of the reactant, such that the energy of TS1 on these surfaces is equal to its barrier in terms of electronic energy. These plots graphically depict two differences between the gas phase and water reactions that were clear from straightforward analysis of stationary point geometries and energies: (1) the location of TS1, in terms of the geometrical parameters plotted, differs: both the O2′–C3 and O3′–C3 distances are greater in water. (2) The energy of TS1 relative to the reactant in water is lower than in the gas phase. Comparison of the plots for the gas phase and water reactions reveals two additional key differences: (3) the region around TS1 is much flatter in water than in the gas phase. Flattening of PESs around TSSs may be a general feature of reactions whose barriers are lowered via interactions with solvent or catalysts.5g Again, this result initially was puzzling, as a flatter PES is typically associated with a loss of selectivity. (4) In the gas phase, the IRC is very close to the ridge that separates products, but in water it is offset from it. As shown in Fig. 6B, although both IRCs ultimately arrive at the [3,3] product, comparison of the O3′–C2 distances along each IRC indicates that O3′ gets almost 0.2 Å closer to C2 in the gas phase than in water.21 While these PES features are consistent with a greater tendency to form [2,3] product in the gas phase, in that the steepest descent pathway leads directly to the ridge that must be crossed to access this product, the implications of these PES features are perhaps best revealed through an analysis of the progression of trajectories in time.
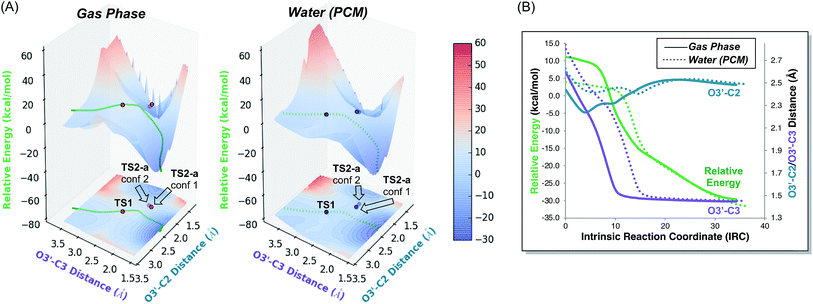 |
| | Fig. 6 (A) PESs for the parent (R = CH3) system in the gas phase (left) and in implicit H2O (right) with electronic energies in kcal mol−1 relative to the reactant. These surfaces were generated by taking the structures along the portion of the IRC for each system that led to product and incrementally changing the O3′–C2 and O3′–C3 distances, while allowing the rest of the molecule to relax, and calculating the electronic energy of the resulting structure. The IRCs for both the gas phase and implicit H2O with respect to the two relevant geometric parameters are also plotted on the surfaces. Locations of TS1, TS2-a conf 1, and TS2-a conf 2 are also labelled on each surface, with the opacity of each point set to match the opacity of its structure in Fig. 3. (B) IRCs12,22 for TS1 in the gas phase (solid) and in implicit H2O (dotted), starting at TS1 and progressing toward the rearrangement product, with electronic energies in kcal mol−1 relative to the reactant. Both IRCs ultimately arrive at the [3,3] product. | |
Analysis of structural changes along trajectories
Structural changes along trajectories were analyzed in hopes of finding particular geometric features that would be useful in distinguishing trajectories that formed [2,3] versus [3,3] products. O3′–C2 and O3′–C3 distances along all productive trajectories in each solvent are plotted in Fig. 7. As can be seen by the starting points in the plots, which are colored by product made, starting points leading to different products are not well-separated, again indicating that these two geometric criteria alone are not enough to predict the product that will be formed in a trajectory.
 |
| | Fig. 7 Paths of trajectories, with respect to O3′–C2 and O3′–C3 distances. The plots show the starting points (clustered points) of all trajectories for each system and their geometric changes along the trajectories colored by the product made: yellow-orange for [2,3] product (top region of the graphs, where the O3′–C2 distance is small) and green for [3,3] product (top right region of the graphs, where the O3′–C3 distance is small). The bottom left region of the graphs corresponds to the reactant side of the trajectories. | |
As can be seen in Fig. 8, one feature that is consistently different between trajectories that form [2,3] product versus [3,3] product is the mean time to product formation. Combining this information with the information above on the topography of the PESs, we propose that trajectories that are able to linger in the region between the TSS and valley-ridge inflection (VRI) point are more likely to form the [3,3] product. Reasons that these trajectories linger longer in water before committing to product, thereby mitigating the effects of dynamic matching, include: (1) the TSS region on the PES for reaction in water is flatter than the TSS region for reaction in the gas phase (Fig. 6A), allowing some trajectories to wander before falling to product.23 (2) The steepest descent pathway on the PES for reaction in water skirts the ridge, suggesting that trajectories that are not dynamically matched for formation of the [2,3] product (this dynamic matching would lead to short-time trajectories) may encounter a barrier (akin to bumping into the side of the ridge) before turning back towards the [3,3] product region.
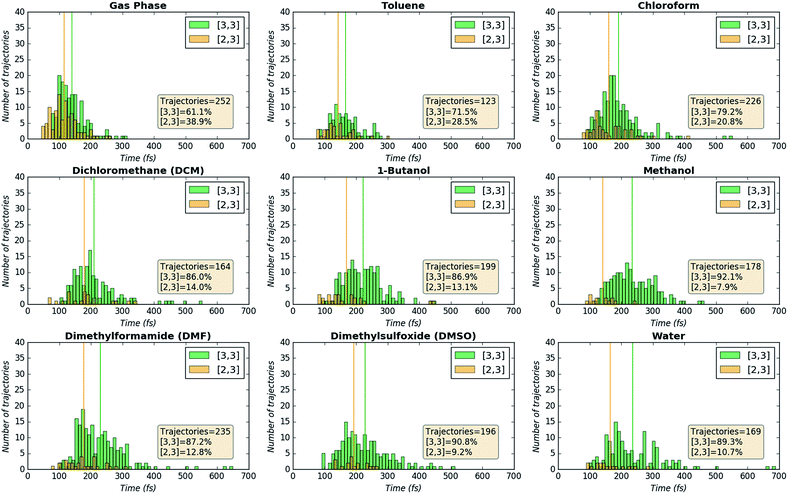 |
| | Fig. 8 Product formation timing histograms. Trajectories were sorted into 10 fs wide bins, with green bins corresponding to trajectories forming [3,3] product and yellow-orange bins corresponding to trajectories forming [2,3] product. The vertical lines indicate the mean time to product formation, colored appropriately. | |
Generality
Though we have only discussed one type of Pummerer-like rearrangement involving a PTSB above, we have reason to believe this behavior is potentially generalizable for related systems. The first test we used to explore the generality of our conclusions was to run molecular dynamics simulations with different R-groups on TS1. Effects of the size of this R-group were tested using R = H and R = t-butyl systems (Table 2). The H substitution led to significantly more [3,3] product (almost exclusively [3,3] product, in fact) while the t-butyl group led to a slightly larger proportion of [2,3] product in the gas phase and the same product ratio in water, compared to the parent system. This result is not particularly surprising—the R-group modified is on C3, and the CF3 of the migrating carboxyl group is “tipped” to the side of C3 (see ball-and-stick picture of the parent system TS1, inset in Fig. 2).24 Decreasing the steric bulk at this location would be expected to make migration in this direction easier, and increasing steric bulk would presumably do the converse, as we observe.
Table 2 Molecular dynamics trajectory results for R-group substitutions. Starting points and paths of trajectories a la Fig. 7 for all systems in this can be found in the ESI
| R-group |
Solvent |
% [2,3] product |
% [3,3] product |
Number of trajectories |
| H |
Gas phase |
2% |
98% |
137 |
| Water |
0% |
100% |
107 |
|
t-Butyl |
Gas phase |
46% |
54% |
134 |
| Water |
11% |
89% |
104 |
| CF3 |
Gas phase |
2% |
98% |
147 |
| Water |
3% |
97% |
116 |
To probe for electronic effects, the R = CF3 system was examined. A significant difference in selectivity in different solvents was not observed in this case, and [3,3] product was formed almost exclusively. The inductively electron-withdrawing capability of CF3 compared to CH3 is expected to increase the electrophilicity of C3 more than C2, inducing the oxygen of the trifluoroacetate group to more readily attack at the C3 position, as observed.
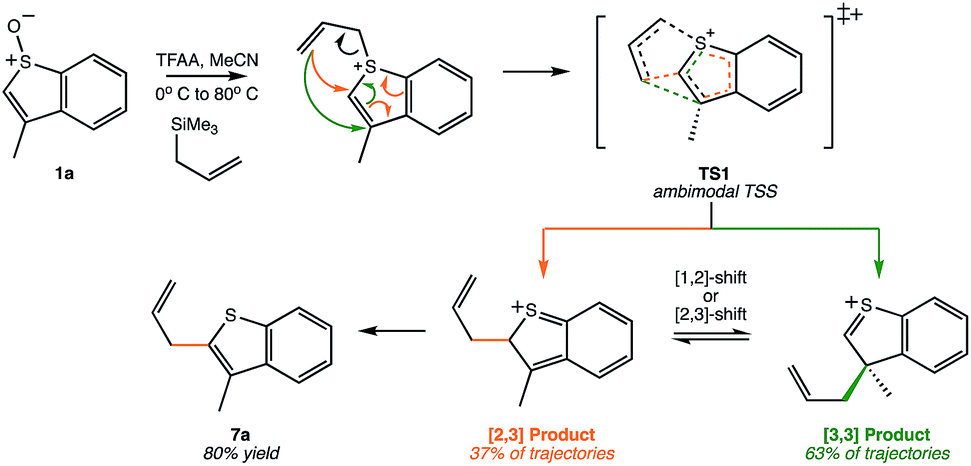
Another Pummerer-like reaction, the benzothiophene “interrupted Pummerer” rearrangement shown in Scheme 3, was recently described by the Procter group.25,26 The product of formal [2,3]-shift was formed in 80% yield, but this was attributed to a [3,3]-shift followed by a subsequent [1,2]-shift. However, our preliminary molecular dynamics simulations on TS1 for this system (gas phase, B3LYP/6-31G(d)) indicate that, out of 51 productive trajectories, 19 (37%) made the [2,3] product directly, and 32 (63%) made the [3,3] product. Thus, this Pummerer-like reaction also appears to involve a selectivity-determining PTSB.
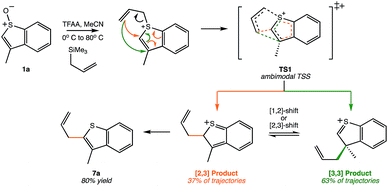 |
| | Scheme 3 A recently published synthetic example of a similar reaction that may involve a PTSB.25,26 This example corresponds to reactant 1a in this scheme of the original publication. | |
Conclusions
We have described here another family of reactions for which PTSBs may play key roles in determining product selectivity.5a,i In this case, dynamical tendencies cause some trajectories to take a detour to [2,3] product en route to the final [3,3] product (this [2,3] to [3,3] product interconversion likely involves a TSS that is not directly connected to the ambimodal TSS). Unexpected or unwanted side products may result from such detours. In addition, the selectivity predicted for this reaction using direct dynamics simulations varies greatly in response to solvent dielectric constant. Changes in selectivity are correlated to changes in TSS geometries, as well as changes in the topography of the PES. The latter appears to be related to lingering of some trajectories before they commit to product in more polar systems, which is correlated to reduced formation of [2,3] products. Such “lingering without full equilibration” was also found to be important for several additional systems with PTSBs.5h,27 If this phenomenon proves to be at all general, it would provide a starting point for learning how to control selectivity in a range of reactions with PTSBs. While further work is necessary (and ongoing) to pin down the origins of the solvent-dependent dynamically controlled selectivity5i,18b,26,28 observed in our simulations, we believe that the possibility that simple changes to solvent might allow synthetic chemists to modulate selectivity for reactions with PTSBs demands the effort.
Conflicts of interest
There are no conflicts to declare.
Acknowledgements
We gratefully acknowledge the US National Science Foundation (CHE-1565933 and CHE-030089 via XSEDE) for support. We also thank Prof. Barry Carpenter for guidance and for sharing his Newton code.
Notes and references
-
(a) J. I. Seeman, J. Chem. Educ., 1986, 63, 42–48 CrossRef CAS;
(b) J. I. Seeman, Chem. Rev., 1983, 83, 83–134 CrossRef CAS;
(c) D. Y. Curtin, Rec. Chem. Prog., 1954, 15, 111–128 CAS.
- H. V. Pham and K. N. Houk, J. Org. Chem., 2014, 79, 8968–8976 CrossRef CAS PubMed.
- R. P. Pemberton, Y. J. Hong and D. J. Tantillo, Pure Appl. Chem., 2013, 85, 1949–1957 CAS.
-
(a) Y. Oyola and D. A. Singleton, J. Am. Chem. Soc., 2009, 131, 3130–3131 CrossRef CAS PubMed;
(b) L. Sun, K. Song and W. L. Hase, Science, 2002, 296, 875–878 CrossRef CAS PubMed;
(c) C. Doubleday, K. Bolton and W. L. Hase, J. Am. Chem. Soc., 1997, 119, 5251–5252 CrossRef CAS;
(d) L. Xu, C. E. Doubleday and K. N. Houk, J. Am. Chem. Soc., 2010, 132, 3029–3037 CrossRef CAS PubMed;
(e) L. Xu, C. E. Doubleday and K. N. Houk, J. Am. Chem. Soc., 2011, 133, 17848–17854 CrossRef CAS PubMed;
(f) K. Black, P. Liu, L. Xu, C. Doubleday and K. N. Houk, Proc. Natl. Acad. Sci. U. S. A., 2012, 109, 12860–12865 CrossRef CAS PubMed;
(g) M. R. Siebert, P. Manikandan, R. Sun, D. J. Tantillo and W. L. Hase, J. Chem. Theory Comput., 2012, 8, 1212–1222 CrossRef CAS PubMed.
-
(a) D. H. Ess, S. E. Wheeler, R. G. Iafe, L. Xu, N. Çelebi-Ölçüm and K. N. Houk, Angew. Chem., Int. Ed., 2008, 47, 7592–7601 CrossRef CAS PubMed;
(b) M. Weitman and D. T. Major, J. Am. Chem. Soc., 2010, 132, 6349–6360 CrossRef CAS PubMed;
(c) D. T. Major and M. Weitman, J. Am. Chem. Soc., 2012, 134, 19454–19462 CrossRef CAS PubMed;
(d) C. Gonzalez and H. B. Schlegel, J. Phys. Chem., 1990, 94, 5523–5527 CrossRef CAS;
(e) H. M. L. Davies and Y. Lian, Acc. Chem. Res., 2012, 45, 923–935 CrossRef CAS PubMed;
(f) Y. J. Hong and D. J. Tantillo, Nat. Chem., 2014, 6, 104–111 CrossRef CAS PubMed;
(g) S. R. Hare and D. J. Tantillo, Chem. Sci., 2017, 8, 1442–1449 RSC;
(h) S. R. Hare, R. P. Pemberton and D. J. Tantillo, J. Am. Chem. Soc., 2017, 139, 7485–7493 CrossRef CAS PubMed;
(i) S. R. Hare and D. J. Tantillo, Pure Appl. Chem., 2017, 89, 679–698 CAS.
-
(a) L. Ye, Y. Wang, D. H. Aue and L. Zhang, J. Am. Chem. Soc., 2012, 134, 31–34 CrossRef CAS PubMed;
(b) H. Yamataka, M. Sato, H. Hasegawa and S. C. Ammal, Faraday Discuss., 2010, 145, 327–340 RSC;
(c) E. L. Noey, X. Wang and K. N. Houk, J. Org. Chem., 2011, 76, 3477–3483 CrossRef CAS PubMed;
(d) Y. Harabuchi, Y. Ono, S. Maeda and T. Taketsugu, J. Chem. Phys., 2015, 143, 014301 CrossRef PubMed;
(e) M. M. Hansmann, S. Tsupova, M. Rudolph, F. Rominger and A. S. Hashmi, Chemistry, 2014, 20, 2215–2223 CrossRef CAS PubMed;
(f) J. H. Hansen, T. M. Gregg, S. R. Ovalles, Y. Lian, J. Autschbach and H. M. Davies, J. Am. Chem. Soc., 2011, 133, 5076–5085 CrossRef CAS PubMed.
-
(a) F. B. Souza, A. Shamim, L. M. Argomedo, D. C. Pimenta and H. A. Stefani, Mol. Diversity, 2015, 19, 773–785 CrossRef CAS PubMed;
(b) L. H. Smith, S. C. Coote, H. F. Sneddon and D. J. Procter, Angew. Chem., Int. Ed., 2010, 49, 5832–5844 CrossRef CAS PubMed.
-
M. J. Frisch, G. W. Trucks, H. B. Schlegel, G. E. Scuseria, M. A. Robb, J. R. Cheeseman, G. Scalmani, V. Barone, B. Mennucci, G. A. Petersson, H. Nakatsuji, M. Caricato, X. Li, H. P. Hratchian, A. F. Izmaylov, J. Bloino, G. Zheng, J. L. Sonnenberg, M. Hada, M. Ehara, K. Toyota, R. Fukuda, J. Hasegawa, M. Ishida, T. Nakajima, Y. Honda, O. Kitao, H. Nakai, T. Vreven, J. A. Montgomery, J. E. Peralta, F. Ogliaro, M. Bearpark, J. J. Heyd, E. Brothers, K. N. Kudin, V. N. Staroverov, R. Kobayashi, J. Normand, K. Raghavachari, A. Rendell, J. C. Burant, S. S. Iyengar, J. Tomasi, M. Cossi, N. Rega, J. M. Millam, M. Klene, J. E. Knox, J. B. Cross, V. Bakken, C. Adamo, J. Jaramillo, R. Gomperts, R. E. Stratmann, O. Yazyev, A. J. Austin, R. Cammi, C. Pomelli, J. W. Ochterski, R. L. Martin, K. Morokuma, V. G. Zakrzewski, G. A. Voth, P. Salvador, J. J. Dannenberg, S. Dapprich, A. D. Daniels, Ö. Farkas, J. B. Foresman, J. V. Ortiz, J. Cioslowski and D. J. Fox, Gaussian 09, Revision D.02, Wallingford, CT, 2009 Search PubMed.
-
(a) A. D. Becke, J. Chem. Phys., 1993, 98, 1372–1377 CrossRef CAS;
(b) A. D. Becke, J. Chem. Phys., 1993, 98, 5648–5652 CrossRef CAS.
- P. C. Hariharan and J. A. Pople, Theor. Chem. Acc., 1973, 28, 213–222 Search PubMed.
-
R. Cammi, B. Mennucci and J. Tomasi, in Computational Chemistry: Reviews of Current Trends, ed. J. Leszczynski, World Scientific Publishing Co. Pte. Ltd., Singapore, 2003, vol. 8 Search PubMed.
-
(a) K. Fukui, Acc. Chem. Res., 1981, 14, 363–368 CrossRef CAS;
(b) L. W. Chung, W. M. C. Sameera, R. Ramozzi, A. J. Page, M. Hatanaka, G. P. Petrova, T. V. Harris, X. Li, Z. Ke, F. Liu, H.-B. Li, L. Ding and K. Morokuma, Chem. Rev., 2015, 115, 5678–5796 CrossRef CAS PubMed.
- D. A. Singleton, C. Hang, M. J. Szymanski and E. E. Greenwald, J. Am. Chem. Soc., 2003, 125, 1176–1177 CrossRef CAS PubMed.
-
C. Y. Legault, CYLview, Université de Sherbrooke, 2009 Search PubMed.
- W. Humphrey, A. Dalke and K. Schulten, J. Mol. Graphics, 1996, 14, 33–38 CrossRef CAS PubMed.
-
(a) S. Ghosh, A. V. Soudackov and S. Hammes-Schiffer, J. Chem. Theory Comput., 2016, 12, 2917–2925 CrossRef CAS PubMed;
(b) S. Ghosh, S. Horvath, A. V. Soudackov and S. Hammes-Schiffer, J. Chem. Theory Comput., 2014, 10, 2091–2102 CrossRef CAS PubMed;
(c) M. K. Ludlow, A. V. Soudackov and S. Hammes-Schiffer, J. Am. Chem. Soc., 2009, 131, 7094–7102 CrossRef CAS PubMed.
- Z. Yang, X. Dong, Y. Yu, P. Yu, Y. Li, C. Jamieson and K. N. Houk, J. Am. Chem. Soc., 2018, 140, 3061–3067 CrossRef CAS PubMed.
-
(a) L. Tork, G. Jimenez-Oses, C. Doubleday, F. Liu and K. N. Houk, J. Am. Chem. Soc., 2015, 137, 4749–4758 CrossRef CAS PubMed;
(b) Z. Chen, Y. Nieves-Quinones, J. R. Waas and D. A. Singleton, J. Am. Chem. Soc., 2014, 136, 13122–13125 CrossRef CAS PubMed;
(c) Z. Wang, J. S. Hirschi and D. A. Singleton, Angew. Chem., Int. Ed., 2009, 48, 9156–9159 CrossRef CAS PubMed;
(d) B. K. Carpenter, J. Am. Chem. Soc., 1995, 117, 6336–6344 CrossRef CAS.
- T. H. Peterson and B. K. Carpenter, J. Am. Chem. Soc., 1992, 114, 766–767 CrossRef CAS.
- R. Villar Lopez, O. N. Faza and C. Silva Lopez, J. Org. Chem., 2017, 82, 4758–4765 CrossRef CAS PubMed.
- The bond distances in this plot are analogous to the atom paths in Fig. 1 from I. L. Andujar-de Sanctis and D. A. Singleton, Org. Lett., 2012, 14, 5238–5241 CrossRef CAS PubMed , which shows an “Atomic Motion Reaction Coordinate” that illustrates the paths of individual atoms along a reaction coordinate. Though we are plotting bond distances rather than the motions of single atoms, since the bond distances share an atom, the relative changes in these distances show the relative differences in motion of atoms C2 and C3. In this sense, C2 and C3 are “racing atoms”.
- S. Maeda, Y. Harabuchi, Y. Ono, T. Taketsugu and K. Morokuma, Int. J. Quantum Chem., 2015, 115, 258–269 CrossRef CAS.
-
(a) B. K. Carpenter, G. S. Ezra, S. C. Farantos, Z. C. Kramer and S. Wiggins, J. Phys. Chem. B, 2018, 122, 3230–3241 CrossRef CAS PubMed;
(b) J. M. Bowman, Mol. Phys., 2014, 112, 2516–2528 CrossRef CAS;
(c) F. A. L. Mauguière, P. Collins, Z. C. Kramer, B. K. Carpenter, G. S. Ezra, S. C. Farantos and S. Wiggins, Annu. Rev. Phys. Chem., 2017, 68, 499–524 CrossRef PubMed;
(d) D. Townsend, S. A. Lahankar, S. K. Lee, S. D. Chambreau, A. G. Suits, X. Zhang, J. Rheinecker, L. B. Harding and J. M. Bowman, Science, 2004, 306, 1158–1161 CrossRef CAS PubMed.
- The transition state structures for these reactions appear to reside between the realms of pericyclic and pseudopericyclic reactions, similar to transition state structures for carbene additions to alkenes; see the ESI† for a detailed discussion of this issue.
- Z. He, H. J. Shrives, J. A. Fernandez-Salas, A. Abengozar, J. Neufeld, K. Yang, A. P. Pulis and D. J. Procter, Angew. Chem., Int. Ed., 2018, 57, 5759–5764 CrossRef CAS PubMed.
- For an analysis of a competition between formation of [1,2] and [2,3] products for a different reaction (Stevens/Sommelt–Hauser rearrangement), see: B. Biswas and D. A. Singleton, J. Am. Chem. Soc., 2015, 137, 14244–14247 CrossRef CAS PubMed ; in this report, [1,2] products were found, in trajectory calculations, to arise from fragmentation/recombination.
-
R. B. Campos and D. J. Tantillo, submitted.
-
(a) B. K. Carpenter, J. N. Harvey and D. R. Glowacki, Phys. Chem. Chem. Phys., 2015, 17, 8372–8381 RSC;
(b) Y. Nieves-Quinones and D. A. Singleton, J. Am. Chem. Soc., 2016, 138, 15167–15176 CrossRef CAS PubMed;
(c) B. K. Carpenter, J. N. Harvey and A. J. Orr-Ewing, J. Am. Chem. Soc., 2016, 138, 4695–4705 CrossRef CAS PubMed;
(d) M. N. Grayson, Z. Yang and K. N. Houk, J. Am. Chem. Soc., 2017, 139, 7717–7720 CrossRef CAS PubMed;
(e) F. Liu, Z. Yang, Y. Mei and K. N. Houk, J. Phys. Chem. B, 2016, 120, 6250–6254 CrossRef CAS PubMed;
(f) Z. Yang, C. Doubleday and K. N. Houk, J. Chem. Theory Comput., 2015, 11, 5606–5612 CrossRef CAS PubMed.
Footnote |
| † Electronic supplementary information (ESI) available. See DOI: 10.1039/c8sc02653j |
|
| This journal is © The Royal Society of Chemistry 2018 |
Click here to see how this site uses Cookies. View our privacy policy here. 
 Open Access Article
 This Open Access Article is licensed under a Creative Commons Attribution-Non Commercial 3.0 Unported Licence
 a,
Ang
Li
b and
Dean J.
Tantillo
a,
Ang
Li
b and
Dean J.
Tantillo