 Open Access Article
Creative Commons Attribution 3.0 Unported Licence
DNA-binding miniproteins based on zinc fingers. Assessment of the interaction using nanopores†
Jéssica
Rodríguez
 a,
Soraya
Learte-Aymamí
a,
Jesús
Mosquera
a,
Garbiñe
Celaya
b,
David
Rodríguez-Larrea
b,
M. Eugenio
Vázquez
a,
Soraya
Learte-Aymamí
a,
Jesús
Mosquera
a,
Garbiñe
Celaya
b,
David
Rodríguez-Larrea
b,
M. Eugenio
Vázquez
 *a and
José L.
Mascareñas
 *a
*a
aCentro Singular de Investigación en Química Biolóxica e Materiais Moleculares (CIQUS), Departamento de Química Orgánica, Universidade de Santiago de Compostela, 15782 Santiago de Compostela, Spain. E-mail: joseluis.mascarenas@usc.es
bBiofisika Institute (CSIC, UPV/EHU), Department of Biochemistry and Molecular Biology (UPV/EHU), Leioa 48940, Spain
First published on 10th April 2018
Abstract
Obtaining artificial proteins that mimic the DNA binding properties of natural transcription factors could open new ways of manipulating gene expression at will. In this context it is particularly interesting to develop simple synthetic systems. Inspired by the modularity of natural transcription factors, we have designed synthetic miniproteins that combine the zinc finger module of the transcription factor GAGA and AT-hook peptide domains. These constructs are capable of binding to composite DNA sequences of up to 14 base pairs with high affinity and good selectivity. In particular, we have synthesized three different chimeras and characterized their DNA binding properties by electrophoresis and fluorescence anisotropy. We have also used, for the first time in the study of peptide-based DNA binders, nanopore force spectroscopy to obtain further data on the DNA interaction.
Zinc fingers (ZFs), the most abundant eukaryotic transcription factors (TFs), are involved in the regulation of the expression of multiple genes.1 Cys2–His2 ZFs are composed of small peptide domains, of about 30 amino acids, which fold into simple ββα-motifs stabilized by chelation of Zn(II) ions by Cys and His residues. The DNA binding of these proteins typically requires the cooperative interaction of at least three zinc finger domains that wind around the DNA while inserting their recognition α-helices in the major groove, each of them specifically recognizing three base pairs.2,3 Cys2–His2 ZFs are a versatile platform for the engineering of genetically encoded transcriptional regulators and gene editing tools, some of which have even reached clinical trials.3
Despite the interest in these recombinant constructs, the use of only one class of DNA binding motifs limits the modes of interaction that can be achieved. Therefore, it would be of great value to generate alternative DNA binding agents that can combine different DNA interacting units.4,5 We have recently demonstrated that, while isolated peptides derived from the GAGA Cys2–His2 ZF fail to bind DNA, their covalent tethering to minor groove binders such as polypyrroles,6 bisbenzamidines7 or AT-hook peptide domains8 restores their DNA binding. Unfortunately, the synthesis of these conjugates is far from trivial, requiring the use of orthogonal protecting groups and the introduction of elaborate synthetic linkers. Moreover, their non-peptidic nature prevents the future possibility of biological engineering and genetic encoding. These limitations have raised the question of whether it would be possible to assemble analogues of this multipartite DNA binders relying exclusively on natural amino acids and peptide linkers. Herein, we report the synthesis of fully peptidic, ZF-based miniproteins that interact with the DNA with high affinity and excellent selectivity. In contrast to classical ZFs, which only establish contact with the DNA major groove, our designed constructs combine interactions in the major and the minor grooves. We also report for the first time the application of nanopore force spectroscopy to analyze the DNA interaction of this type of artificial peptide DNA binders.9
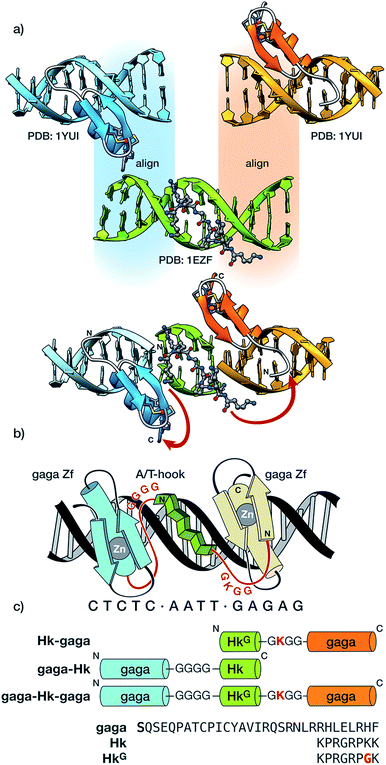
The newly designed chimeras are composed of one AT-hook sequence connected to two Cys2–His2 replicas of the DNA-binding domain of the GAGA TF (Ser28 to Phe58 in the reference pdb structure).10 Importantly, neither of the components is capable of interacting with their respective DNA sites with appreciable affinity as isolated monomers.5a,11 Taking as starting points the experimental structures of the DNA complexes of GAGA,9 and the third AT-hook of HMG-I(Y),12 we built a hypothetical model for simultaneous interaction of the AT-hook motif inserted into a central AATT minor groove site, flanked by two Cys2–His2 GAGA fragments bound to adjacent major grooves (see Fig. 1a and the ESI for details†). Inspection of this qualitative model suggested that a Gly4 linker between the C-terminal end of the Cys2–His2 GAGA fragment and the N-terminal arm of the AT-hook might span the required distance. This model also revealed a potentially damaging steric clash involving side chains in the β-hairpin of the second Cys2–His2 GAGA domain with the C-terminal Lys40 of the AT-hook, which was therefore replaced by a glycine (HkG). In order to maintain the total positive charge of the AT-hook in the final conjugate and favor electrostatic contact with the phosphate backbone, we introduced a lysine residue in the linker connecting the C-terminus of the AT-hook peptide and the N-terminal side of the GAGA fragment (Fig. 1).
We validated our approach by designing three chimeras, Hk-gaga, gaga-Hk, and gaga-Hk-gaga, which were synthesized in good yields following standard Fmoc/tBu SPPS protocols.13 Note that whereas in the first hybrid, Hk-gaga, the connection involves the N-terminus of the zinc finger and the C-terminus of the AT-hook, in gaga-Hk there is a linkage between the AT-hook N-terminal side and the zinc finger C-terminus. Importantly, synthetic procedures are straightforward and the peptides can be assembled using an automatic synthesizer in just one working day (each peptide), which is an important advantage with respect to previous approaches to conjugates containing non-peptide linkers and binders.6,7a
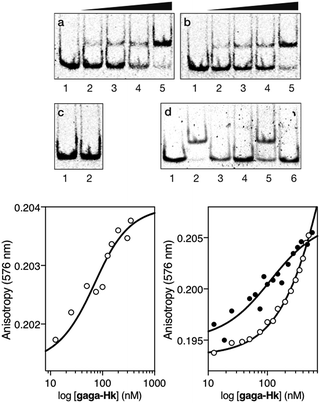
Having at hand the desired bivalent conjugates, we studied their DNA binding properties using non-denaturing electrophoresis mobility shift assays (EMSAs) in polyacrylamide gels.14 Thus, a double stranded (ds) oligonucleotide AT·GAG containing the AT-hook and GAGA binding sites in tandem was mixed with increasing concentrations of the conjugate gaga-Hk. The gel showed concentration-dependent slow-migrating bands, which are consistent with the formation of the desired gaga-Hk/AT·GAG complex (Fig. 2, panel (a)). Importantly, no new bands were observed when the conjugate gaga-Hk was incubated with a dsDNA lacking the GAGA binding site (Fig. 2, panel (c)), demonstrating that the ZF peptide must be bound to its target site for the observation of high-affinity binding. Interestingly, incubation with a control oligonucleotide lacking the A/T-rich site also led to retarded bands, albeit in this case the interaction appears to be weaker (Fig. 2, panel (b) and lanes 2 and 5 in panel (d)). As expected, in the absence of the AT-hook unit, the zinc finger module of GAGA (gaga) by itself does not give rise to slow-migrating bands, neither with AT·GAG nor with cg·GAG (Fig. 2, panel (d), lanes 3 and 6).
Fluorescence anisotropy titrations with a rhodamine (TMR)-labeled dsDNA containing the target consensus sequence (AATT-GAGAG) confirmed that gaga-Hk binds with high affinity to its target site, with an apparent KD of 58 ± 4 nM in the presence of competing calf thymus DNA (41 ± 7 nM in the absence of calf thymus, see the ESI†) at 20 °C (Fig. 2, bottom left). Importantly, fluorescence anisotropy titrations showed that in the presence of excess competing calf thymus DNA, gaga-Hk binds very weakly to the mutated dsDNA lacking the A/T-rich tract (Fig. 2, bottom right, white points) while in the absence of calf thymus the data can be fitted with a KD of 100 nM (Fig. 2, bottom right, black points). This result indicates that the retarded band observed in the EMSA with this mutated DNA (Fig. 2b) arises from relatively weak and less specific interactions in which the AT-hook peptide is most probably not inserted in the minor groove, but makes electrostatic contact with the DNA backbone.15 Taken together, these results support the formation of a cooperative, bivalent DNA binding complex at specific composite DNA sites of nine base pairs (AATT-GAGAG), in which the GAGA peptide fragment binds in the major groove of its target sequence (GAGAG) while the AT-hook peptide is inserted in the adjacent minor groove (AATT).
The inverted chimera Hk-gaga also targets the same composite DNA site. Thus, the addition of increasing amounts of Hk-gaga to the dsDNA AT·GAG under standard conditions led to a new, slow-migrating band (Fig. 3, panel (a)). This new band is consistent with the expected specific peptide–DNA complex. As previously observed for the conjugate gaga-Hk, Hk-gaga does not elicit new retarded bands when incubated with a non-target sequence lacking the GAGAG site (Fig. 3, panel (b)), and shows residual binding with a control oligonucleotide featuring the GAGAG site but lacking the A/T-rich site (Fig. 3, panel (c)). Therefore, the inverse arrangement of DNA binding moieties allowed an excellent selectivity. Using fluorescence anisotropy, we calculated an apparent KD for its target site of 92 ± 11 nM at 20 °C, in the presence of competing calf thymus DNA (44 ± 6 nM in the absence of calf thymus; Fig. 3, bottom left, and ESI†). As with gaga-Hk, in the presence of calf thymus, the interaction of Hk-gaga with the DNA featuring the A/T-hook mutated site is very weak (Fig. 3, bottom right). Taken together, these results confirm the formation of the expected bivalent complex at the specific composite DNA site of nine base pairs (complex Hk-gaga/AT·GAG).
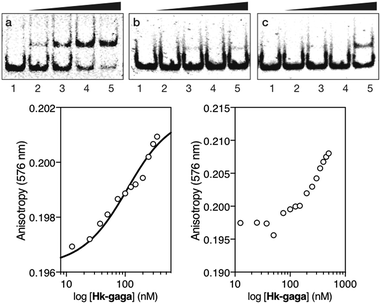 | ||
Fig. 3 Top: EMSA results for Hk-gaga. Panel (a), lanes 1–5: [Hk-gaga] = 0, 300, 500, 700, and 1000 nM with 75 nM DNA AT·GAG. Panel (b), lanes 1–5: [Hk-gaga] = 0, 300, 500, 700, and 1000 nM with 75 nM AT·cgc. Panel (c), lanes 1–5: [Hk-gaga] hr = 0, 300, 500, 700, and 1000 nM with 75 nM cg·GAG. Experimental conditions are as indicated in the caption of Fig. 2. Bottom left: fluorescence anisotropy titration of a 25 nM solution of TMR-AT·GAG in the presence of competing non-specific calf-thymus DNA (50 μM in base pairs) and with increasing concentrations of Hk-gaga. The best fit to a 1![[thin space (1/6-em)]](https://www.rsc.org/images/entities/char_2009.gif) : :![[thin space (1/6-em)]](https://www.rsc.org/images/entities/char_2009.gif) 1 binding model is also shown. Bottom right: fluorescence anisotropy titration of a 25 nM solution of TMR-cg·GAG in the presence of competing non-specific calf-thymus DNA (50 μM in base pairs) and with increasing concentrations of Hk-gaga. Experimental data correspond to the mean of three independent titrations. Note the different concentration scale that reflects the very different binding properties with the two oligos. 1 binding model is also shown. Bottom right: fluorescence anisotropy titration of a 25 nM solution of TMR-cg·GAG in the presence of competing non-specific calf-thymus DNA (50 μM in base pairs) and with increasing concentrations of Hk-gaga. Experimental data correspond to the mean of three independent titrations. Note the different concentration scale that reflects the very different binding properties with the two oligos. | ||
We then moved to the more challenging ternary “major–minor–major” groove interaction. In this case, the AT-hook plays the role of a central minor groove anchor that delivers the two GAGA DNA binding domains to the adjacent major groove sites. Gratifyingly, the addition of increasing concentrations of the ternary chimera gaga-Hk-gaga to a dsDNA containing the palindromic target composite binding site (CTC·AT·GAG) under standard conditions, produced a new, slower migrating band in the EMSA (Fig. 4, panel (a), lanes 1–6), consistent with the formation of the expected specific ternary miniprotein/DNA complex. With the mutated dsDNA cat·AT·GAG, which lacks the first GAGAG site, the gel shows a faint, slower-migrating band, that might correspond to a lower-affinity peptide/DNA complex involving a specific bivalent interaction with the target AATT-GAGAG sequence (Fig. 4, panel (b), lanes 1–2). Importantly, the synthetic miniprotein does not elicit retarded bands when incubated with a non-target sequence lacking both GAGA binding sites, cat·AT·cgc (Fig. 4, panel (c), lanes 1–5). Again, a control oligonucleotide lacking the A/T-rich site, CTC·gc·GAG, showed only residual binding (Fig. 4, panel (c), lanes 6–10). This result highlights the important role of the interaction between the AT-hook moiety of the conjugate with its target site, for obtaining high affinity complexes.
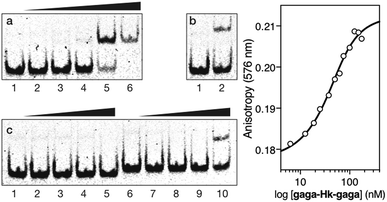 | ||
Fig. 4 Left: EMSA results for gaga-Hk-gaga. Panel (a), lanes 1–6: [gaga-Hk-gaga] = 0, 300, 500, 700, 1000, and 1500 nM with 75 nM CTC·AT·GAG. Panel (b), lanes 1–2: [gaga-Hk-gaga] = 0 and 1000 nM with 75 nM cat·AT·GAG. Panel (c), lanes 1–5: [gaga-Hk-gaga] = 0, 300, 500, 700, and 1000 nM with 75 nM cat·AT·cgc. Panel (c), lanes 6–10: [gaga-Hk-gaga] = 0, 300, 500, 700, and 1000 nM with 75 nM CTC·gc·GAG. Oligonucleotide sequences (only one strand shown): CTC·AT·GAG: 5′-GAG ![[C with combining low line]](https://www.rsc.org/images/entities/char_0043_0332.gif) ![[T with combining low line]](https://www.rsc.org/images/entities/char_0054_0332.gif) ![[C with combining low line]](https://www.rsc.org/images/entities/char_0043_0332.gif) ![[T with combining low line]](https://www.rsc.org/images/entities/char_0054_0332.gif) ![[C with combining low line]](https://www.rsc.org/images/entities/char_0043_0332.gif) AATT AATT ![[G with combining low line]](https://www.rsc.org/images/entities/char_0047_0332.gif) ![[A with combining low line]](https://www.rsc.org/images/entities/char_0041_0332.gif) ![[G with combining low line]](https://www.rsc.org/images/entities/char_0047_0332.gif) ![[A with combining low line]](https://www.rsc.org/images/entities/char_0041_0332.gif) ![[G with combining low line]](https://www.rsc.org/images/entities/char_0047_0332.gif) CGCG-3′; cat·AT·GAG: 5′-CGC CGCG-3′; cat·AT·GAG: 5′-CGC ![[G with combining low line]](https://www.rsc.org/images/entities/char_0047_0332.gif) ![[T with combining low line]](https://www.rsc.org/images/entities/char_0054_0332.gif) ![[C with combining low line]](https://www.rsc.org/images/entities/char_0043_0332.gif) ![[A with combining low line]](https://www.rsc.org/images/entities/char_0041_0332.gif) ![[T with combining low line]](https://www.rsc.org/images/entities/char_0054_0332.gif) AATT AATT ![[G with combining low line]](https://www.rsc.org/images/entities/char_0047_0332.gif) ![[A with combining low line]](https://www.rsc.org/images/entities/char_0041_0332.gif) ![[G with combining low line]](https://www.rsc.org/images/entities/char_0047_0332.gif) ![[A with combining low line]](https://www.rsc.org/images/entities/char_0041_0332.gif) ![[G with combining low line]](https://www.rsc.org/images/entities/char_0047_0332.gif) CGC-3′; cat·AT·cgc: 5′-CGC CGC-3′; cat·AT·cgc: 5′-CGC ![[G with combining low line]](https://www.rsc.org/images/entities/char_0047_0332.gif) ![[T with combining low line]](https://www.rsc.org/images/entities/char_0054_0332.gif) ![[C with combining low line]](https://www.rsc.org/images/entities/char_0043_0332.gif) ![[A with combining low line]](https://www.rsc.org/images/entities/char_0041_0332.gif) ![[T with combining low line]](https://www.rsc.org/images/entities/char_0054_0332.gif) AATT AATT ![[C with combining low line]](https://www.rsc.org/images/entities/char_0043_0332.gif) ![[G with combining low line]](https://www.rsc.org/images/entities/char_0047_0332.gif) ![[C with combining low line]](https://www.rsc.org/images/entities/char_0043_0332.gif) ![[G with combining low line]](https://www.rsc.org/images/entities/char_0047_0332.gif) ![[A with combining low line]](https://www.rsc.org/images/entities/char_0041_0332.gif) CGC-3′; CTC·gc·GAG: 5′-GGTT CGC-3′; CTC·gc·GAG: 5′-GGTT ![[C with combining low line]](https://www.rsc.org/images/entities/char_0043_0332.gif) ![[T with combining low line]](https://www.rsc.org/images/entities/char_0054_0332.gif) ![[C with combining low line]](https://www.rsc.org/images/entities/char_0043_0332.gif) ![[T with combining low line]](https://www.rsc.org/images/entities/char_0054_0332.gif) ![[C with combining low line]](https://www.rsc.org/images/entities/char_0043_0332.gif) GACC GACC ![[G with combining low line]](https://www.rsc.org/images/entities/char_0047_0332.gif) ![[A with combining low line]](https://www.rsc.org/images/entities/char_0041_0332.gif) ![[G with combining low line]](https://www.rsc.org/images/entities/char_0047_0332.gif) ![[A with combining low line]](https://www.rsc.org/images/entities/char_0041_0332.gif) ![[G with combining low line]](https://www.rsc.org/images/entities/char_0047_0332.gif) TTGG-3′. Experimental conditions are as indicated in the caption of Fig. 2. Right: Fluorescence anisotropy titration of a 25 nM solution of TMR-CTC·AT·GAG with increasing concentrations of gaga-Hk-gaga and best fit to a 1 TTGG-3′. Experimental conditions are as indicated in the caption of Fig. 2. Right: Fluorescence anisotropy titration of a 25 nM solution of TMR-CTC·AT·GAG with increasing concentrations of gaga-Hk-gaga and best fit to a 1![[thin space (1/6-em)]](https://www.rsc.org/images/entities/char_2009.gif) : :![[thin space (1/6-em)]](https://www.rsc.org/images/entities/char_2009.gif) 1 binding model. Data are the mean of three titrations. 1 binding model. Data are the mean of three titrations. | ||
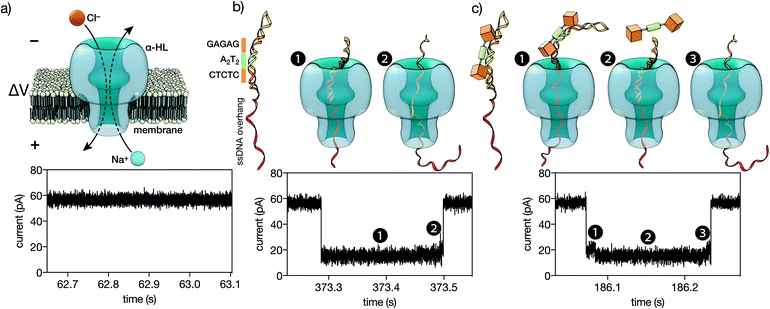 | ||
| Fig. 5 (a) A single α-HL pore inserted in a lipid membrane allows the flow of ions in response to an applied voltage. The ionic current of the open pore is shown below. (b) A double stranded DNA containing the target CTCTC-A2T2-GAGAG binding site inserted in a hairpin followed by a ssDNA overhang (see the ESI† for the full sequence). This DNA is driven to the pore by the electric field. The threading, unzipping and translocation of the DNA causes the characteristic signal shown below. (c) When the trivalent peptide is bound to the DNA there is an additional step with the DNA–protein complex on top of the pore, which causes a new high-conductance level (c1). Once the protein is detached, the reaction proceeds as with free DNA (c2-3). Below is the ionic current signal when a protein–DNA complex is analyzed. | ||
Fluorescence anisotropy titrations using a TMR-labeled dsDNA (TMR-CTC·AT·GAG) confirmed the high affinity binding of the trivalent peptide chimera with the DNA (apparent KD = 35 ± 4 nM at 20 °C, Fig. 4, right). We could not calculate a reliable KD in the presence of excess calf-thymus DNA because of the formation of aggregates. Anyhow, these results support the formation of a trivalent DNA complex at the specific composite consensus DNA site of 14 base pairs. The lack of large enhancement in the binding affinity of the ternary chimera (gaga-Hk-gaga) versus the bivalent systems (Hk-gaga and gaga-HK) is likely due to the use of a suboptimal linker that does not allow full energetic advantage of the simultaneous interaction of the three binding modules to be taken.
We next analyzed the interaction of the trivalent chimera with DNA using nanopores.16 This single molecule method has shown utility for the determination of thermodynamic and kinetic parameters in the formation of protein–DNA complexes,17 and to our knowledge, up to now it had not been used to characterize the DNA recognition of synthetic peptide binders.9c Briefly, it works by stochastically examining DNA states in the presence of a given amount of the peptide binder, as described in Fig. 5. Typically, by analyzing up to a hundred DNA molecules, the fraction of complexes can be determined (Fig. 6, left), and the KD deduced (Fig. 6, right). When analyzing the interaction of the trivalent chimera with its target ternary binding site  we calculated a KD of 120 ± 10 nM. This result is in reasonable agreement with the KD obtained by fluorescence anisotropy, considering the differences in the assay conditions and in the characteristics of each technique. As expected, mutation of the first GAGAG site (GTCAT-A2T2-GAGAG) or of the second GAGAG site (CTCTC-A2T2-CTGGG) led to weaker affinities (KD of 193 ± 66 nM and 269 ± 39 nM, respectively), in agreement with the trend in binding affinity observed in the EMSA experiments. Interestingly, the nanopore technique allows the time required for a protein to detach from its DNA complex to be measured (dwell time in level 1 in Fig. 4c). This information is related to the kinetics in the presence of an applied force.9c,17 In order to compare the data obtained on the three different DNAs we fitted each dwell time distribution to a single exponential distribution (ESI Fig. S6†). The values obtained from the fit should be taken cautiously because between 10 and 20% of the molecules did not fit the single exponential distribution. Overall, we observed that higher voltages induced faster dissociation, likely because of the increased force applied to detach the protein under those conditions (Fig. S7†). The effect of the applied force was larger when the protein was bound to the DNA with the consensus tripartite site (CTCTC-A2T2-GAGAG). Within the voltage range studied (from +90 to +120 mV), the slower dissociation was also observed for this DNA (apparent koff,110 mV = 90[100 − 79] s−1; in brackets the 95% confidence interval, CI; n = 284; Fig. S6†). For the DNAs with one mutated site the dissociation was faster (for DNA with GTCAT-A2T2-GAGAG, apparent koff,110 mV = 165[197 − 132] s−1 ([95% CI], n = 100) and for that with CTCTC-A2T2-CTGGG, apparent koff,110 mV = 253[298 − 208] s−1 ([95% CI], n = 121)).
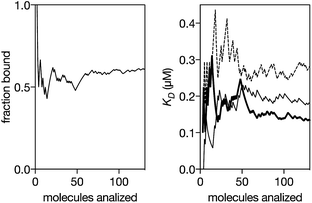 | ||
| Fig. 6 Left: Representative experiment where DNA molecules are stochastically analyzed by the pore. The fraction of peptide–DNA complexes in a mixture of 0.29 μM peptide and 0.13 μM DNA is calculated counting the number of molecules that produced the signal shown in Fig. 5c divided by the total number of molecules that were analyzed (Fig. 5b and c). Using a reversible one-to-one binding model, KD = [free DNA] × [free protein]/[complex], with [DNA] = total concentration of DNA, [Prot] = total concentration of protein and fb = fraction of DNA molecules observed in the bound state, we estimated an apparent KD = [DNA] × (1 − fb) × ([Prot]–[DNA] × fb)/([DNA] × fb) (black thick line in the right panel). Right: Representative experiments for the KD estimation for a DNA with the target ternary binding site (thick line, 0.29 μM peptide and 0.13 μM DNA), for a DNA with the 1st GAGAG site mutated (thin line, 0.52 μM peptide and 0.13 μM DNA) and for a DNA with the second GAGAG site mutated (dashed line, 0.19 μM peptide and 0.13 μM DNA). The experiments were carried out in 100 mM NaCl, 0.02 mM ZnCl2, 20 mM Tris–HCl pH 7.5, at 22 °C. | ||
Conclusions
In summary, we have devised a new type of fully-peptidic DNA binder with a new artificial DNA binding motif. Bivalent and trivalent constructs can be prepared in a straightforward manner owing to their peptidic constitution, and display excellent DNA recognition properties in terms of affinity and selectivity. In addition, we have shown that nanopore technologies allow biophysical information to be obtained, in particular kinetic information that complements that obtained using more standard ensemble techniques. We predict that the proteinogen nature of these artificial DNA binders might allow further designs, and provide for the development of genetic tools other than those based on polydactyl zinc fingers.Conflicts of interest
There are no conflicts to declare.Acknowledgements
This work received support from the MINECO (SAF2013-41943-R, BFU2016-81754-ERC, CTQ2015-70698-R, SAF2014-58398-R, and SAF2016-76689-R), the Xunta de Galicia (2015-CP082, ED431C 2017/19 and Centro singular de investigación de Galicia accreditation 2016–2019, ED431G/09), the Fundación AECC (IDEAS197VAZQ), the European Union (European Regional Development Fund – ERDF), and the European Research Council (Advanced Grant No. 340055). Support of the orfeo-cinqa network is also acknowledged. J. R. thanks the Xunta de Galicia for a PhD fellowship; D. R.-L. is a recipient of a Ramón y Cajal Fellowship (RYC-2013-12799).Notes and references
- C. O. Pabo, E. Peisach and R. A. Grant, Annu. Rev. Biochem., 2001, 70, 313 CrossRef CAS PubMed.
- M. Suzuki, S. E. Brenner, M. Gerstein and N. Yagi, Protein Eng., 1995, 8, 319 CrossRef CAS PubMed.
- (a) A. Klug, Annu. Rev. Biochem., 2010, 79, 213 CrossRef CAS PubMed; (b) F. D. Urnov, E. J. Rebar, M. C. Holmes, H. S. Zhang and P. D. Gregory, Nat. Rev. Genet., 2010, 11, 636 CrossRef CAS PubMed; (c) S. A. Wolfe, L. Nekludova and C. O. Pabo, Annu. Rev. Biophys. Biomol. Struct., 2000, 29, 183 CrossRef CAS PubMed; (d) G. A. Gersbach, T. Gaj and C. F. Barbas, Acc. Chem. Res., 2014, 47, 2309 CrossRef PubMed.
- (a) P. B. Dervan, Bioorg. Med. Chem., 2001, 9, 2215–2235 CrossRef CAS PubMed; (b) A. Paul, A. Kumar, R. Nanjunda, A. A. Farahat, D. W. Boykin and W. D. Wilson, Org. Biomol. Chem., 2017, 15, 827–835 RSC; (c) P. Guo, A. Paul, A. Kumar, N. K. Harika, S. Wang, A. A. Farahat, D. W. Boykin and W. D. Wilson, Chem. Commun., 2017, 53, 10406–10409 RSC; (d) S. Boga, D. Bouzada, D. García Peña, M. Vázquez López and M. E. Vázquez, Eur. J. Org. Chem., 2018, 2018, 249–261 CrossRef CAS.
- (a) M. E. Vázquez, A. M. Caamaño and J. L. Mascareñas, Chem. Soc. Rev., 2003, 32, 338 RSC; (b) E. Pazos, J. Mosquera, M. E. Vázquez and J. L. Mascareñas, ChemBioChem, 2011, 12, 1958 CrossRef CAS PubMed.
- (a) O. Vázquez, M. E. Vázquez, J. B. Blanco, L. Castedo and J. L. Mascareñas, Angew. Chem., Int. Ed., 2007, 46, 6886 CrossRef PubMed; (b) J. B. Blanco, V. I. Dodero, M. E. Vázquez, M. Mosquera, L. Castedo and J. L. Mascareñas, Angew. Chem., Int. Ed., 2006, 45, 8210 CrossRef CAS PubMed; (c) J. B. Blanco, M. E. Vázquez, L. Castedo and J. L. Mascareñas, ChemBioChem, 2005, 6, 2173 CrossRef CAS PubMed; (d) M. E. Vázquez, A. M. Caamaño, J. Martínez-Costas, L. Castedo and J. L. Mascareñas, Angew. Chem., Int. Ed., 2001, 40, 4723 CrossRef. For other DNA-binding peptides, see: (e) Y. Ruiz García, Y. V. Pabon-Martinez, C. I. E. Smith and A. Madder, Chem. Commun., 2017, 53, 6653 RSC; (f) G. A. Woolley, A. S. I. Jaikaran, M. Berezovski, J. P. Calarco, S. N. Krylov, O. S. Smart and J. R. Kumita, Biochemistry, 2006, 45, 6075 CrossRef CAS PubMed; (g) J. B. Blanco, M. E. Vázquez, J. Martínez-Costas, L. Castedo and J. L. Mascareñas, Chem. Biol., 2003, 10, 713 CrossRef CAS PubMed.
- (a) M. I. Sánchez, O. Vázquez, M. E. Vázquez and J. L. Mascareñas, Chem.–Eur. J., 2013, 19, 9923 CrossRef PubMed; (b) J. Rodríguez, J. Mosquera, O. Vázquez, M. E. Vázquez and J. L. Mascareñas, Chem. Commun., 2014, 50, 2258 RSC; (c) O. Vázquez, M. I. Sánchez, J. Martínez-Costas, M. E. Vázquez and J. L. Mascareñas, Org. Lett., 2010, 12, 216 CrossRef PubMed; (d) M. I. Sánchez, O. Vázquez, J. Martínez-Costas, M. E. Vázquez and J. L. Mascareñas, Chem. Sci., 2012, 3, 2383 RSC.
- (a) J. Rodríguez, J. Mosquera, J. R. Couceiro, M. E. Vázquez and J. L. Mascareñas, Chem. Sci., 2015, 6, 4767 RSC; (b) J. Rodríguez, J. Mosquera, R. García-Fandiño, M. E. Vázquez and J. L. Mascareñas, Chem. Sci., 2016, 7, 3298 RSC.
- (a) M. M. Marshall, J. Ruzicka, O. K. Zahid, V. C. Henrich, E. W. Taylor and A. R. Hall, Langmuir, 2015, 31, 4582 CrossRef CAS PubMed; (b) A. Squires, E. Atas and A. Meller, Sci. Rep., 2015, 5, 11643 CrossRef CAS PubMed; (c) G. Celaya, J. Perales-Calvo, A. Muga, F. Moro and D. Rodriguez-Larrea, ACS Nano, 2017, 11, 5815–5825 CrossRef CAS PubMed.
- J. G. Omichinski, P. V. Pedone, G. Felsenfeld, A. M. Gronenborn and G. M. Clore, Nat. Struct. Biol., 1997, 4, 122 CrossRef CAS PubMed.
- Importantly, this 31-residue GAGA fragment, lacking the accessory basic regions that stabilize its complex with the DNA, does not show any significant DNA affinity. See ref. 6 and P. V. Pedone, R. Ghirlando, G. M. Clore, A. M. Gronenborn, G. Felsenfeld and J. G. Omichinski, Proc. Natl. Acad. Sci. U. S. A., 1996, 93, 282 CrossRef.
- J. R. Huth, C. A. Bewley, M. S. Nissen, J. N. Evans, R. Reeves, A. M. Gronenborn and G. M. Clore, Nat. Struct. Biol., 1997, 4, 657 CrossRef CAS PubMed.
- I. Coin, M. Beyermann and M. Bienert, Nat. Protoc., 2007, 2, 3247–3256 CrossRef CAS PubMed.
- (a) L. M. Hellman and M. G. Fried, Nat. Protoc., 2007, 2, 1849 CrossRef CAS PubMed; (b) D. Lane, P. Prentki and M. Chandler, Microbiol. Rev., 1992, 56, 509 CAS; (c) J. B. Blanco, M. E. Vázquez, J. Martinez-Costas, L. Castedo and J. L. Mascareñas, Chem. Biol., 2003, 10, 713 CrossRef CAS PubMed.
- It must be noted that purely electrostatic and disordered complexes can also display high affinity: A. Borgia, M. B. Borgia, K. Bugge, V. M. Kissling, P. O. Heidarsson, C. B. Fernandes, A. Sottini, A. Soranno, K. J. Buholzer, D. Nettels, B. B. Kragelund, R. B. Best and B. Schuler, Nature, 2018, 555, 61–66 CrossRef CAS PubMed.
- G. Maglia, A. J. Heron, D. Stoddart, D. Japrung and H. Bayley, Methods Enzymol., 2010, 475, 591–623 CAS.
- B. Hornblower, A. Coombs, R. D. Whitaker, A. Kolomeisky, S. J. Picone, A. Meller and M. Akeson, Nat. Methods, 2007, 4, 315–317 CrossRef CAS PubMed.
Footnote |
| † Electronic supplementary information (ESI) available. See DOI: 10.1039/c7sc05441f |
| This journal is © The Royal Society of Chemistry 2018 |

