Overcoming catalyst deactivation during the continuous conversion of sugars to chemicals: maximising the performance of Sn-Beta with a little drop of water†
Daniele
Padovan‡
a,
Søren
Tolborg‡
 b,
Luca
Botti
a,
Esben
Taarning
b,
Irantzu
Sádaba
*b and
Ceri
Hammond
b,
Luca
Botti
a,
Esben
Taarning
b,
Irantzu
Sádaba
*b and
Ceri
Hammond
 *a
*a
aCardiff Catalysis Institute, Cardiff University, Park Place, Cardiff, CF10 3AT, UK. E-mail: hammondc4@cardiff.ac.uk
bHaldor Topsøe A/S, New Business R&D, Haldor Topsøes Allé 1, 2800-Kgs. Lyngby, Denmark. E-mail: irsz@topsoe.com
First published on 28th November 2017
Abstract
Producing chemicals from renewable resources represents one of the key challenges in chemical science. Whilst catalytic methods for converting renewables to chemicals offer several advantages over biological approaches, the solid catalysts developed to date are typically plagued by rapid rates of deactivation, prohibiting their greater exploitation. Here, we demonstrate, for the first time, that a Sn-containing zeolite, Sn-Beta, is capable of continuously converting saccharide solutions to value added chemicals with high levels of activity, selectivity and stability. For both the isomerisation of glucose to fructose, and the conversion of fructose to alkyl lactates, we observe that the addition of up to 10% of water to the methanol/sugar reaction feed increases reactivity by a factor of 2.5, and catalyst stability by one order of magnitude. Continuous operation for up to 1366 h (57 days) is demonstrated, with only limited loss of activity being observed over this period of time. Post-reaction characterisation indicates that the addition of water influences several elements of the catalytic system, which cooperatively result in improved performance.
Introduction
Fossil resources are the feedstock for over 90% of all organic chemicals on an industrial scale. Given the finite nature of these resources, developing more sustainable routes to platform and commodity chemicals is an essential task. In this regard, the conversion of renewable sugar streams into valuable chemicals is one of the major targets.1–5 Catalytic methodologies exhibit several advantages versus fermentative transformations with respect to overall productivity of the system. They are also, in general, more robust and benefit from economy of scale. However, sufficient stability of solid catalysts in the polar solvents required for sugar conversion, such as water and methanol, has yet to be achieved, prohibiting greater exploitation of such technologies.6–8The isomerisation of glucose to fructose (GI),9–13 and the production of alkyl lactates from saccharides through retro-aldol chemistry14,15 are two examples of renewable chemical processes whereby catalytic methods offer several potential advantages over fermentative methods (Scheme 1). GI is a key step for the production of high fructose corn syrup (HFCS, 8 Mt a−1), and for the transformation of hexoses to renewable furanic platform molecules (Scheme 1).16,17 Additionally, methyl lactate (ML) is a very attractive bio-monomer for the production of renewable plastics, and other co-products formed during ML production, such as methyl vinyl glycolate (MVG), also have potential for application in the bio-polymers industry.18,19 Each of these processes are best catalysed by a Sn-modified Beta zeolite (Sn-Beta),20 widely accepted to be the state of the art heterogeneous catalyst for sustainable chemical processing, and are typically performed in polar solvents such as methanol or water.
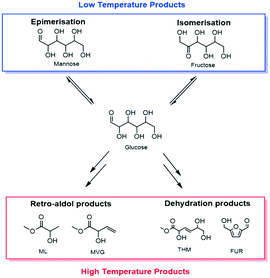 | ||
| Scheme 1 General scheme demonstrating the products that can be obtained by the catalytic conversion of sugars with Sn-Beta at both low (<140 °C) and high (>140 °C) temperature. | ||
Whilst the solid zeolite catalyst offers an improved operational window (reactant purity, pH and higher reaction temperature), decreased operational cost and, potentially, increased robustness and longevity relative to the state of the art biological systems, its industrial potential, along with its true advantage over biological methods of conversion, is dependent upon the ability of the system to operate continuously over a sufficient period of time. However, despite the interest in Sn-Beta catalysis and the critical importance of achieving sufficient levels of catalyst stability, few studies focused upon its continuous performance have been reported. As such, study and optimisation of the stability of the catalyst under continuous conditions is paramount.
The precise reaction conditions employed during continuous operation, particularly the choice of solvent and temperature, can dramatically impact the mechanism, rate and extent of catalyst deactivation.8,21 Indeed, some of us recently demonstrated that Sn-Beta was a more stable catalyst for GI when reactions were performed in methanol and not water.22 However, unacceptable rates of deactivation were still observed in methanol, with 50% loss of activity observed over 54 h on stream. Consequently, acceptable levels of stability have still not yet been achieved. Given the importance of achieving deactivation-free performance during the conversion of sugars to chemicals, the major target of this study is to optimise the productivity and stability of Sn-Beta for continuous GI and ML production.
Results and discussion
Catalytic systems under study
Amongst the many reported uses of Sn-Beta, two primary applications can be highlighted in the case of sugar conversion: the isomerisation of glucose to fructose (GI) and the production of methyl lactate (ML) (Scheme 1). The first reaction can be carried out in water or methanol, typically at temperatures between 90–110 °C. ML production, on the other hand, proceeds much more effectively in alcoholic media and requires higher temperatures (>140 °C).14,23 Since temperature can strongly influence the stability of a heterogeneous catalyst, this study focuses on both catalytic systems so as to probe the stability of Sn-Beta over a wide range of conditions and processes.Stability in low temperature reactions: glucose isomerisation (GI)
As described above, GI is an important process for the production of bulk chemicals (Scheme 1). Previous studies reveal Sn-Beta to be an exceptionally active and selective catalyst for this reaction in water or methanol solvent.10,22,24Given that the choice of reaction media can dramatically influence catalyst stability, the impact of the solvent with respect to catalyst stability was evaluated by performing the isomerisation reaction in various solvents under otherwise similar conditions (1 wt% glucose, 110 °C, Fig. 1). For these preliminary studies, the contact time (eqn (1)) was adjusted so that all reactions were performed at similar levels of substrate conversion (eqn (2)), to ensure catalyst stability was probed at a similar stage of the reaction coordinate.21 The initial level of conversion in each case was approximately 40%, below the equilibrium level, allowing the rate of deactivation to be accurately assessed.21 To better evaluate catalyst stability at slightly different levels of conversion, stability is evaluated as relative performance (eqn (3)) against time on stream. The precise conditions are summarised in ESI† Table S1.
 | (1) |
 | (2) |
 | (3) |
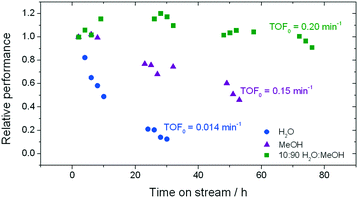 | ||
| Fig. 1 Influence of the solvent on the stability of Sn-Beta for low temperature glucose–fructose isomerisation. The initial level of conversion in all cases was between 33–40%. Precise reaction conditions are described in ESI† Table S1. | ||
In good agreement with our previous studies, extensive deactivation of Sn-Beta is observed when GI is performed in an aqueous medium, with 90% loss of activity observed within 30 h on stream (Fig. 1). In addition, deactivation in this case is permanent, with thermal treatment of the catalyst not resulting in recovered activity (ESI† Fig. S1). Whilst deactivation in methanol is less severe and is not permanent (ESI† Fig. S1), it is still prevalent with approximately 50% loss of activity observed over 50 h on stream.
In contrast, a dramatic improvement in stability is observed when a mixture of water and methanol is employed as the solvent (Fig. 1). Indeed, the addition of just 10% of water (w/w) to methanol (henceforth denoted 10![[thin space (1/6-em)]](https://www.rsc.org/images/entities/char_2009.gif) :
:![[thin space (1/6-em)]](https://www.rsc.org/images/entities/char_2009.gif) 90 H2O
90 H2O![[thin space (1/6-em)]](https://www.rsc.org/images/entities/char_2009.gif) :
:![[thin space (1/6-em)]](https://www.rsc.org/images/entities/char_2009.gif) MeOH) results in dramatic improvements in catalyst stability, with less than 10% deactivation being observed even after 80 h on stream. Secondary analysis of the time on stream data (ESI† Fig. S2) reveals that the rate of deactivation (kd)25 experienced by Sn-Beta decreases by an order of magnitude as the solvent is changed from pure methanol to 10
MeOH) results in dramatic improvements in catalyst stability, with less than 10% deactivation being observed even after 80 h on stream. Secondary analysis of the time on stream data (ESI† Fig. S2) reveals that the rate of deactivation (kd)25 experienced by Sn-Beta decreases by an order of magnitude as the solvent is changed from pure methanol to 10![[thin space (1/6-em)]](https://www.rsc.org/images/entities/char_2009.gif) :
:![[thin space (1/6-em)]](https://www.rsc.org/images/entities/char_2009.gif) 90 H2O
90 H2O![[thin space (1/6-em)]](https://www.rsc.org/images/entities/char_2009.gif) :
:![[thin space (1/6-em)]](https://www.rsc.org/images/entities/char_2009.gif) MeOH (0.02 X% h−1 to 0.002 X% h−1), despite water itself being a very unfavourable solvent (0.07 X% h−1). A variety of other compositions, ranging from 0% water to 100% water (Fig. 2), demonstrate that there is a clear optimal window for high levels of stability to be obtained, with the lowest kd values being observed between 1% and 10% water.
MeOH (0.02 X% h−1 to 0.002 X% h−1), despite water itself being a very unfavourable solvent (0.07 X% h−1). A variety of other compositions, ranging from 0% water to 100% water (Fig. 2), demonstrate that there is a clear optimal window for high levels of stability to be obtained, with the lowest kd values being observed between 1% and 10% water.
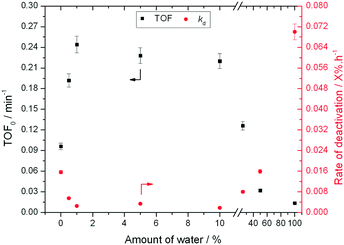 | ||
| Fig. 2 Influence of solvent composition in terms of activity (TOF0) and rate of deactivation (kd) during low temperature glucose–fructose isomerisation. Reaction conditions described in ESI† Table S1. | ||
The addition of water also improves intrinsic reactivity. To ensure that the stability studies were performed at a similar stage of the reaction coordinate (Fig. 1), the contact time, and hence the number of substrate turnovers (eqn (4)), had to be adjusted; consequently, despite exhibiting similar levels of absolute substrate conversion, the initial turnover frequency (TOF0, eqn (5)) is higher when the reaction is performed in 10![[thin space (1/6-em)]](https://www.rsc.org/images/entities/char_2009.gif) :
:![[thin space (1/6-em)]](https://www.rsc.org/images/entities/char_2009.gif) 90 H2O
90 H2O![[thin space (1/6-em)]](https://www.rsc.org/images/entities/char_2009.gif) :
:![[thin space (1/6-em)]](https://www.rsc.org/images/entities/char_2009.gif) MeOH (0.20 min−1) than when it is performed in H2O (0.014 min−1) or MeOH (0.15 min−1) alone.
MeOH (0.20 min−1) than when it is performed in H2O (0.014 min−1) or MeOH (0.15 min−1) alone.
 | (4) |
| TOF0 = moles(converted) moles(Sn)−1 min−1 | (5) |
To better understand the impact of water on the intrinsic reactivity of Sn-Beta i.e. TOF0, a series of experiments were repeated, this time under identical reaction conditions and contact times. As can be seen (Fig. 2), as the fraction of water is increased from 0% to 1%, TOF0 more than doubles from 0.1 min−1 in pure methanol to 0.25 min−1 in 1![[thin space (1/6-em)]](https://www.rsc.org/images/entities/char_2009.gif) :
:![[thin space (1/6-em)]](https://www.rsc.org/images/entities/char_2009.gif) 99 H2O
99 H2O![[thin space (1/6-em)]](https://www.rsc.org/images/entities/char_2009.gif) :
:![[thin space (1/6-em)]](https://www.rsc.org/images/entities/char_2009.gif) MeOH. Whilst activity is maintained at this high level up to at least 10
MeOH. Whilst activity is maintained at this high level up to at least 10![[thin space (1/6-em)]](https://www.rsc.org/images/entities/char_2009.gif) :
:![[thin space (1/6-em)]](https://www.rsc.org/images/entities/char_2009.gif) 90 H2O
90 H2O![[thin space (1/6-em)]](https://www.rsc.org/images/entities/char_2009.gif) :
:![[thin space (1/6-em)]](https://www.rsc.org/images/entities/char_2009.gif) MeOH, further increasing the water fraction beyond 10% results in decreasing values of TOF0, with poorest levels of performance being obtained in H2O only.
MeOH, further increasing the water fraction beyond 10% results in decreasing values of TOF0, with poorest levels of performance being obtained in H2O only.
In addition to improved activity and stability, optimisation of the water content of the solvent also improves the fructose selectivity of the system (eqn (6)). Comparison of the fructose selectivity of each reaction as a function of glucose conversion reveals that selectivity is improved by approximately 50% at all overlapping levels of conversion (Fig. 3), when up to 10% (w/w) of water is added to methanol.
 | (6) |
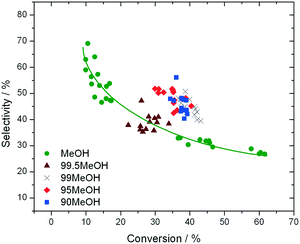 | ||
| Fig. 3 Influence of reaction solvent in terms of fructose selectivity, plotted as a function of glucose conversion. Reaction conditions are fully described in ESI† Table S1. | ||
Clearly, the addition of up to 10% water to methanol results not only in improved levels of catalyst stability (kd), but also improved rates of reaction (TOF0) and increased levels of fructose selectivity. To evaluate the combined impact of these improvements in terms of overall macroscopic performance i.e. space-time-yield (eqn (7)), further optimisation of the GI system was performed in a 10![[thin space (1/6-em)]](https://www.rsc.org/images/entities/char_2009.gif) :
:![[thin space (1/6-em)]](https://www.rsc.org/images/entities/char_2009.gif) 90 mixture of H2O
90 mixture of H2O![[thin space (1/6-em)]](https://www.rsc.org/images/entities/char_2009.gif) :
:![[thin space (1/6-em)]](https://www.rsc.org/images/entities/char_2009.gif) MeOH. As can be seen (Table 1), significant improvements in performance could be achieved by increasing temperature and feed concentration, with space-time-yields over 150-times greater than previously observed in the literature being obtained at 130 °C and 4 wt% glucose (Table 1, entry 6). Although the productivity enhancement results in a slight decrease in relative lifetime, fructose selectivity at each level of conversion is maintained (ESI† Fig. S3), and the decrease in lifetime is far smaller than the increase in productivity.
MeOH. As can be seen (Table 1), significant improvements in performance could be achieved by increasing temperature and feed concentration, with space-time-yields over 150-times greater than previously observed in the literature being obtained at 130 °C and 4 wt% glucose (Table 1, entry 6). Although the productivity enhancement results in a slight decrease in relative lifetime, fructose selectivity at each level of conversion is maintained (ESI† Fig. S3), and the decrease in lifetime is far smaller than the increase in productivity.
| Space-time-yield = kg(converted) kg(cat)−1 cm(reactor)−3 h−1 | (7) |
| Entry | Reactor | Conditions | Space-time-yielda | Relative lifetimeb |
|---|---|---|---|---|
| a Space-time-yield calculated according to eqn (7). b Relative lifetime calculated as (rate of deactivation of entry/rate of deactivation of entry 2)−1. | ||||
| 1 | Batch | H2O, 110 °C, 10 wt% | 1.2 | — |
| 2 | Flow | H2O, 110 °C, 1 wt% | 2.7 | 1 |
| 3 | Flow | MeOH, 110 °C, 1 wt% | 12.0 | 4.5 |
| 4 | Flow | 10![[thin space (1/6-em)]](https://www.rsc.org/images/entities/char_2009.gif) : :![[thin space (1/6-em)]](https://www.rsc.org/images/entities/char_2009.gif) 90 H2O 90 H2O![[thin space (1/6-em)]](https://www.rsc.org/images/entities/char_2009.gif) : :![[thin space (1/6-em)]](https://www.rsc.org/images/entities/char_2009.gif) MeOH, 110 °C, 1 wt% MeOH, 110 °C, 1 wt% |
15.9 | 41 |
| 5 | Flow | 10![[thin space (1/6-em)]](https://www.rsc.org/images/entities/char_2009.gif) : :![[thin space (1/6-em)]](https://www.rsc.org/images/entities/char_2009.gif) 90 H2O 90 H2O![[thin space (1/6-em)]](https://www.rsc.org/images/entities/char_2009.gif) : :![[thin space (1/6-em)]](https://www.rsc.org/images/entities/char_2009.gif) MeOH, 110 °C, 4 wt% MeOH, 110 °C, 4 wt% |
20.4 | 38 |
| 6 | Flow | 10![[thin space (1/6-em)]](https://www.rsc.org/images/entities/char_2009.gif) : :![[thin space (1/6-em)]](https://www.rsc.org/images/entities/char_2009.gif) 90 H2O 90 H2O![[thin space (1/6-em)]](https://www.rsc.org/images/entities/char_2009.gif) : :![[thin space (1/6-em)]](https://www.rsc.org/images/entities/char_2009.gif) MeOH, 130 °C, 4 wt% MeOH, 130 °C, 4 wt% |
186.4 | 14 |
Stability in high temperature reactions: methyl lactate (ML) production
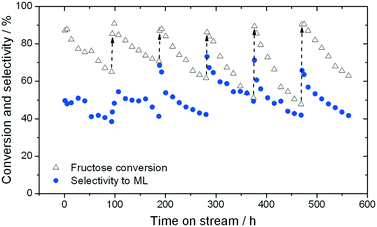
When sugar conversion in methanol is carried out at high temperatures (>140 °C), more reactions than isomerisation are observed. Previous studies have covered these reactions in detail using Sn-Beta as catalyst at temperatures above 140 °C.14,23,26 The types of products formed under reaction conditions can be grouped in three main categories: i) methyl glycosides (MG) formed by acetalisation of the sugars with methanol; ii) retro-aldol products formed by fragmentation and consecutive conversion of the C6 sugars into C2 to C4 products including ML and methyl vinyl glycolate (MVG); and iii) dehydration products maintaining a C6 backbone, including THM, and furanics (Scheme 1). It has been shown that in the presence of optimum amounts of alkali salts, retro-aldol products are favoured, resulting in ML and MVG as main products in high yields.15 To simplify the analysis in this study, all MG products are considered as unconverted sugars, and performance is evaluated in terms of fructose conversion and ML selectivity.A solution of fructose in methanol was used as feed for the high temperature reaction (160 °C), due to its higher solubility in methanol at room temperature compared to sucrose and glucose. Alkali (K2CO3) was also added to the feed at a level of 2.5 mg L−1 (36 μM), to increase the selectivity towards ML.15 In good agreement to the GI system, a gradual decrease in the conversion of fructose during continuous operation was observed, with conversion decreasing from 87% to 65% after the first 94 h on stream (Fig. 4). Deactivation in this case is non-permanent, since full activity of the material could be restored by thermal treatment of the catalyst after 90 h on stream. This ex situ treatment was performed by removing the catalyst from the reactor and heating it in air at 550 °C for 6 h.
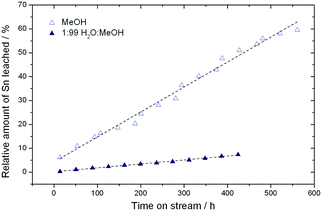
Although full activity can be restored by regeneration, it is clear that the rate of deactivation increases in each successive cycle, leading to a lower final conversion at the end of each cycle. For example, the final conversion after the fourth and fifth cycles is below 50%, compared to 65% conversion after the cycle with fresh catalyst. This indicates that a short term deactivation process, likely the deposition of carbonaceous species, co-exists with an irreversible long term deactivation process. By analysing the effluent at various periods by ICP-MS, the amount of Sn leached into the reaction medium could be estimated. It was concluded that almost 60% of the Sn present in the catalyst (initial loading 1.57 wt%) was lost after the 6 reaction cycles (Fig. 5), strongly indicating that leaching accounts for the irreversible long term deactivation process. We note that the loss of Sn under these initial reaction conditions equates to approximately 0.1% of the initial Sn leached per hour on stream (0.1% Sn h−1).
Although initial conversion levels are fully restored upon regeneration, it is notable that the initial selectivity toward methyl lactate increases in each successive cycle (Fig. 4). Indeed, between the first and fourth cycles, ML selectivity increases from 51% to 73%, with this increased level of selectivity being maintained for the last two cycles (71% and 67%, respectively). This increase occurs despite repeated deactivation and regeneration of the catalyst, and leaching. We note that a similar effect, whereby performance increases following regeneration, was also recently observed by our team.22,27 We hypothesise that changes in the structure or composition of the catalyst during these dynamic processes may be induced following the reaction/regeneration cycles.
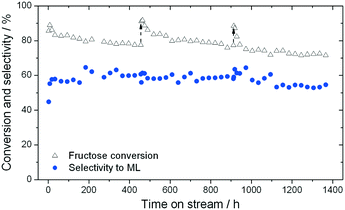
As found for GI, the addition of water to methanol in small amounts (<10% w/w) results in a dramatic increase in catalyst stability (Fig. 6). Fig. 6 presents three consecutive cycles of the same Sn-Beta material under the same conditions as Fig. 4, but with 1% of water added to the reaction feed. Two different modes of deactivation can again be observed. Firstly, an initial transient regime during the initial 60 h of operation, during which conversion decreases and selectivity towards methyl lactate increases slightly. Secondly, an apparent steady state regime over the following 400 h, where conversion only decreases slightly, and ML selectivity is maintained at approximately 60%. By comparing the rate of deactivation (kd) in this reaction (0.008–0.017 X% h−1) to that observed in the absence of water (0.23–0.59 X% h−1), it is obvious that there is a drastic increase in Sn-Beta stability following the addition of small amounts of water to the feed, in excellent agreement to the low temperature GI studies. Due to the increase in stability, regeneration was only performed twice (456 h and 912 h), for indicative purposes. This resulted in a total of 1366 h TOS, corresponding to a substrate turnover of >25![[thin space (1/6-em)]](https://www.rsc.org/images/entities/char_2009.gif) 600 (eqn (4)), with only minor losses in activity. Notably, analysis of the effluent produced during reaction in 1
600 (eqn (4)), with only minor losses in activity. Notably, analysis of the effluent produced during reaction in 1![[thin space (1/6-em)]](https://www.rsc.org/images/entities/char_2009.gif) :
:![[thin space (1/6-em)]](https://www.rsc.org/images/entities/char_2009.gif) 99 H2O
99 H2O![[thin space (1/6-em)]](https://www.rsc.org/images/entities/char_2009.gif) :
:![[thin space (1/6-em)]](https://www.rsc.org/images/entities/char_2009.gif) MeOH by ICP-MS revealed that only 7.3% of the initial Sn content was found to be in solution after 456 h (Fig. 5). This corresponds to a leaching rate of 0.016% Sn h−1, one order of magnitude lower than found in the absence of water. We note that the dramatic difference in the amount of Sn leached is outstanding, and is critical for the industrial feasibility of the system.
MeOH by ICP-MS revealed that only 7.3% of the initial Sn content was found to be in solution after 456 h (Fig. 5). This corresponds to a leaching rate of 0.016% Sn h−1, one order of magnitude lower than found in the absence of water. We note that the dramatic difference in the amount of Sn leached is outstanding, and is critical for the industrial feasibility of the system.
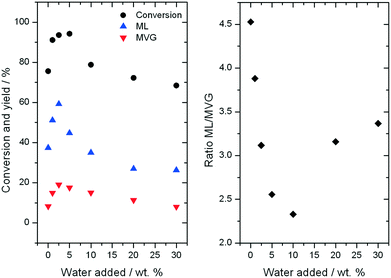
Further consequences of water in the reaction can be observed by examining the yields to different products observed during ML production. As can be seen, an increase in the yield of both desirable retro-aldol products, ML and MVG, is observed as the water content is increased up to 5% (Fig. 7, left). Maximal yield to both ML (62%) and MVG (22%) is achieved after 94 h on stream with the addition of 2.5% water (w/w), resulting in a combined yield of desirable retro-aldol products of 84% (ESI† Fig. S4). Furthermore, it is clear that water also has an effect on the distribution between the two products (Fig. 7, right). Above 5% water, (10%, 20% and 30%), lower yields to retro-aldol products, and decreased levels of catalyst stability, were observed. An optimal composition of solvent, in terms of maximising activity, selectivity and stability, is thus also evident in the high temperature regime.
Understanding the roles of water
It is clear that the addition of a small amount of water substantially improves the activity, selectivity and stability of Sn-Beta during the continuous conversion of sugars, at both low and high temperature. To elucidate how the addition of an optimal amount of water to methanol results in these improvements, a variety of methodologies to study the catalytic materials pre- and post-reaction were employed. We reasoned that the addition of water could only result in universal improvements to both systems by; (1) decreasing the rate of restructuring of the inorganic matrix; (2) decreasing chemical poisoning of the active sites through the inhibited formation, or in situ removal, of particular poisons; (3) decreasing the extent of pore fouling by minimising the production and/or accumulation of particular carbonaceous residue; and/or (4) improving the stability and performance of a specific type of active site. Characterisation studies were focused upon Sn-Beta samples partially deactivated following GI in methanol and 10![[thin space (1/6-em)]](https://www.rsc.org/images/entities/char_2009.gif) :
:![[thin space (1/6-em)]](https://www.rsc.org/images/entities/char_2009.gif) 90 H2O
90 H2O![[thin space (1/6-em)]](https://www.rsc.org/images/entities/char_2009.gif) :
:![[thin space (1/6-em)]](https://www.rsc.org/images/entities/char_2009.gif) MeOH, following 54 h of operation (Fig. 1). Samples deactivated in pure H2O were ignored, as these became amorphous during operation, and clearly experienced a different mechanism of deactivation.22
MeOH, following 54 h of operation (Fig. 1). Samples deactivated in pure H2O were ignored, as these became amorphous during operation, and clearly experienced a different mechanism of deactivation.22
Given that XRD patterns of these two samples were almost identical (ESI† Fig. S5), it can be ruled out that the addition of H2O positively impacts the structural integrity of the zeolite matrix, and that neither system deactivates through amorphisation of the catalyst, as is observed for the pure water system.22
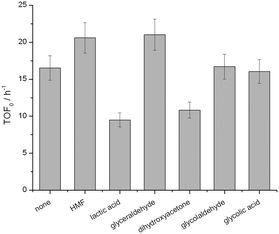
Chemical poisoning of the active sites by particular components of the reaction feed, and/or (by-)products formed during the catalytic reaction, can readily lead to deactivation of heterogeneous catalysts.28 To understand how the presence of particular species impacted the performance of Sn-Beta, the initial activity (TOF0) of Sn-Beta during batch GI was monitored both in the absence and in the presence of various (by-)products. As the addition of water is beneficial to both systems, we focused on species that could be formed in both catalytic systems. Accordingly, 10 mol% of each (by-)product, relative to the initial concentration of glucose, was added to the reaction media, and the initial rate of performance monitored under benchmarked literature conditions.29 Although some potential (by-)products do influence the intrinsic activity of Sn-Beta, only lactic acid and dihydroxyacetone negatively influence the rate of reaction beyond the limit of experimental error (Fig. 8). However, 10 mol% of these species was required to induce these changes in TOF0, which is far beyond their measured concentration during real catalytic reaction. For example, during GI in pure methanol and 10![[thin space (1/6-em)]](https://www.rsc.org/images/entities/char_2009.gif) :
:![[thin space (1/6-em)]](https://www.rsc.org/images/entities/char_2009.gif) 90 H2O
90 H2O![[thin space (1/6-em)]](https://www.rsc.org/images/entities/char_2009.gif) :
:![[thin space (1/6-em)]](https://www.rsc.org/images/entities/char_2009.gif) MeOH, the detected concentration of lactic acid and/or methyl lactate was <1 mol% relative to glucose (ESI† Table S2). Accordingly, it is unlikely a decrease in chemical poisoning upon the addition of water is the major reason behind the improved performance.
MeOH, the detected concentration of lactic acid and/or methyl lactate was <1 mol% relative to glucose (ESI† Table S2). Accordingly, it is unlikely a decrease in chemical poisoning upon the addition of water is the major reason behind the improved performance.
Pore fouling, i.e. the accumulation of residue within the pores, leading in loss of access of the active sites, is a major cause of zeolite deactivation.21 Indeed, we have recently demonstrated that fouling is observed during several catalytic processes catalysed by Sn-Beta.22,26,30 Analysis of both samples following 54 h of operation revealed that whilst the rate of deactivation decreases by one order of magnitude upon the addition of 10% H2O to methanol, limited differences in fouling are observed. Indeed, Sn-Beta experiences similar losses in pore volume following operation in pure methanol and operation 10![[thin space (1/6-em)]](https://www.rsc.org/images/entities/char_2009.gif) :
:![[thin space (1/6-em)]](https://www.rsc.org/images/entities/char_2009.gif) 90 H2O
90 H2O![[thin space (1/6-em)]](https://www.rsc.org/images/entities/char_2009.gif) :
:![[thin space (1/6-em)]](https://www.rsc.org/images/entities/char_2009.gif) MeOH, with approximately 30% loss of volume observed. Clearly, improved resistance to fouling is also not responsible for the improved levels of stability exhibited by Sn-Beta upon the addition of water to the feed.
MeOH, with approximately 30% loss of volume observed. Clearly, improved resistance to fouling is also not responsible for the improved levels of stability exhibited by Sn-Beta upon the addition of water to the feed.
Whilst the impact of fouling in terms of overall loss of porosity may be similar in both catalytic materials, it is possible that specific types of residue can more negatively affect the pure methanol catalytic system. Accordingly, TPD-MS and TGA-MS analyses of partially deactivated Sn-Beta samples were performed (ESI† Fig. S6–S9). In principle, such measurements allow the quantity and identity of carbonaceous residue to be better identified. TGA analysis of Sn-Beta samples following 54 h on stream in methanol and 10![[thin space (1/6-em)]](https://www.rsc.org/images/entities/char_2009.gif) :
:![[thin space (1/6-em)]](https://www.rsc.org/images/entities/char_2009.gif) 90 H2O
90 H2O![[thin space (1/6-em)]](https://www.rsc.org/images/entities/char_2009.gif) :
:![[thin space (1/6-em)]](https://www.rsc.org/images/entities/char_2009.gif) MeOH revealed that both samples exhibit substantial mass losses at relatively low temperatures (<180 °C). TPD-MS analysis reveals these mass losses primarily arise from residual solvent species, retained within the pores of the catalysts. It is notable, however, that since samples were dried at 115 °C for 6 h in flowing nitrogen prior to measurement, and that methanol desorption continues to occur at much higher temperatures than anticipated from its boiling point, there appears to be a strong interaction between residual methanol species and the catalyst.
MeOH revealed that both samples exhibit substantial mass losses at relatively low temperatures (<180 °C). TPD-MS analysis reveals these mass losses primarily arise from residual solvent species, retained within the pores of the catalysts. It is notable, however, that since samples were dried at 115 °C for 6 h in flowing nitrogen prior to measurement, and that methanol desorption continues to occur at much higher temperatures than anticipated from its boiling point, there appears to be a strong interaction between residual methanol species and the catalyst.
In addition to retained solvent species, TGA-MS and TPD-MS analyses also revealed that both samples also exhibit numerous mass losses at higher temperatures at 250, 350 and >400 °C, indicating the presence of strongly retained carbonaceous species. Whilst MS analysis revealed that all of these particular species were lost as CO2, it is notable that 1) the total quantity of these species, and 2) the ratio between the species, differs dramatically in both samples. Quantification of the MS signal of CO2, in addition to the TGA mass losses (Table 2), reveals that approximately 20–30% more of these high temperature species are present in Sn-Beta following operation in pure methanol, than Sn-Beta partially deactivated in 10![[thin space (1/6-em)]](https://www.rsc.org/images/entities/char_2009.gif) :
:![[thin space (1/6-em)]](https://www.rsc.org/images/entities/char_2009.gif) 90 H2O
90 H2O![[thin space (1/6-em)]](https://www.rsc.org/images/entities/char_2009.gif) :
:![[thin space (1/6-em)]](https://www.rsc.org/images/entities/char_2009.gif) MeOH (ESI† Fig. S10, Left). Support for these observations was obtained by performing identical analyses of Sn-Beta samples partially deactivated during high temperature ML production (Fig. S10, Right†). As can be seen, the addition of water in this system also decreases the extent of residue formation, and also modifies the ratio between the various species retained within the zeolite. It is therefore evident that both the total quantity, and the specific identity, of the strongly retained carbonaceous species within the pores of Sn-Beta is modified following the addition of small amounts of water to the reaction feed.
MeOH (ESI† Fig. S10, Left). Support for these observations was obtained by performing identical analyses of Sn-Beta samples partially deactivated during high temperature ML production (Fig. S10, Right†). As can be seen, the addition of water in this system also decreases the extent of residue formation, and also modifies the ratio between the various species retained within the zeolite. It is therefore evident that both the total quantity, and the specific identity, of the strongly retained carbonaceous species within the pores of Sn-Beta is modified following the addition of small amounts of water to the reaction feed.
![[thin space (1/6-em)]](https://www.rsc.org/images/entities/char_2009.gif) :
:![[thin space (1/6-em)]](https://www.rsc.org/images/entities/char_2009.gif) 90 H2O
90 H2O![[thin space (1/6-em)]](https://www.rsc.org/images/entities/char_2009.gif) :
:![[thin space (1/6-em)]](https://www.rsc.org/images/entities/char_2009.gif) MeOH for 54 h. Reaction conditions described in Table S1
MeOH for 54 h. Reaction conditions described in Table S1
| Entry | Material | S BET (m2 g−1) | V micro (cm3 g−1) | Wt% Cc |
|---|---|---|---|---|
| a Surface area determined from nitrogen adsorption using the BET equation. b Micropore volume determined by t-plot method. c Quantity of high temperature retained species (tdes > 180 °C) determined by TGA-MS analysis. | ||||
| 1 | Sn-Beta (fresh catalyst, undiluted) | 421 | 0.28 | |
| 2 | Sn-Beta/SiC (fresh catalyst, diluted in SiC) | 75 | 0.048 | — |
| 3 | Sn-Beta/SiC (used in MeOH) | 53 | 0.035 | 1.2 |
| 4 | Sn-Beta/SiC (used in 10![[thin space (1/6-em)]](https://www.rsc.org/images/entities/char_2009.gif) : :![[thin space (1/6-em)]](https://www.rsc.org/images/entities/char_2009.gif) 90 H2O 90 H2O![[thin space (1/6-em)]](https://www.rsc.org/images/entities/char_2009.gif) : :![[thin space (1/6-em)]](https://www.rsc.org/images/entities/char_2009.gif) MeOH) MeOH) |
54 | 0.036 | 1.0 |
In the absence of detailed (in situ) spectroscopic measurements of the catalysts during operation, it cannot be ruled out at this time that the addition of water does not also improve performance by modifying the specific active site(s) of the catalyst. However, since the differences in retained carbonaceous residue are relatively minor (20–30%), it is unlikely that this alone can fully account for the order of magnitude decrease in kd observed following the addition of water. Moreover, decreased residue formation is unlikely to account for the improvements observed to intrinsic reactivity i.e. a doubling of initial TOF, and/or the improved reaction selectivity.
Accordingly, since water universally affects catalytic activity, selectivity and stability in both low temperature and high temperature processes, it is likely that water must also have some influence on the specific active site of the catalyst. This could be caused by direct hydration of the active site converting it to a more active form. For example, the ability of water to hydrate Sn-Beta, transforming tetravalent closed tin sites into penta- and hexavalent tin sites has been confirmed by NMR.31,32 Additionally, water may as a solvent modify the surroundings in the vicinity of the active site, leading to a more polar environment compared to pure methanol, which could favour the transformation of sugars. Since conclusive support of these hypotheses can only be achieved by detailed in situ spectroscopic studies, such studies represent the focus point of our on-going research.
Conclusions
In this manuscript, it is shown that the addition of small amounts of water to the sugar/methanol feed used for sugar upgrading significantly improves the activity, selectivity and long-term stability of the catalyst, Sn-Beta, during continuous operation. The effect is universal across two different reactions, including the isomerization of glucose to fructose at low temperatures (110 °C), and the conversion of fructose into methyl lactate at higher temperatures (160 °C). Together with an increase of stability, significant decreases in Sn leaching are also observed. Moreover, the addition of small amounts of water positively impacts the catalytic activity and the selectivity of the catalyst during these reactions. In both catalytic systems, optimal performance is obtained when small amounts of water (1 < x < 10% w/w) are added to methanol. For the first time, therefore, it is shown that the continuous conversion of sugars to commodity chemicals can be achieved with a heterogeneous catalyst, without excessive rates of deactivation being observed. This dramatically improves the potential intensification of such sustainable catalytic processes.Although not fully conclusive, preliminary characterization of the used catalysts by XRD, porosimetry, TGA-MS and TPD-MS reveal that the addition of water results in only minor changes to the used catalytic materials, despite the dramatic differences in kinetic behaviour. Most notable amongst these changes is the diminished formation of some strongly retained carbonaceous residue accumulated within the catalyst. However, as this effect is relatively minor, it likely does not fully explain the modified kinetic behaviour. Tentative hypotheses regarding additional roles of water are proposed.
Experimental
Catalyst synthesis
For glucose isomerisation experiments, a commercial zeolite Al-Beta (Zeolyst, NH4+-form, Si/Al = 19) was dealuminated by treatment in HNO3 solution (13 M HNO3, 100 °C, 20 mL g−1 zeolite, 20 hours if not specified differently in the text). Solid-state stannation of dealuminated zeolite *BEA was performed the procedure reported in ref. 29, by grinding the appropriate amount of tin(II) acetate with the necessary amount of dealuminated zeolite for 10 minutes in a pestle and mortar. Following this procedure, the sample was heated in a combustion furnace (Carbolite MTF 12/38/400) to 550 °C (10 °C min−1 ramp rate) first in a flow of N2 (3 h) and subsequently air (3 h) for a total of 6 h. Gas flow rates of 60 mL min−1 were employed at all times.For ML production experiments, Sn-Beta was prepared using a commercial zeolite (Zeolyst, NH4+-form, Si/Al = 19) was calcined at 550 °C for 6 h and treated in a solution of HNO3 (65%, 80 °C, 10 mL g−1 zeolite). After thoroughly washing of the dealuminated sample, the solid was recovered by vacuum filtration and tin was introduced using tin(II)chloride (Sigma-Aldrich, 98%) dissolved in water by incipient wetness impregnation to yield a Si/Sn ratio of 125 in the material. The catalyst was finalized by drying the sample at 110 °C for 12 h followed by calcination (550 °C, 6 h, 2 °C min−1).
Catalyst characterisation
A PANalytical X'PertPRO X-ray diffractometer was employed for powder XRD analysis. A CuKα radiation source (40 kV and 30 mA) was utilised. Diffraction patterns were recorded between 6–55° 2θ (step size 0.0167°, time/step = 150 s, total time = 1 h). Specific surface area was determined from nitrogen adsorption using the BET equation, and microporous volume was determined from nitrogen adsorption isotherms using the t-plot method. Porosimetry measurements (Table 2) were performed on a Quantachrome Quadrasorb, and samples were degassed prior to use (115 °C, 6 h, nitrogen flow). Adsorption isotherms were obtained at 77 K. TGA analysis was performed on a Perkin Elmer system. Samples were held isothermally at 30 °C for 30 minutes, before being heated to 550 °C (10 °C min−1 ramp rate) in air. TPD-MS measurement were carried out on a home-made system formed by a Bruker Tensor II equipped with a Harrick praying mantis DRIFT cell connected with the MS. The catalyst was placed inside the drift cell and its surface was constantly monitored by the IR spectrometer. The cell was heated from 30 to 550 °C (ramp rate 10 °C min) and a constant flow of air was kept throughout the experiment. The outlet of the DRIFT cell was connected to a Hiden QGA mass spectrometer for the online analysis of the gas phase.Elemental analysis of tin in the product samples was performed on an Agilent 7500ce ICP-MS, diluting samples in xylene, adding an internal standard (Conostan) and comparing against a reference solution (S-21 + K, Conostan).
Kinetic evaluation and analytical methods
Continuous GI reactions were performed in a plug flow, stainless steel, tubular reactors. The reactor was connected to an HPLC pump in order to regulate the reactant flow and allow operation at elevated pressures. The catalyst was mixed with a diluent material (SiC (particle size of 63–75 μm)), and the catalytic bed placed in between two plugs of quartz wool. The diluted sample was densely packed into a 1/4” stainless steel tube (4.1 mm internal diameter), and a frit of 0.5 μm was placed at the reactor exit. The reactor was subsequently immersed in a thermostatted oil bath at the desired reaction temperature. Pressure in the system was controlled by means of a backpressure regulator, typically set at 10 bar, in order to allow operations above the boiling temperature of the solvent. Full reaction conditions described in Table S2.† Aliquots of the reaction solutions were taken periodically from a sampling valve placed after the reactor and analysed by an Agilent 1260 Infinity HPLC equipped with a Hi-Plex Ca column and ELS detector and quantified against an external standard (sorbitol) added to the sample prior the injection. Where applicable, periodic regeneration was performed by heating the whole reactor in a combustion furnace (Carbolite MTF 12/38/400) to 550 °C (10 °C min−1) in air (3 h).GI poisoning studies were performed in a pressurised Ace tubular glass reactor thermally controlled by a hot oil bath on an IKA hot plate. The right amount of reactant solution, catalyst and poison was placed inside the reactor in order to fix the glucose/Sn and glucose/poison molar ratio to 50 and 10 respectively. Samples were periodically collected and analysed by HPLC as described above.
Methyl lactate production was performed using 0.25 g of Sn-Beta catalyst in a 1/4′′ stainless steel tube fractioned to a size of 300–600 μm and placed between two quartz plugs. A solution of 12.5 g L−1 fructose, 2.5 mg L−1 K2CO3 in varying H2O![[thin space (1/6-em)]](https://www.rsc.org/images/entities/char_2009.gif) :
:![[thin space (1/6-em)]](https://www.rsc.org/images/entities/char_2009.gif) MeOH (0
MeOH (0![[thin space (1/6-em)]](https://www.rsc.org/images/entities/char_2009.gif) :
:![[thin space (1/6-em)]](https://www.rsc.org/images/entities/char_2009.gif) 100 to 30
100 to 30![[thin space (1/6-em)]](https://www.rsc.org/images/entities/char_2009.gif) :
:![[thin space (1/6-em)]](https://www.rsc.org/images/entities/char_2009.gif) 70) mixtures was led over the bed using a Knauer pump. 0.25 g of catalyst (Sn-Beta, Si/Sn = 125) and a flow rate of 0.15 mL min−1 were employed. Reactions were performed at 160 °C. Sampling was done at regular intervals using a Valco autosampler (VICI®). Ex situ thermal regeneration of the catalyst was performed by removing the catalyst from the reactor and treating the sample at 550 °C for 6 h in a muffle furnace (Nabertherm). Unconverted sugars were quantified on an Agilent 1200 HPLC with an Aminex HPX-87H (BioRad) column equipped using a diluted sulphuric acid eluent (0.004 M H2SO4, 0.6 mL min, 65 °C) was used to quantify unconverted sugars using the response factor of fructose. Methyl lactate (ML) and methyl vinyl glycolate (MVG) were both quantified on an Agilent 7890A GC-FID with a SolGel-WAX column (Phenomenex) equipped.
70) mixtures was led over the bed using a Knauer pump. 0.25 g of catalyst (Sn-Beta, Si/Sn = 125) and a flow rate of 0.15 mL min−1 were employed. Reactions were performed at 160 °C. Sampling was done at regular intervals using a Valco autosampler (VICI®). Ex situ thermal regeneration of the catalyst was performed by removing the catalyst from the reactor and treating the sample at 550 °C for 6 h in a muffle furnace (Nabertherm). Unconverted sugars were quantified on an Agilent 1200 HPLC with an Aminex HPX-87H (BioRad) column equipped using a diluted sulphuric acid eluent (0.004 M H2SO4, 0.6 mL min, 65 °C) was used to quantify unconverted sugars using the response factor of fructose. Methyl lactate (ML) and methyl vinyl glycolate (MVG) were both quantified on an Agilent 7890A GC-FID with a SolGel-WAX column (Phenomenex) equipped.
Conflicts of interest
There are no conflicts to declare.Acknowledgements
CH gratefully appreciates the support of The Royal Society, for provision of a University Research Fellowship (UF140207) and additional research grant funding (CH140207). CH and LB are also grateful to Haldor Topsøe A/S for additional research funding. Part of this work was funded by the Bio-Value platform under the SPIR initiative by the Danish Council for Strategic Research and The Danish Council for Technology and Innovation, case number 0603-00522B.Notes and references
- I. Delidovich, K. Leonhard and R. Palkovits, Energy Environ. Sci., 2014, 7, 2803 CAS.
- C. O. Tuck, E. Pérez, I. T. Horváth, R. A. Sheldon and M. Poliakoff, Science, 2012, 337, 695 CrossRef CAS PubMed.
- X. Zhang, K. Wilson and A. F. Lee, Chem. Rev., 2016, 116, 12328 CrossRef CAS PubMed.
- T. Ennaert, J. V. Aelst, J. Dijkmans, R. De Clercq, W. Schutyser, M. Dusselier, D. Verboekend and B. F. Sels, Chem. Soc. Rev., 2016, 45, 584 RSC.
- M. J. Climent, A. Corma and S. Iborra, Green Chem., 2014, 16, 516 RSC.
- I. Sadába, M. Lopez Granados, A. Riisager and E. Taarning, Green Chem., 2015, 17, 4133 RSC.
- J.-P. Lange, Catal. Sci. Technol., 2016, 6, 4759 CAS.
- G. M. Lari, P. Y. Dapsens, D. Scholz, S. Mitchell, C. Mondelli and J. Perez-Ramirez, Green Chem., 2016, 18, 1249 RSC.
- J. Dijkmans, D. Gabriëls, M. Dusselier, F. Clippel, P. Vanelderen, K. Houthoofd, A. Malfliet, Y. Pontikesb and B. F. Sels, Green Chem., 2013, 15, 2777 RSC.
- M. Moliner, Y. Román-Leshkov and M. E. Davis, Proc. Natl. Acad. Sci. U. S. A., 2010, 107, 6164 CrossRef CAS PubMed.
- Y. Román-Leshkov, M. Moliner, J. A. Labinger and M. E. Davis, Angew. Chem., Int. Ed., 2010, 49, 8954 CrossRef PubMed.
- Y. Román-Leshkov and M. E. Davis, ACS Catal., 2011, 1, 1566 CrossRef.
- M. Moliner, Dalton Trans., 2014, 43, 4197 RSC.
- M. S. Holm, S. Saravanamurugan and E. Taarning, Science, 2010, 328, 602 CrossRef CAS PubMed.
- S. Tolborg, I. Sádaba, C. M. Osmundsen, P. Fristrup, M. S. Holm and E. Taarning, ChemSusChem, 2015, 8, 613 CrossRef CAS PubMed.
- C. M. Lew, N. Rajabbeigi and M. Tsapatsis, Ind. Eng. Chem. Res., 2012, 51, 5364 CrossRef CAS.
- E. Nikolla, Y. Román-Leshkov, M. Moliner and M. E. Davis, ACS Catal., 2011, 1, 408 CrossRef CAS.
- A. Dewaele, L. Meerten, L. Verbelen, S. Eyley, W. Thielemans, P. Van Puyvelde, M. Dusselier and B. Sels, ACS Sustainable Chem. Eng., 2016, 4, 5943 CrossRef CAS.
- A. Sølvhøj, E. Taarning and R. Madsen, Green Chem., 2016, 18, 5448 RSC.
- A. Corma, L. T. Nemeth, M. Renz and S. Valencia, Nature, 2001, 412, 423 CrossRef CAS PubMed.
- C. Hammond, Green Chem., 2017, 19, 2711 RSC.
- D. Padovan, C. Parsons, M. S. Grasina and C. Hammond, Green Chem., 2016, 18, 5041 RSC.
- S. G. Elliot, S. Tolborg, I. Sádaba, E. Taarning and S. Meier, ChemSusChem, 2017, 10, 2990 CrossRef CAS PubMed.
- C. M. Osmundsen, M. S. Holm, S. Dahl and E. Taarning, Proc. R. Soc. A, 2012, 468, 2000 CrossRef CAS.
- O. Levenspiel, Chemical Reaction Engineering, John Wiley & Sons, New York, 3rd edn, 1999, ch. 21, p. 473 Search PubMed.
- S. Tolborg, S. Meier, I. Sádaba, S. G. Elliot, S. K. Kristensen, S. Saravanamurugan, A. Riisager, P. Fristrup, T. Skrydstrup and E. Taarning, Green Chem., 2016, 18, 3360 RSC.
- D. Padovan, A. Al-Nayili and C. Hammond, Green Chem., 2017, 19, 2846 RSC.
- K. Yakabi, K. Milne, A. Buchard and C. Hammond, ChemCatChem, 2016, 8, 3490 CrossRef CAS.
- C. Hammond, D. Padovan, A. Al-Nayili, P. P. Wells, E. K. Gibson and N. Dimitratos, ChemCatChem, 2015, 7, 3322 CrossRef CAS PubMed.
- A. Al-Nayili, K. Yakabi and C. Hammond, J. Mater. Chem. A, 2016, 4, 1373 CAS.
- W. R. Gunther, V. K. Michaelis, M. A. Caporini, R. G. Griffin and Y. Román-Leshkov, J. Am. Chem. Soc., 2014, 136, 6219 CrossRef CAS PubMed.
- S.-J. Hwang, R. Gounder, Y. Bhawe, M. Orazov, R. Bermejo-Deval and M. E. Davis, Top. Catal., 2015, 58, 435 CrossRef CAS.
Footnotes |
| † Electronic supplementary information (ESI) available. See DOI: 10.1039/c7re00180k |
| ‡ These authors contributed equally. |
| This journal is © The Royal Society of Chemistry 2018 |

