 Open Access Article
Creative Commons Attribution 3.0 Unported Licence
Laser irradiated vortex fluidic mediated synthesis of luminescent carbon nanodots under continuous flow†
Xuan
Luo
 ab,
Ahmed Hussein Mohammed
Al-Antaki
b,
Kasturi
Vimalanathan
b,
Jillian
Moffatt
c,
Kun
Zheng
de,
Yichao
Zou
 f,
Jin
Zou
 df,
Xiaofei
Duan
g,
Robert N.
Lamb
h,
Shujun
Wang
 i,
Qin
Li
 i,
Wei
Zhang
*a and
Colin L.
Raston
 *b
*b
aCentre for Marine Bioproducts Development, College of Medicine and Public Health, Flinders University, Adelaide, SA 5042, Australia. E-mail: wei.zhang@flinders.edu.au
bCentre for NanoScale Science and Technology (CNST), College of Science and Engineering, Flinders University, Adelaide, SA 5042, Australia. E-mail: colin.raston@flinders.edu.au
cInstitute for Photonics and Advanced Sensing, and School of Physical Sciences, The University of Adelaide, SA 5005, Australia
dCentre for Microscopy and Microanalysis, The University of Queensland, Brisbane, QLD 4072, Australia
eAustralian Institute for Bioengineering and Nanotechnology, The University of Queensland, Brisbane, QLD 4072, Australia
fMaterials Engineering, The University of Queensland, Brisbane, QLD 4072, Australia
gTrace Analysis for Chemical, Earth and Environmental Sciences (TrACEES), The University of Melbourne, Victoria 3010, Australia
hSchool of Chemistry, The University of Melbourne, Victoria 3010, Australia
iEnvironmental Engineering and Queensland Micro and Nanotechnology Centre, Griffith University, Brisbane, QLD 4111, Australia
First published on 15th January 2018
Abstract
Carbon nanodots (CDs) with size dependent fluorescence are synthesized from multi-walled carbon nanotubes (MWCNTs) under continuous flow in a vortex fluidic device (VFD) when irradiated by a pulsed laser with a wavelength of 1064 nm, without subsequent passivation procedures. The CDs have a relatively narrow size distribution averaging ca. 6 nm in diameter, and have low cytotoxicity and high colloidal stability with the highest emission intensity of the solution at 450 nm under a 345 nm excitation wavelength. Further downstream processing on the as-processed CDs revealed tunability of the emission from 450 nm to 325 nm.
Introduction
Carbon nanodots (CDs) are carbon nanoparticles <10 nm in diameter, consisting of a graphitic structure or amorphous carbon core and carbonaceous surfaces, with rich oxygen-containing groups.1 CDs exhibit distinct properties, most notably strong quantum confinement and edge effects resulting in exceptional fluorescent characteristics.2 The unique functional properties and benign chemical composition have rendered CDs a promising new material for a broad range of applications including bioimaging,3 drug delivery,4 and optoelectronic devices.5 Various feedstocks have been used for producing CDs including single walled carbon nanotubes,6 carbohydrates,7 polyethylenimine,8 low molecular weight alcohols,9 graphite,10 and carbon soot.3 In general, the quantum yield of CDs varies dramatically, from 1.32% (ref. 11) up to around 43%,12 depending on the choice of carbon feedstock. A number of methods have been reported to prepare CDs within these dimensions, including chemical ablation, laser ablation,2 electrochemical carbonisation,9 arc-discharge pyrolysis,2 hydrothermal synthesis,12 and ultrasound and microwave-assisted pyrolysis.13 Laser ablation is a well-studied technique in synthesizing CDs from various carbon-based targets.14–16 The significant advantage of this technique over other methods is that the processing is relatively clean, with reduced byproduct formation.15 However, the potential of synthesizing CDs through laser ablation in liquids is limited by the scalability and gravitational settling of the raw material.15 Other potential issues using conventional laser ablation processing include controlling the crystallinity of the CDs,17 relatively long processing times,15 and the requirement for additional passivation reaction, for example long acid refluxing times.14,18One of the most common methods of fabricating oxygen-containing CDs involves using a mixture of concentrated H2SO4 and HNO3.19 However, this requires tedious purification procedures to remove the excess acid, and uses toxic and harsh chemicals. The catalytic activity of MWCNTs towards H2O2 decomposition (HPD) has been reported in a few studies, and the properties of the nanotubes post processing can be affected.20 A mixture of H2O2 and 1 M HCl or 96 wt% H2SO4 has been used for the oxidation and purification of carbon nanotubes (CNTs),21 with 15% H2O2 alone at 100 °C for 3 hours being effective in removing the end caps and shortening the length of the CNTs with concomitant surface carboxylic group fuctionalization.22,23 Related to this is the degradation of graphene sheets using H2O2, with a time-dependant generation of randomly distributed nanometer-sized holes on the surface of the 2D material.24 There are no reports on the application of HPD in fabricating CDs in gaining access to particles with uniform morphology nor on laser-assisted continuous production of CDs where there is an emphasis on green chemistry metrics.
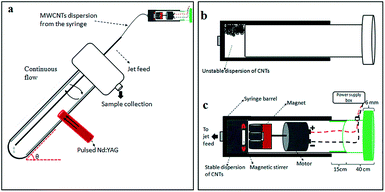
Given the issues discussed above, we embarked on developing a simple, more environmentally friendly, economical and controllable synthesis of CDs using the recently developed thin film microfluidic vortex fluidic device (VFD) coupled with NIR irradiation using a pulsed laser operating at 1064 nm, under continuous flow (Fig. 1a). The use of VFD mediated synthesis of CDs enhances the prospect of product homogeneity under plug flow and uniform irradiation and high shear stress (mechanoenergy), in overcoming most of the drawbacks of conventional laser ablation processing. Indeed, CDs processed using this rationale approach have better size homogeneity, as evidence by the excitation-wavelength independent fluorescence emission.11
The novel top-down reforming of nano-carbon reported herein uses MWCNTs as the feedstock. The controlled reforming of MWCNTs to CDs occurs under continuous flow in the presence of hydrogen peroxide (30% aqueous solution) as the oxidant and solvent, in dynamic thin films in the VFD under laser irradiation at 1064 nm. The unique fluidic dynamic properties of the VFD has been applied in a number of other applications, including lateral slicing of single, double and multi-walled CNTs despite their remarkably high tensile strength,25 intensified aqueous two phase separation,26 fabricating fluorescent nanoparticles,27 exfoliating graphite and boron nitride28 and fabricating intertwined single walled carbon nanotube rings.29 The optimum angle of tilt of the rapidly rotating glass tube in the VFD for all of these applications is 45°, and accordingly for the present work this angle was also used, using 20 mm O.D. borosilicate glass tubes, 18 cm in length. In the continuous flow mode, MWCNTs dispersed in solution using an in-house designed magnetic-assisted mixing system (Fig. 1b and c) were delivered via the jet feed to the bottom of the VFD tube and the high shear in the thin film as it whirls up the tube,25 which improved the scalability of conventional laser ablation processing into effective disintegrating and exfoliating fragmented graphene sheets of the MWCNTs. Aqueous H2O2 was the choice of solvent as an inexpensive, green and environmentally-friendly oxidant which produces high concentrations of hydroxyl free radicals under laser irradiation.30 Fabricated CDs exhibit luminescence with a quantum yield of 2.2%, consistent with derived from similar raw material.11
Results and discussion
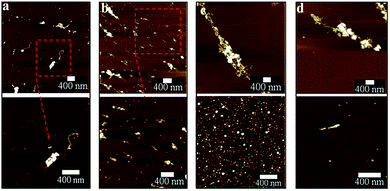
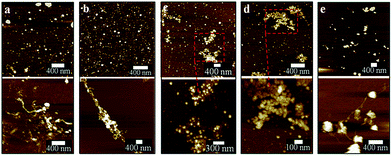
The optimized VFD operating conditions for fabricating CDs from MWCNTs while irradiated with a pulsed laser are θ 45° and rotational speed 7500 rpm at a flow rate of 0.45 mL min−1. The absence of laser irradiation under the same conditions simply results in debundling of CNTs (Fig. S1a–c†). To further decouple the effect of the VFD and the laser irradiation, a pulsed laser at the optimized power of 450 mJ was directed towards the CNTs dispersed in H2O2 mixed using a magnetic stirrer in a quartz cuvette rather than in a VFD tube. This resulted in minimal conversion of the CNTs into CDs, with large bundles and aggregates of CNTs still present (Fig. S1d†).In mapping out the optimized conditions for fabricating the CDs, as-processed samples were centrifuged at 1180 × g to remove any aggregates or bundled nanotubes before atomic force microscopy (AFM), following a previously reported procedure.25 Operating parameters of the VFD and laser were systematically varied under continuous flow, changing one parameter at a time en route to the optimised conditions. For rotational speeds below 6500 rpm at a 45° tilt angle, apart from the presence of large bundles, short length CNTs (about 300 nm) were observed after processing (Fig. 2a and b). At 7500 rpm, a significant amount of CDs formed compared with all other rotational speeds conducted at the same laser power (Fig. 2c), even though large bundles of long CNTs were still persistent. Further increase to 8000 rpm resulted in less amount of CDs being generated. This might be due to material remaining in the VFD tube as a result of increased centrifugal force. These optimal conditions (θ 45°, 7500 rpm) also correspond to the optimal processing condition for lateral slicing of carbon nanotubes using laser-VFD processing.25 At lower laser powers, ≤260 mJ (Fig. 3a and b), the conversion was ineffective and there was no clear band at the site of laser irradiation of the tube (Fig. S2†). The conversion was also ineffective at high laser power (>450 mJ) which might be due to the disturbance of the dynamic thin film. The position of the stainless steel jet feeds delivering solution to the base of the tube needs to avoid direct irradiation by the laser. Otherwise a significant amount of metal oxide nanoparticles are generated, as evidenced by transmission electron microscopy (TEM), Raman spectroscopy and scanning electron microscopy (SEM)/energy dispersive X-ray spectroscopy (EDX) (Fig. S3 and S4†). Raman mapping was used to verify the crystalline nature and degree of sp2 hybridisation of the CDs relative to the MWCNTs. Processing with the laser operating at 532 nm (Fig. S5, Table S1†) resulted in less CDs being formed, with poorer sample homogeneity relative to those prepared under the NIR laser (θ 45°, 7500 rpm rotational speed) operating at 1064 nm (Fig. S6†).
Post-VFD processing, centrifugation improved the sample purity by removing the large bundled MWCNTs but this led to a significant loss of CDs to the pellet. For generating practical quantities of CDs, no centrifugation was applied. The conversion of MWCNTs to CDs could be further improved by lowering the starting material concentration from 0.5 to 0.1 mg mL−1 (Fig. 4d). A similar outcome was also reported for slicing of CNTs25 which was explained by the high concentration of CNTs disturbing the complex fluid dynamics of the thin film in the device. Two sequential continuous NIR laser-VFD cycles of the same sample (θ 45°, 7500 rpm rotational speed, at 450 mJ laser power) further increased the conversion of the MWCNTs nanotubes to CDs (Fig. 4e). This was confirmed using photoluminescence (PL) where the intensity of the second-cycled CDs increased 11.8 times compared with one cycle processed material (Fig. S7†), but a reduction of CDs yield revealed when three or more cycles was carried out.
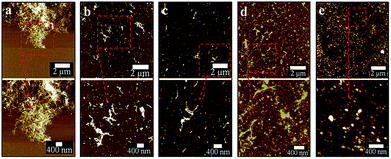
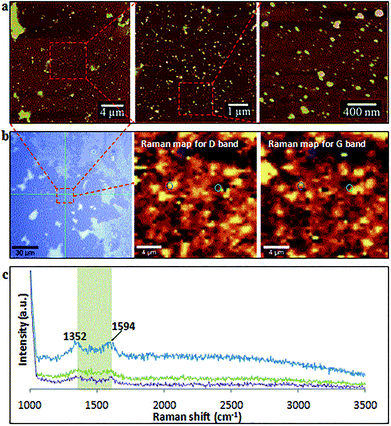
After two cycles of laser-VFD processing, Raman mapping was conducted over a particle enriched area (AFM confirmed) (Fig. 5a). The two Raman maps correspond to the map for D (1352 cm−1) and the map for G (1594 cm−1) bands (Fig. 5b). As shown, these spherical particles are graphitic with well-matched signals for D and G bands. Single Raman spectrum (Fig. 5c) extracted from three randomly circled areas (Fig. 5b) show a typical graphitic spectrum with the D-band at 1352 cm−1 (1346 cm−1 for MWCNTs), and the G-band at 1594 cm−1 (1586 cm−1 for MWCNTs). This blue shift of the G-band to a higher frequency and the disappearance of 2D peak at 2682 cm−1 compared to as received MWCNTs (Fig. S1a†) is consistent with the surface oxidation of the CD, as reported by Islam et al.31 for oxidized single layer graphene. The bandwidth of full width at half maximum (FWHM) significantly increased from 64 cm−1 (as received MWCNTs) to 93 cm−1 (CDs), which again is consistent with the oxidation state.32
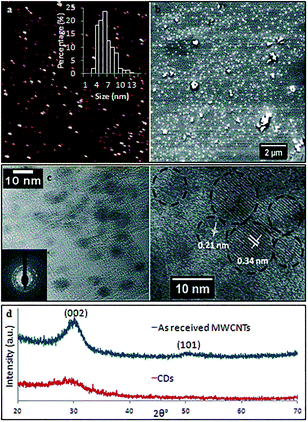
TEM and AFM established that the as-prepared CDs were quasi-spherical and showed an average height ca. 6 nm (from 3 to 13 nm) (Fig. 6). These are formed from fragmentation of 10 nm outer diameter MWCNTs, presumably involving exfoliation and agglomeration of small graphene sheets which have increased surface area and surface energy.33 High resolution TEM (HRTEM) gave 0.21 nm and 0.34 nm lattice spacings which correspond to the {100} and {002} planes of graphitic carbon.34 This is in agreement with the spacing calculated from the diffraction pattern taken from the CDs (inset of Fig. 6c). X-ray diffraction (XRD) for the as-received MWCNTs had peaks at 2θ 29.98° and 50.13° (weak) (Fig. 6d) which correspond to (002) and (101) atomic planes respectively for the hexagonal structured graphitic material.35 XRD of CDs had a broader peak at 2θ 29.04°, and their calculated interlayer d-spacing (d002) is 0.34 nm which is in good agreement with the graphitic interlayer spacing.36 The broad and weak nature of the peak indicates the presence of some poorly crystalline carbon, which is consistent with the generation of oxygen containing groups during the processing.
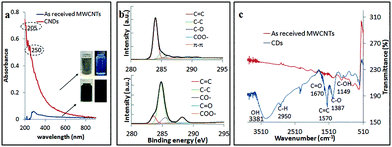
The CDs obtained using the optimal processing conditions had good water solubility and colloidal stability, with little or no change in their optical properties over several weeks, and these are distinctly different from those of as received MWCNTs (Fig. 7a). The CDs had a broad absorption spectrum with a tail extending into the visible region and this is attributed to the π–π* transition of the conjugated C![[double bond, length as m-dash]](https://www.rsc.org/images/entities/char_e001.gif) C bond (205 nm) and n–π* transition of C
C bond (205 nm) and n–π* transition of C![[double bond, length as m-dash]](https://www.rsc.org/images/entities/char_e001.gif) O bond (250 nm), which is in good agreement with the findings of Lin et al.37 XPS established that the oxygen content increased significantly for as received MWCNTs (1.54% oxygen content) of compared to CDs (18.7% oxygen content). The CDs were oxidized (C
O bond (250 nm), which is in good agreement with the findings of Lin et al.37 XPS established that the oxygen content increased significantly for as received MWCNTs (1.54% oxygen content) of compared to CDs (18.7% oxygen content). The CDs were oxidized (C![[double bond, length as m-dash]](https://www.rsc.org/images/entities/char_e001.gif) C/C–C, 15.5% molar ratio), and deconvolution of the C 1s peak established atomic percentage of different types of C bonds – sp2 (C
C/C–C, 15.5% molar ratio), and deconvolution of the C 1s peak established atomic percentage of different types of C bonds – sp2 (C![[double bond, length as m-dash]](https://www.rsc.org/images/entities/char_e001.gif) C at 284 eV, 12.2% molar ratio), sp3 (C–C/C–H at 285.2 eV, 65.0% molar ratio), C–O (285.7 eV, 11.4%), O–C
C at 284 eV, 12.2% molar ratio), sp3 (C–C/C–H at 285.2 eV, 65.0% molar ratio), C–O (285.7 eV, 11.4%), O–C![[double bond, length as m-dash]](https://www.rsc.org/images/entities/char_e001.gif) O (289.4 eV, 10.7% molar ratio) and π–π* interaction (shakeup, 290.9 eV) (Fig. 7b). The sp3 intensity is much stronger than the sp2 which confirmed the oxidation of the CDs relative to MWCNTs. FT-IR spectra of the CDs gave characteristic absorption peaks for –OH stretching, 3381 cm−1, and C
O (289.4 eV, 10.7% molar ratio) and π–π* interaction (shakeup, 290.9 eV) (Fig. 7b). The sp3 intensity is much stronger than the sp2 which confirmed the oxidation of the CDs relative to MWCNTs. FT-IR spectra of the CDs gave characteristic absorption peaks for –OH stretching, 3381 cm−1, and C![[double bond, length as m-dash]](https://www.rsc.org/images/entities/char_e001.gif) O stretching, ca. 1670 cm−1 (Fig. 7c). These findings agree with the XPS, XRD and HRTEM data. The formation of oxygen-containing functionality on the surface of the CDs during the laser-VFD processing accounts for their water solubility.
O stretching, ca. 1670 cm−1 (Fig. 7c). These findings agree with the XPS, XRD and HRTEM data. The formation of oxygen-containing functionality on the surface of the CDs during the laser-VFD processing accounts for their water solubility.
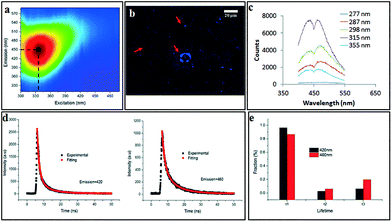
The scalability of the process was investigated by processing 50 mg of as received MWCNTs dispersed in 500 mL of H2O2. Approximately 40% of starting material was converted to CDs, as deduced from residual material remaining in the syringe and the VFD tube post processing. The yield of dialysed CDs which showed negligible cytotoxicity (Fig. S14†) was ca. 10%, based on the total amount of initial MWCNT. 2D-fluorescence maps of the CDs showed maximum excitation wavelength at 345 nm and an emission at 450 nm (blue in the visible region) (Fig. 8a) with the as-received MWCNTs showing no fluorescence. Drop-cast CDs showed UV-excitable (at 365 nm) characteristics under the fluorescence microscope (Fig. 8b). Two resolved photoluminescence (PL) emission peaks at 420 and 460 nm (Fig. 8c) which were considered to be constant, meaning the emission is independent of the excitation wavelength (277–355 nm). Such excitation-independent PL emission is attributed to relative size uniformity, as previously noted for graphene quantum dots fabricated using microfluidisation.11 Fluorescence lifetime was analysed for both emission peaks under the excitation of a 377 nm pulsed laser (Fig. 8d). Both decay curves can be well fitted with a 3-component exponential model, which can be understood by the emission being an integration of at least three emissive sites (Fig. 8e). The fastest decay has a lifetime (τ1) about 1.4 ns, and the intermediate component has a lifetime (τ2) around 3 ns, while the slowest lifetime (τ3) is in the range of 8.5 to 9.0 ns. The lifetime results are consistent with a previous report38 which attributes the PL of CDs as arising from an integration of PL components from three types of emission centres, namely, σ*–n and π*–n transitions (emissions from functional groups dominate the blue side, corresponding to τ1), π*–π transition (emissions from aromatic core of the CDs, corresponding to τ2) and π*-midgap states-π transitions (emission normally on the red side dominated by the midgap states that are created by functional groups and defects, corresponding to τ3). Since the PL spectrum of CDs shows two distinctive peaks centred at 420 and 460 nm, respectively, PL lifetime analysis was carried out for each emission peak. The percentage of the longer lifetime component (τ3) of 460 nm emission is more than 13% higher than that of 420 nm emission, which indicates that the origin of 460 nm emission peak arises from stronger association with the surface functional group. Under both acidic (pH = 1) and alkaline conditions (pH = 12), PL of the CDs was quenched (Fig. S15†), with the emissive peak at 460 nm under neutral conditions (pH = 7) disappearing when the pH was adjusted either way, acidic or basic. This observation indicates that the emission peak at 460 nm is strongly associated with the surface functional groups, predominantly the –COO− which is consistent with the XPS results. Either the H+ or OH− cause the formation of non-radiative complexes with the surface functional groups of the CDs and lead to static quenching.
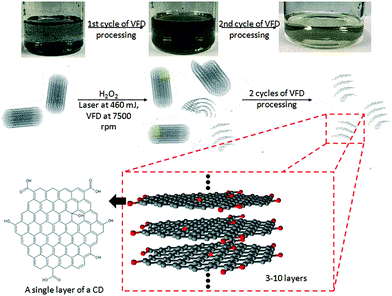
AFM, TEM, Raman, FT-IR, XPS and PL of the CD are consistent with the proposed structure shown in Fig. 9. This corresponds well with what has been proposed in most studies, with CDs having a graphitic core and an oxidized surface. Oxidation of the MWCNTs can occur at the ends of the nanotube or at defect sites on the sidewalls, which includes sp3-hybridised defects, and vacancies between the nanotube lattice or dangling bonds.23 The surface functionalisation could be visually evaluated in terms of the solubility changes after the first laser-VFD cycle. Post-VFD processing, uncapped CNTs, nanometer-sized holes, shortened CNTs and disrupted side walls were evident (Fig. S11†). These could arise from oxidation of C–C bonds around initial defect sites.24 H2O2 may penetrate such defect sites, attacking the underlying C–C bonds causing further sidewall damage facilitated by laser irradiation.21 Similar effects were also observed with SWCNTs and DWCNTs (Fig. S12†). Raman spectroscopy of laser-VFD processed SWCNTs, DWCNTs and MWCNTs all showed significant increase in the ID/IG ratio, which is consistent with an increase in functional groups on the sample surface. Overall, this solvent initiated layer-by-layer degradation in the presence of laser irradiation and mechanical energy input from the VFD are collectively responsible in the fabrication of CDs. Post-VFD processing, further tuning of fluorescence and chemical adoption is achievable (Fig. S16†). As-processed CDs (dispersed in H2O2) and ethanol (ratio of 1![[thin space (1/6-em)]](https://www.rsc.org/images/entities/char_2009.gif) :
:![[thin space (1/6-em)]](https://www.rsc.org/images/entities/char_2009.gif) 1) were eluted through an adsorption column packed with molecular sieve and magnesium sulphate. Different fluorescence properties were observed. Additionally, CDs dispersed in H2O2 and ammonia (25%) (ratio 6
1) were eluted through an adsorption column packed with molecular sieve and magnesium sulphate. Different fluorescence properties were observed. Additionally, CDs dispersed in H2O2 and ammonia (25%) (ratio 6![[thin space (1/6-em)]](https://www.rsc.org/images/entities/char_2009.gif) :
:![[thin space (1/6-em)]](https://www.rsc.org/images/entities/char_2009.gif) 1) and heated at 60 °C, as a variation of the method reported by Jiang et al.,39 resulted in doping of N (1.46% XPS) but there was no change on the PL spectrum (Fig. S13†).
1) and heated at 60 °C, as a variation of the method reported by Jiang et al.,39 resulted in doping of N (1.46% XPS) but there was no change on the PL spectrum (Fig. S13†).
Conclusions
We have developed a simple and relatively benign method using a VFD to produce water soluble CDs with scalability incorporated into the processing. The optimum operating parameters correspond to a sample concentration of 0.1 mg mL−1, rotational speed of 7500 rpm, 0.45 mL min−1 flow rate, with a laser power of 450 mJ. The CDs exhibit excitation wavelength independent PL behavior with two distinctive emission peaks around 420 and 460 nm, being an integration of at least three emissive sites originated from the aromatic core, defects and functional groups. CDs are chemically reactive and could be potentially used for further chemical functionalisation. Importantly, VFD processing favours more product homogeneity in the dynamic thin film in the microfluidic platform, with product quality independent of the sample volume passing from the VFD. Future experiments will investigate the possibility of tuning the intrinsic fluorescence by controlling the size of CDs which is crucial for red-shifting of the excitation wavelength.11 This could involve the use of a plasma VFD which is effective in changing the morphology of graphene.40 Various catalytic peroxidase enzyme such as HRP and lignin peroxidase might be applicable for accelerating the degradation of nanotubes in the presence of H2O2.24Experimental
MWCNTs (CAS 773840) with dimensions O.D. × I.D. × L equivalent to 10 nm ± 1 nm × 4.5 nm ± 0.5 nm × 3–6 μm were purchased from Sigma Aldrich, as chemical vapor deposition prepared material with an as-received purity ≥98%. 30% H2O2 was purchased from Chem-supply (HA 154-2). Magnesium sulphate and Molecular sieves, 4 Å were purchased from Sigma Aldrich. Sample preparation involved the addition of the MWCNTs (10 mg) into a glass beaker containing 100 mL 30% H2O2 (0.1 mg mL−1), followed by bath sonication (∼3 minutes) to afford a dispersion. The experimental setup mainly followed the previously published work for the VFD-mediated slicing of CNTs.22 The experiment was carried out in the continuous flow mode at a flow rate of 0.45 mL min−1. Stainless steel jet feeds were used to deliver the MWCNT suspension to the bottom of the rapidly rotating VFD borosilicate glass tube (O.D. 20 mm) inclined 45° relative to the horizontal position, as the so called title angle θ of the device. The tube was simultaneously irradiated using a 5 nanosecond pulsed Q-switch Nd:YAG laser operating at 1064 nm, with an 8 mm diameter laser beam and a repetition rate of 10 Hz (Fig. 1a). The laser beam was directed to the middle of the tube for an optimal processing outcome. To ensure a stable homogeneous dispersion of MWCNTs in the aqueous H2O2 during syringe pump delivery of the liquid to the rapidly rotating tube, an in-house designed magnetic-assisted mixing system was developed (Fig. 1c). The magnetic-assisted mixing during the delivery of the liquid to the VFD tube did not contribute to any length or morphological change of the MWCNTs (Fig. S1b†), but it did contribute to some oxidation/functionalisation of the sample.CDs were characterized using SEM, AFM (Nanoscope 8.10 tapping mode), Raman spectroscopy (WiTec Alpha 300R λexc = 532 nm and XploRA™ Horiba Scientific λexc = 532 nm), X-ray photoelectron spectroscopy (XPS – Kratos Axis Ultra, Thermo Scientific, UK, with Monochromatic Al Kα X-rays), XRD (Bruker D8 ADVANCE ECO, Co-Kα, λ = 1.78892 Å), infrared microscope (Nicolet™ iN™10, Thermal Scientific), UV-vis spectrophotometer (Varian Cary 50), fluorescence spectrometer (Cary Eclipse, Agilent), Thermo Lumina fluorescence spectrometer and TEM (FEI Tecnai F20 operated at 200 kV). The quantum yield was measured by comparing the integrated fluorescence and absorbance of the sample with anthracene in ethanol as a reference. Photoluminescence measurements were performed using Edinburgh Instruments F980 Spectrofluorimeter, with details of the UV diodes provided in Table S3.† All diodes had columnated beams apart from the 355 nm one, which was not directional and emitted light in a cone-shape. The CD sample was mounted on a glass slide and imaged with Olympus AX70 fluorescence microscope.
Conflicts of interest
There are no conflicts to declare.Acknowledgements
The authors gratefully acknowledge financial support from the Australian Research Council and the Government of South Australia, and the Australian Microscopy & Microanalysis Research Facility (AMMRF) and the Australian National Fabrication Facility (ANFF) for accessing microscopic facilities and the Edinburgh Instruments Spectrofluorimeter funded by ARC LIEF grant. The authors would also like to thank Dr. Chris Gibson, Mr. Yanting Yin, Dr. Muneer Syed Musthakahmed, Dr Georgios Tsiminis and Prof. Gregory A. Weiss for valuable discussions and help from Dr Jason Gascooke for some laser experiments, Ms Yvette DeGraaf for fluorescence microscopy, Ms Ashleigh Clapper for pH-responsive PL experiments and Dr. Faruq Ahmed on tissue culture studies.Notes and references
- K. Chua, Z. Sofer, P. Šimek, O. Jankovský, K. Klímová, S. Bakardjieva, Š. Hrdličková Kučková and M. Pumera, ACS Nano, 2015, 9, 2548–2555 CrossRef PubMed.
- Y. Wang and A. Hu, J. Mater. Chem. C, 2014, 2, 6921–6939 RSC.
- S. T. Yang, X. Wang, H. Wang, F. Lu, P. G. Luo, L. Cao, M. J. Meziani, J. H. Liu, Y. Liu, M. Chen, Y. Huang and Y. P. Sun, J. Phys. Chem. C, 2009, 113, 18110–18114 CAS.
- Q. Zeng, D. Shao, X. He, Z. Ren, W. Ji, C. Shan, S. Qu, J. Li, L. Chen and Q. Li, J. Mater. Chem. B, 2016, 4, 5119–5126 RSC.
- X. Li, M. Rui, J. Song, Z. Shen and H. Zeng, Adv. Funct. Mater., 2015, 25, 4929–4947 CrossRef CAS.
- X. Xu, R. Ray, Y. Gu, H. J. Ploehn, L. Gearheart, K. Raker and W. A. Scrivens, J. Am. Chem. Soc., 2004, 126, 12736–12737 CrossRef CAS PubMed.
- H. Peng and J. Travas-Sejdic, Chem. Mater., 2009, 21, 5563–5565 CrossRef CAS.
- L. Shen, L. Zhang, M. Chen, X. Chen and J. Wang, Carbon, 2013, 55, 343–349 CrossRef CAS.
- J. Deng, Q. Lu, N. Mi, H. Li, M. Liu, M. Xu, L. Tan, Q. Xie, Y. Zhang and S. Yao, Chem. – Eur. J., 2014, 20, 4993–4999 CrossRef CAS PubMed.
- Y. Suda, T. Ono, M. Akazawa, Y. Sakai, J. Tsujino and N. Homma, Thin Solid Films, 2002, 415, 15–20 CrossRef CAS.
- M. Buzaglo, M. Shtein and O. Regev, Chem. Mater., 2016, 28, 21–24 CrossRef CAS.
- Y. Yang, J. Cui, M. Zheng, C. Hu, S. Tan, Y. Xiao, Q. Yang and Y. Liu, Chem. Commun., 2012, 48, 380–382 RSC.
- X. Zhai, P. Zhang, C. Liu, T. Bai, W. Li, L. Dai and W. Liu, Chem. Commun., 2012, 48, 7955–7957 RSC.
- H. Gonçalves and J. C. G. Esteves da Silva, J. Fluoresc., 2010, 20, 1023–1028 CrossRef PubMed.
- V. Nguyen, L. Yan, J. Si and X. Hou, J. Appl. Phys., 2015, 117, 1–6 Search PubMed.
- D. Tan, S. Zhou, J. Qiu and N. Khusro, J. Photochem. Photobiol., C., 2013, 17, 50–68 CrossRef CAS.
- D. Reyes, M. Camacho, M. Camacho, M. Mayorga, D. Weathers, G. Salamo, Z. Wang and A. Neogi, Nanoscale Res. Lett., 2016, 11, 1–11 CrossRef CAS PubMed.
- Y. P. Sun, B. Zhou, Y. Lin, W. Wang, K. A. S. Fernando, P. Pathak, M. J. Meziani, B. A. Harruff, X. Wang, H. Wang, P. G. Luo, H. Yang, M. E. Kose, B. Chen, L. M. Veca and S. Y. Xie, J. Am. Chem. Soc., 2006, 128, 7756–7757 CrossRef CAS PubMed.
- S. Zhu, Y. Song, X. Zhao, J. Shao, J. Zhang and B. Yang, Nano Res., 2015, 8, 355–381 CrossRef CAS.
- K. Voitko, A. Tóth, E. Demianenko, G. Dobos, B. Berke, O. Bakalinska, A. Grebenyuk, E. Tombácz, V. Kuts, Y. Tarasenko, M. Kartel and K. László, J. Colloid Interface Sci., 2015, 437, 283–290 CrossRef CAS PubMed.
- Y. Wang, H. Shan, R. H. Hauge, M. Pasquali and R. E. Smalley, J. Phys. Chem. B, 2007, 111, 1249–1252 CrossRef CAS PubMed.
- R. Marega, G. Accorsi, M. Meneghetti, A. Parisini, M. Prato and D. Bonifazi, Carbon, 2009, 47, 675–682 CrossRef CAS.
- B. Czech, P. Oleszczuk and A. Wiącek, Environ. Pollut., 2015, 200, 161–167 CrossRef CAS PubMed.
- W. Xing, G. Lalwani, I. Rusakova and B. Sitharaman, Part. Part. Syst. Charact., 2014, 31, 745–750 CrossRef CAS.
- K. Vimalanathan, J. R. Gascooke, I. Suarez-Martinez, N. A. Marks, H. Kumari, C. J. Garvey, J. L. Atwood, W. D. Lawrance and C. L. Raston, Sci. Rep., 2016, 6, 22865 CrossRef CAS PubMed.
- X. Luo, P. Smith, C. L. Raston and W. Zhang, ACS Sustainable Chem. Eng., 2016, 4, 3905–3911 CrossRef CAS.
- X. Luo, A. H. M. Al-Antaki, S. Pye, R. Meech, W. Zhang and C. L. Raston, ChemPhotoChem DOI:10.1002/cptc.201700206.
- X. Chen, J. F. Dobson and C. L. Raston, Chem. Commun., 2012, 48, 3703–3705 RSC.
- K. Vimalanathan, X. Chen and C. L. Raston, Chem. Commun., 2014, 50, 11295–11298 RSC.
- M. Kashima-Tanaka, Y. Tsujimoto, K. Kawamoto, N. Senda, K. Ito and M. Yamazaki, J. Endod., 2003, 29, 141–143 CrossRef PubMed.
- A. E. Islam, S. S. Kim, R. Rao, Y. Ngo, J. Jiang, P. Nikolaev, R. Naik, R. Pachter, J. Boeckl and B. Maruyama, RSC Adv., 2016, 6, 42545–42553 RSC.
- C. Brolly, J. Parnell and S. Bowden, Planet. Space Sci., 2016, 121, 53–59 CrossRef CAS.
- E. Vahabzadeh and M. J. Torkamany, J. Cluster Sci., 2014, 25, 959–968 CrossRef CAS.
- J. Cheng, C.-F. Wang, Y. Zhang, S. Yang and S. Chen, RSC Adv., 2016, 6, 37189–37194 RSC.
- R. Thangaraj and A. S. Kumar, Anal. Methods, 2012, 4, 2162–2171 RSC.
- B. De and N. Karak, RSC Adv., 2013, 3, 8286–8290 RSC.
- L. Lin and S. Zhang, Chem. Commun., 2012, 48, 10177–10179 RSC.
- S. Wang, I. S. Cole, D. Zhao and Q. Li, Nanoscale, 2016, 8, 7449–7458 RSC.
- D. Jiang, Y. Chen, N. Li, W. Li, Z. Wang, J. Zhu, H. Zhang, B. Liu and S. Xu, PLoS One, 2016, 10, 1–15 Search PubMed.
- D. B. Jones, X. Chen, A. Sibley, J. S. Quinton, C. J. Shearer, C. T. Gibson and C. L. Raston, Chem. Commun., 2016, 52, 10755–10758 RSC.
Footnote |
| † Electronic supplementary information (ESI) available. See DOI: 10.1039/c7re00197e |
| This journal is © The Royal Society of Chemistry 2018 |

