 Open Access Article
Enhanced cycling performance of nanostructure LiFePO4/C composites with in situ 3D conductive networks for high power Li-ion batteries†
Chunsong Zhaoa,
Lu-Ning Wang*ab,
Jitao Chen*c and
Min Gaod
aBeijing Advanced Innovation Center for Materials Genome Engineering, School of Materials Science and Engineering, University of Science and Technology Beijing, Beijing 100083, China. E-mail: luning.wang@ustb.edu.cn; Tel: +86 10 62332609
bState Key Laboratory for Advanced Metals and Materials, Beijing 100083, China
cCollege of Chemistry and Molecular Engineering, Peking University, Beijing 100871, China. E-mail: chenjitao@pku.edu.cn
dChina Automotive Battery Research Institute Co., Ltd., Beijing 100088, China
First published on 14th December 2018
Abstract
In this work, reduced nano-sized LiFePO4 precursor particles were fabricated via a green chemistry approach without the use of any organic solvent or surfactants by accelerating the feeding speed of ferrous sulfate. After carbon coating, a 4 nm thick high graphitic degree carbon layer was deposited uniformly on the surface of reduced nano-sized LiFePO4 particles and constructed in situ 3D conductive networks among the adjacent LiFePO4 particles, as a result of an elevated self-catalytic effect of the reduced nano-size LiFePO4 particles that promoted the formation of the conductive networks. The reduced nano-size LiFePO4/C particles with in situ 3D conductive networks were shown to have an excellent high rate discharge capacity and long cycle life, delivering a high initial reversible discharge capacity of 163 mA h g−1 at 0.2C and an even high rate discharge capacity of 104 mA h g−1 at 30C. Additionally, a capacity of 101.7 mA h g−1 with a capacity retention of 97% remained after 850 cycles at 30C. This work suggests that the enhanced electrochemical performance of the LiFePO4/C composite was improved via the combination of the reduced nano-sized and 3D conductive networks, facilitating the electron transfer efficiency and diffusion of lithium ions, especially over an extended cycling performance at a high rate.
Introduction
Since the olivine-type LiMPO4 (M = Fe, Co, Mn, Ni) cathode materials family was successfully explored by Goodenough and co-workers,1 LiFePO4 has long been considered as a positive electrode material that can be employed as an ideal cathode material for energy storage, electric vehicles (EVs), hybrid EVs, plug-in hybrid EVs and so on, owing to its environmental friendliness, superior cycling lifetime and good thermal stability. Unfortunately, poor electronic conductivity and ionic conductivity2 seriously hinders its progress for use in practical applications in high performance lithium-ion batteries (LIBs).To overcome the aforementioned inherent issues of LiFePO4, a variety of approaches have been validated, such as surface coating,3–8 ionic doping,9–14 and size and morphology optimization,15–20 which greatly improved the electronic and ionic conductivity and enhanced its electrochemical performance. One of the conventional methods was used in combination with reduced primary particles and carbon coating to improve the ionic conductivity and electronic conductivity, respectively, for the fabrication of LiFePO4/C composites by solid-state, high-energy ball milling,21 hydrothermal, solvothermal or supercritical methods.22,23 However, high-energy ball milling is considered to be less cost-effective, with poor capability and particle morphology control. Zhang et al.24 investigated the effects of ball milling on the properties and electrochemical performance of LiFePO4/C composites and found that a grain size of c.a. ∼60 nm was obtained from ball milling in acetone with poor morphology and irregular second aggregations, but the composites were capable of delivering an excellent rate capacity of 122 mA h g−1 at 10C. As for the hydrothermal (solvothermal) method, besides its high cost facilities, the potential safety risks and harsh operation conditions present problems for its large-scale industrialization. Moreover, the organic solvents used in the filtration process present difficulties and the by-products are hard to recycle, resulting in additional costs for large-scale fabrication, and the chemical oxygen demand (COD) value of the filtrate would be raised due to the use of surfactants.25 Meanwhile, the introduction of conductive carbon on the surface of LiFePO4 particles through the pyrolysis of solid organic compounds,26–29 gas phase organic precursors30,31 and inorganic conductive carbon,32 significantly accelerates electron migration and improves the electronic conductivity of the material, consequently resulting in an improvement in the reversible insertion and extraction of Li ions and contributes to the high discharge capacity and excellent rate performance of the LiFePO4/C composites. Chen et al.33 reported a strategy to develop excellent kinetics for Li ion insertion and extraction and low cell impedance for LiFePO4 through a carbon coating treatment, hence contributing to an improvement in its high rate capacity. Besides this, the degree of graphitization of the carbon layer on the surface of LiFePO4 particles also has a major effect on the electrochemical performance of the LiFePO4/C composites.34 The degree of graphitized carbon can be generally measured from a Raman spectrum and the ID/IG (disorder/graphite) is closely related to the electronic conductivity of carbon materials.35,36 As such, a substantial amount of graphitized carbon is essential for the high electronic conductivity of LiFePO4/C composites to promotes the electrode reaction kinetics and enhance the rate performance of the LiFePO4/C cathode material. Nien et al.37 evaluated the electrochemical performance of LiFePO4 composites with different polymer-containing precursors and a better electrochemical performance was observed in the case of a low ID/IG value. In order to obtain a high ID/IG value for the carbon layer, much attention has been paid to the selection of carbon source precursors,38 graphitization catalysts,39–41 carbon preparation method30,42 and highly graphitic carbon materials43–45 mixture. Tian et al.46 fabricated a LiFePO4/C composite with a 2–5 nm graphitized carbon thickness by employing a controllable chemical vapor deposition (CVD) approach assisted solid-state route using glucose as a carbon source, which delivered a discharge capacity and voltage of 89.69 mA h g−1 and 3.030 V at 200C, respectively. Besides its intrinsic nature, the conductive network also plays a vital role in achieving a continuous electron migration path between adjacent particles and improving the electrical conductivity of LiFePO4/C composites. Such a continuous conductive network favors the diffusion of lithium ions during insertion and extraction, which can be realized by adding inorganic conductive carbon,43 in situ generated47,48 or through polymer pyrolysis.49–52 Xu et al. 53 constructed an innermost network by in situ polymerization of a polyacrylic acid (PAA) layer, adding acetylene black as the second conductive network, and the obtained composites exhibited prominent rate performance and outstanding cycling stability. Although a large number of studies have focused on generating graphitized carbon or conductive networks by introducing catalysts or altering the carbon sources and carbon preparation methods, to date, few studies have focused on the relationships between the graphitized carbon, carbon conductive network and the self-catalytic effects of nano-sized LiFePO4 particles.
Recently, we reported a precipitation approach towards the synthesis of high-performance LiFePO4/C without the need using a hydrothermal (solvothermal) method,54 the advantages of which are the ability to recycle the filtrate and the zero emission by-products. In this study, nanoscale LiFePO4 particles with a controllable size were successfully precipitated by regulating the feeding rate of a FeSO4 solution without adding any organic solutions or surfactants. Special attention was given to the temperature of the stainless steel reactor, by slightly raising it up to 105 °C from 100 °C to prevent a rapid increase in the viscosity of the slurry as a result of the elevated feeding rate. A uniform carbon coating layer with high quality graphitization was used to cover the surface of LiFePO4 particles with cross-linked conductive carbon between the adjacent LiFePO4 particles to further improve the electron transport and promote the discharge capacity, rate performance, and capacity retention for long cycle life.
Experimental
Preparation of the cathode materials
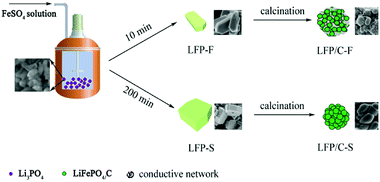
The details of the fabrication of the precursors were reported in our previous work.54 Iron(II) sulfate heptahydrate (FeSO4·7H2O, Sinopharm, AR), lithium hydroxide monohydrate (LiOH·H2O, Sinopharm, AR), phosphoric acid (H3PO4 (85%), Sinopharm, AR) and deionized water were used in the experiments. In a typical synthesis, 37.8 g of LiOH·H2O was dissolved in 1.5 L of deionized water and 34.6 g of H3PO4 solution was slowly added into the LiOH solution and stirred in a 3 L stainless steel reactor at 55 °C to prepare a Li3PO4 suspension. After vigorous stirring for 30 min, 10 g of H3PO4 in 100 mL of deionized water was added, and the temperature of the reactor was raised to 105 °C under 20 Pa and the linear velocity of the agitator was set to around 10 m s−1 in order to ensure the slurry to be evenly dispersed during the FeSO4 solution addition. Then, 500 mL of deionized water containing 69.5 g of FeSO4·7H2O was pumped into the boiling Li3PO4 suspension over 10 min. The reactor was heated at 105 °C for 5 h, then allowed to naturally cool to room temperature. The resulting product was filtered and washed several times with deionized water and ethanol. Finally, a gray powder was obtained after drying at 80 °C for 12 h in a vacuum oven. The LiFePO4 precursor was labelled as LFP-F. In order to evaluate the effect of different feeding rates of FeSO4 solution on the size and morphology of the LiFePO4 precursor, 200 min of FeSO4 solution feeding was also adopted and the obtained powder was labelled as LFP-S. To synthesize LiFePO4/C, LFP-F and LFP-S were mixed with 7 wt% starch, spray dried and sintered at 700 °C for 8 h under a N2 atmosphere. The LiFePO4/C composite was obtained and labelled as either LFP/C-F and LFP/C-S. The synthetic process of the LiFePO4 precursor and LiFePO4/C composites is shown in Fig. 1.Materials characterization
Powder X-ray diffraction (PXRD) analysis of the powdered samples was performed using a Bruker D8-Advantage powder diffractometer with Cu Kα radiation (λ = 1.5405 Å, 45 kV, 50 mA) between 10° and 80° in reflection geometry mode. The morphology and microstructure of the samples were characterized using a scanning electron microscope (SEM, Sigma 300, ZEISS) equipped with an energy dispersive spectrometer (EDS, Oxford). The carbon coating layer was characterized using a high-resolution transmission electron microscope (HRTEM, JEOL JEM-2010). The carbon layer on the surface of LiFePO4/C was characterized using a Raman spectrometer (Thermo Fisher Scientific, Nicolet Almega XR) and an argon ion laser operating at 632.8 nm. The carbon content of LiFePO4/C was determined using a high-frequency infrared carbon–sulfur analyzer (HCS-800B). The specific surface area was measured by a nitrogen adsorption method using a Brunauer–Emmett–Teller (BET) analyzer (3H-2000PSA2, BeiShiDe Instruments, China). The electronic conductivity of LiFePO4/C composites was measured using a multifunction digital four-probe tester (Suzhou Jingge Electronic Co., Ltd) under 2 MPa.Electrochemical characterization
The electrochemical performance of the LiFePO4/C materials was measured in CR2032 half coin cells with the LiFePO4/C composites and lithium used as the cathode electrode and counter electrode, respectively. The cathode electrode was fabricated using a mixed slurry of 80 wt% active materials, 10 wt% acetylene black and 10 wt% polyvinylidene fluoride (PVDF) in N-methyl pyrrolidone (NMP). Then, the slurry was pasted onto aluminum foil and dried under vacuum at 120 °C for 12 h. The loading of the active materials on the electrode film was kept at around 4.3 mg cm−2, and the electrode film was cut into a circular disc with a diameter of 12 mm. The electrolyte was blended with ethylene carbonate (EC)–dimethyl carbonate (DMC)–ethylmethyl carbonate (EMC) (1/1/1 in volume ratio) dissolved in 1 M LiPF6. Lithium metal plates served as the anode electrodes and Celgard 2400 microporous membrane as the separator. The coin cells were assembled in an argon-filled glove box. Galvanostatic charge–discharge tests were conducted with a Land CT2001 battery tester (Wuhan Land Electronic Co. Ltd., China). Cyclic voltammetry (CV) measurements and electrochemical impedance spectra (EIS) were collected using an electrochemical workstation (CHI 660E). The CV measurements were carried out with different scanning rates at 0.2 mV s−1 between 2.0–4.0 V. The EIS measurements were performed over a frequency range of 100 kHz to 10 mHz with an applied amplitude of 5 mV.Results and discussion
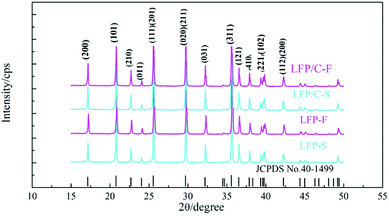
Fig. 2 shows the PXRD patterns of the LiFePO4 precursors and as-synthesized LiFePO4/C composites. It is clear that all of the samples are of the LiFePO4 phase with a typical olivine structure indexed by orthorhombic Pnma, according to the standard PDF card (JCPDS No. 40-1499), and no impurity phase was detected. The parameters of the lattice parameters and cell volumes of the LiFePO4/C composites were calculated and are shown in Table 1. It can be seen that there are no significant differences between the lattice parameters of the LiFePO4/C composites except that the cell volume of LFP/C-F is slightly smaller.| Sample | a (nm) | b (nm) | c (nm) | V (nm3) | D[020] (nm) |
|---|---|---|---|---|---|
| LFP/C-F | 1.033 | 0.6008 | 0.4695 | 0.2914 | 61.8 |
| LFP/C-S | 1.034 | 0.6009 | 0.4700 | 0.2920 | 72.5 |
The crystal sizes of LFP/C-F and LFP/C-S were also calculated using Scherrer's equation (D = kλ/β![[thin space (1/6-em)]](https://www.rsc.org/images/entities/char_2009.gif) cos
cos![[thin space (1/6-em)]](https://www.rsc.org/images/entities/char_2009.gif) θ) in view of the full widths at half maximum (FWHM) of the diffraction peaks [020].55 It is clear that the crystallite size of LFP/C-F is 61.8 nm, which is smaller than LFP/C-S at 72.5 nm. The decrease in the grain size has the effect of shortening the migration path and increasing the diffusion coefficient for Li ion transport, thus enhancing the electrochemical performance.
θ) in view of the full widths at half maximum (FWHM) of the diffraction peaks [020].55 It is clear that the crystallite size of LFP/C-F is 61.8 nm, which is smaller than LFP/C-S at 72.5 nm. The decrease in the grain size has the effect of shortening the migration path and increasing the diffusion coefficient for Li ion transport, thus enhancing the electrochemical performance.
The morphologies and particle sizes of the LiFePO4 precursors and LiFePO4/C composites were characterized by SEM, HRTEM and elemental mapping was performed using EDS. As can be seen from the SEM images in Fig. 3a, it is worth noting that the LFP-F micron-sized agglomerated structure grows up to 100 nm in length, with less than 50 nm in width and thickness nanoplates, while that of LFP-S is around 150–200 nm in length and width and 50–100 nm in thickness, as shown in Fig. S1a,† the results of which are due to the nucleation process. According to the crystal nucleation process, a higher reaction concentration generally leads to smaller crystal nucleation. Thus, 50–100 nm of LFP-F precursor was evidently fabricated by shortening the addition time of the FeSO4 solution to 10 min than that of the 150–200 nm of LFP-S precursor at 200 min. Moreover, the smaller ratio of length to width of the LFP-S precursor may be due to the extended reaction process assisted with a modicum of pressure. The LFP/C-F composite presents a second spherical aggregation of 5–10 μm (inset in Fig. 3b) and has c.a. ∼100 nm diameter spherical nano-size particles, caused by volume shrinkage during heat treatment, with a uniform distribution, as shown in Fig. 3b, while the LFP/C-S composite has c.a. ∼200 nm diameter primary particles with 5–10 μm secondary spherical aggregation, as shown in Fig. S1b.† Moreover, in situ grown carbon film frameworks can be seen clearly connecting and entwining the adjacent LFP/C-F particles to form an effective electronic transmission path, which is almost invisible in the LFP/C-S composite. HRTEM images were also acquired to further study the microstructure of the LiFePO4/C composites. The carbon conductive network was obviously observed, as shown in Fig. 3c, with 100 nm nanoparticles and a 4 nm carbon layer was evenly coated on the surface of the LFP/C-F composite, as shown in Fig. 3d. However, few similar conductive networks surround the LFP/C-S particles seen in Fig. S1c† and the thickness of the carbon layer is less than 3 nm on the surface of the LFP/C-S composite shown in Fig. S1d.† The corresponding Fourier filtered transform (FFT) (inset in Fig. 3d) for LFP/C-F exhibits regular spots and further confirms that the LiFePO4 nanoparticles are indeed in a pure crystalline phase.7 Finally, the elemental mapping results also showed uniform atomic distribution (Fe, P, O and C) for LFP/C-F. According to the BET analysis, the total specific surface areas of the LiFePO4 composites were 24.52 m2 g−1 and 17.35 m2 g−1 for LFP/C-F and LFP/C-S, measured from the nitrogen adsorption–desorption isotherms shown in Fig. 4, respectively. The corresponding Barrett–Joyner–Halenda (BJH) pore size distribution curves of the LiFePO4/C composites were also characterized (inset in Fig. 4), and exhibit an average pore diameter of 4.6 nm for the LFP/C-F composite and 3.8 nm for the LFP/C-S, respectively, indicating a similar mesoporous structure for both LiFePO4 composites. Additionally, the carbon content of the LFP/C-F composite was also measured at 2.36 wt%, which is higher than that of the LFP/C-S composite that was measured at a value of 1.94 wt% under the same conditions. The difference in the carbon content may be due to the elevated catalytic effects56 of the various sized LiFePO4 precursors, resulting in an elevated carbon concentration being generated on the particle surfaces. Thus, the reason for the higher specific surface area of the LFP/C-F composite is due to a higher carbon content, which is favorable for achieving close contact between electrolytes, shortening the lithium ion diffusion path and exhibiting an excellent rate and cycling performance.57
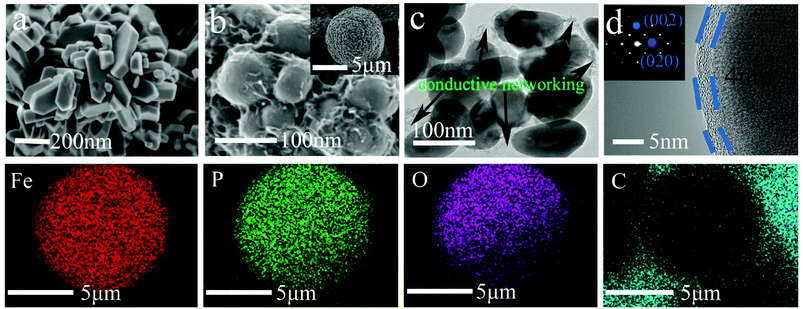 | ||
| Fig. 3 SEM images of (a) LFP-F and (b) LFP/C-F, TEM images of (c and d) LFP/C-F, and EDS mapping of the Fe, O, P, C elements in the LFP/C-F composite. | ||
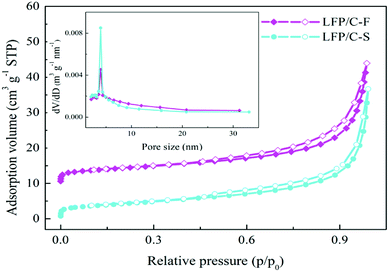 | ||
| Fig. 4 Nitrogen adsorption/desorption isotherms of the as-prepared LFP/C-F and LFP/C-S composites (inset: pore diameter distribution curves). | ||
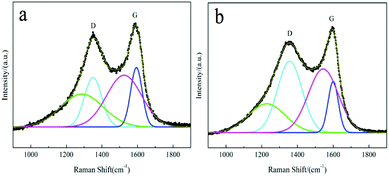
It is well known that the degree of graphitization of the surface carbon layer has a significant impact on the electrochemical performance of LiFePO4/C materials.58 Raman spectroscopy is a common method that can be used to characterize the quality of the carbon layer. Two intense broad bands located at around 1355 cm−1 and 1597 cm−1 represent the D and G bands59 of the residual carbon of the LFP/C-F and LFP/C-S composites, respectively, as shown in Fig. 5a and b. In order to analyze the properties of the surface coated carbon, the experimental spectra were fitted using a combination of four Gaussian–Lorentzian bands. The parameters of the band positions, the FWHM and intensities were also refined and are outlined in Table 2. The D (cyan line) and G (blue line) bands are closely related to the structural and physical properties of the carbon. The other bands at around 1250 cm−1 (green line) and 1535 cm−1 (magenta line) can be attributed to poorly organized carbon materials and defects outside the planes of the aromatic layers.34,35 The value of the intensity ratio R(λL) = ID/IG is associated with the nature of the carbon phase.59 In particular, a graphitic material R(λL) is related to the in-plane correlation length La through a modified Tuinstra–Koenig relationship La = C(λL)/R(λL), which quantifies the mean basal-plane diameter of graphite parallel to (001) associated with the conductivity. C(λL) is a variable scaling coefficient correlated to the excitation wavelength (λL is 632.8 nm here), and given by C(λL) = C0 + (λL)C1 (ref. 60) with C0 = −12.6 nm and C1 = 0.033. Thus, the value of La was 6.41 nm and 2.42 nm for the LFP/C-F and LFP/C-S composites, respectively. It is obvious that the surface carbon layer of the LFP/C-F electrode is more orderly and more graphitized than that of the LFP/C-S electrode, the result of which is consistent with the carbon structure shown in the TEM morphology. As a consequence, the surface carbon of the LFP/C-F composite has a reasonably higher electronic conductivity than that of the LFP/C-S composite, which would be expected to contribute towards the excellent rate and cycling performance of the LFP/C-F composite.
| Samples | Parameters | Values | |
|---|---|---|---|
| LFP/C-F | Band position (cm−1) | D | 1350 |
| G | 1594.1 | ||
| FWHF (cm−1) | D | 97.9 | |
| G | 64.8 | ||
| Intensity (a.u.) | D | 166![[thin space (1/6-em)]](https://www.rsc.org/images/entities/char_2009.gif) 764.2 764.2 |
|
| G | 132![[thin space (1/6-em)]](https://www.rsc.org/images/entities/char_2009.gif) 297.2 297.2 |
||
| ID/IG | 1.3 | ||
| La | 6.41 | ||
| LFP/C-S | Band position (cm−1) | D | 1357.1 |
| G | 1600.5 | ||
| FWHF (cm−1) | D | 137.9 | |
| G | 57.1 | ||
| Intensity (a.u.) | D | 595![[thin space (1/6-em)]](https://www.rsc.org/images/entities/char_2009.gif) 229.5 229.5 |
|
| G | 176![[thin space (1/6-em)]](https://www.rsc.org/images/entities/char_2009.gif) 685.2 685.2 |
||
| ID/IG | 3.4 | ||
| La | 2.42 |
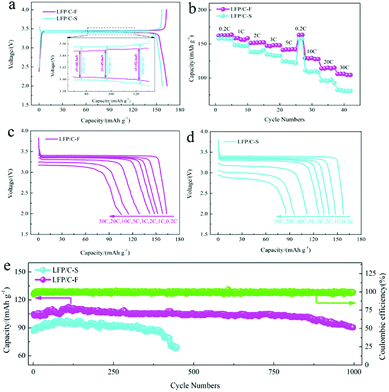
The electrochemical performance of the LiFePO4/C cathode materials was evaluated and compared at different current rates from 0.2C to 30C between 2.0 and 4.0 V at 25 °C. Fig. 6a shows the charge and discharge profiles at 0.2C, which is consistent with a two-phase transformation reaction between FePO4 and LiFePO4. The initial discharge capacity of the LFP/C-F electrode was 163 mA h g−1, while that of the LFP/C-S electrode was slightly lower at 158 mA h g−1, resulting from the better reversible performance for Li ion insertion and extraction. The gap between the charge and discharge curves is also presented (inset in Fig. 6a). The mean value of the potential interval (ΔE) of the LFP/C-F composite is 47.4 mV, which is obviously smaller than that at 61.1 mV of the LFP/C-S electrode, suggesting the weaker polarization and more excellent kinetic performance.61 The rate discharge capacity was evaluated and is compared in Fig. 6b. The discharge specific capacity of the LFP/C-F electrode decreased from 163 mA h g−1 to 104 mA h g−1 with an increase in the current rate from 0.2C to 30C, while the discharge specific capacity of the LFP/C-S electrode only delivered 157 mA h g−1 and 81 mA h g−1 under the same test conditions. Besides this, the charge and discharge curves at different rates at current densities from 0.2C to 30C were evaluated for the LiFePO4/C electrodes and the results are shown in Fig. 6c and d. The discharge voltage plateau and capacity gradually decreased upon an increase in the current rates, resulting into electrochemical polarization. However, the relatively low degree of polarization of the LFP/C-F electrode demonstrated the improved kinetics owing to the reduction in particles and higher quality of the coated carbon. Fig. 6e shows the cycling performance of the LiFePO4/C electrodes. The cycling measurements were carried out at room temperature between 2.0 V and 4.0 V at a rate of 30C. It is obvious that the LFP/C-F electrode delivers a high capacity of 101.7 mA h g−1 with a capacity retention of 97% after 850 cycles. In contrast, the LFP/C-S electrode presents an initial capacity of 85 mA h g−1 at a rate of 30C. The capacity of the LFP/C-S electrode deteriorated seriously during the cycles and only 50 mA h g−1 was retained after 450 cycles. Besides this, the capacity increased over the initial few cycles for both the LFP/C-F and LFP/C-S electrodes, which can be mainly attributed to a gradual increase in the interfacial contact area of the LiFePO4/C electrodes for the electrochemical reaction resulting from the gradual penetration of electrolyte into the interior of the particles, as described in previous literature.62–64 In other words, the LFP/C-F electrode exhibits more outstanding discharge capacity, rate performance, and cycling performance at a high rate than that of the LFP/C-S electrode, which can be attributed to its reduced particle size and shorter transport path for lithium-ion diffusion through the lattice. Moreover, the combination of the high-quality carbon layer and cross-linked carbon network led to an increase in the conductive interconnection among the adjacent LiFePO4/C particles to form more conductive paths for electrons, which improved the electron transfer efficiency and led to an improvement in the electrochemical performance.
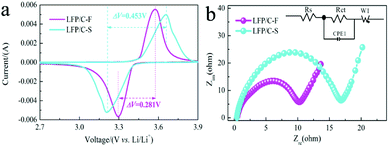
Fig. 7a shows the CV profiles of LiFePO4/C composites at a scan rate of 0.2 mV s−1 in the voltage range of 2.0–4.0 V vs. Li/Li+. It can be seen that the cathodic and anodic peak positions of LFP/C-F and LFP/C-S are located at around 3.572 V, 3.654 V and 3.29 V, 3.206 V, respectively, and can be attributed to a Fe3+/Fe2+ redox couple. The potential difference (ΔE) between the anodic and cathodic peaks is a key parameter that can be used to examine the reversibility of Li ion insertion and extraction.65 It is clear that the ΔE value for the LFP/C-F electrode is 0.281 V, which is lower than that of the LFP/C-S electrode at 0.453 V, leading to good reversibility, less polarization and improved kinetics, the results of which are in good agreement with what is shown in the charge and discharge curves. This can be attributed to its reduced particle size and high degree of graphitized carbon on the surface of the LFP/C-F particles with a conductive network between the LFP/C-F particles.
EIS is also an effective method that was used to further evaluate the kinetic reaction of the electrochemical behavior of the LiFePO4/C composites. Fig. 7b shows the Nyquist plots and simulated equivalent circuit, both of which comprise a depressed semicircle at medium frequency and a sloped line at low frequency. The depressed semicircle in the middle frequency region is referred to as the charge transfer resistance (Rct) at the electrolyte/electrode interface and the sloped line in the low frequency region corresponding to the Warburg impedance (Zw) is related to the diffusion in the bulk of the LiFePO4/C composites.66 The charge transfer resistance of 10.2 Ω for the LFP/C-F electrode was much lower than that of 16.7 Ω for the LFP/C-S electrode, fitted by the given equivalent circuit (inset in Fig. 7b), illustrating the improved charge transfer kinetics and electronic conductivity due to the higher quality of the carbon layer on the surface of the LiFePO4 particles and compact conductive networks between the LiFePO4 particles. The electronic conductivities of LFP/C-F and LFP/C-S were 8.42 × 10⁻¹ and 2.9 × 10⁻² S cm−1, respectively. The results of the EIS indicate that the LFP/C-F electrode has a smaller cell impedance than that of the LFP/C-S electrode, which is consistent with the Rct results. Additionally, the diffusion coefficients (DLi) for the LiFePO4/C composites from the EIS tests can be generally evaluated according to eqn (1):66
| DLi = R2T2/2A2n2F4C02σ2 | (1) |
![[thin space (1/6-em)]](https://www.rsc.org/images/entities/char_2009.gif) 485C mol−1), C0 is the molar concentration of lithium ions in LiFePO4 (1.1 × 10⁻² mol cm−3 here), and σ is the Warburg factor associated with Zre, calculated using eqn (2):66
485C mol−1), C0 is the molar concentration of lithium ions in LiFePO4 (1.1 × 10⁻² mol cm−3 here), and σ is the Warburg factor associated with Zre, calculated using eqn (2):66| Zre = K + σω−1/2 | (2) |
The Warburg factor can be obtained from the slope between Zre and ω−1/2 (see Fig. S2†). It can be found from the EIS spectrum that the slope value of the LFP/C-F electrode is less than that of the LFP/C-S electrode, illustrating that the ionic diffusion of the LFP/C-F electrode is more beneficial. The DLi values were calculated to be 6.06 × 10⁻¹³ and 2.13 × 10⁻¹³ cm2 s−1 for the LFP/C-F and LFP/C-S electrodes, respectively. Therefore, the LFP/C-F electrode exhibits better kinetic behavior, consistent with the above electrochemical performance.
Conclusions
In this work, LiFePO4 particles with a controllable size were successfully synthesized without the use of any surfactants. The reaction temperature was raised up to 105 °C under 20 Pa pressure in a stainless steel reactor to prevent a soaring in the temperature that would deteriorate the reaction rate. It was found that the size of the LiFePO4 precursor was obviously reduced via an increase in the feeding rate of the FeSO4 solution. An elevated self-catalytic effect of nano-sized LiFePO4 particles was observed by SEM, HRTEM and Raman spectroscopy, not only facilitating the formation of a higher quality carbon layer on the surface of the LiFePO4 particles, but also a continuous carbon conductive network was constructed between the LiFePO4 particles after carbon coating. Beneficially, an initial discharge capacity of the prepared LFP/C-F composite of 163 mA h g−1 can be achieved at 0.2C and an even higher rate discharge capacity of 104 mA h g−1 at 30C. Moreover, LFP/C-F retains a discharge capacity of 101.7 mA h g−1 after 850 cycles at 30C with a capacity retention of 97%. Therefore, the facile size control strategy presented in this study may be a green and effective way to enhance the electron and ion conductivity of LiFePO4 to obtain a high rate and cycling performance.Conflicts of interest
There are no conflicts to declare.Acknowledgements
This work was supported by the National Basic Research of China (Grant No. 2015CB932500), the NSF of China (Grant No. 51302141), the National Key Research and Development Program of China (Grant No. 2016YFB0700604) and the Program of the National Natural Science Foundation of China (Grant No. 21673008).References
- A. K. Padhi, K. S. Nanjundaswamy and J. B. Goodenough, J. Electrochem. Soc., 1997, 149, 1188 CrossRef.
- J. Maier, Nature, 2005, 4, 805 CrossRef CAS.
- Z. X. Chi, W. Zhang, F. Q. Cheng, J. T. Chen, A. M. Cao and L. J. Wan, RSC Adv., 2014, 4, 7795 RSC.
- E. Avci, M. Mazman and D. Uzun, J. Power Sources, 2013, 240, 328 CrossRef CAS.
- P. P. Zhu, Z. Y. Yang, P. Zeng, J. Zhong, J. Yu and J. X. Cai, RCS Adv., 2015, 5, 107293 CAS.
- L. Dimesso, C. Spanheimer, S. Jacke and W. Jaegermann, J. Power Sources, 2011, 196, 6729 CrossRef CAS.
- C. S. Zhao, L. N. Wang, H. Wu, J. T. Chen and M. Gao, Mater. Res. Bull., 2018, 97, 195 CrossRef CAS.
- J. J. Wang, J. L. Yang, Y. Zhang, Y. L. Li, G. X. Liang, R. Y. Li and X. L. Sun, Adv. Funct. Mater., 2012, 23, 806 CrossRef.
- S. Y. Chung and Y. M. Chiang, Nat. Mater., 2002, 1, 123 CrossRef CAS PubMed.
- J. M. Yang, Y. Bai, C. B. Qing and W. F. Zhang, J. Alloys Compd., 2011, 509, 9010 CrossRef CAS.
- F. Lu, Y. C. Zhou, J. Liu and Y. Pan, Electrochim. Acta, 2011, 56, 8833 CrossRef CAS.
- H. Liu, Q. Cao, L. J. Fu, C. Li, Y. P. Wu and H. Q. Wu, Electrochem. Commun., 2006, 8, 1553 CrossRef CAS.
- Z. H. Wang, L. X. Yuan, J. Ma, L. L. Zhang and Y. H. Huang, Electrochim. Acta, 2012, 62, 416 CrossRef CAS.
- Y. C. Ge, X. D. Yan, J. Liu, X. F. Zhang, J. W. Wang, X. G. He, R. S. Wang and H. M. Xie, Electrochim. Acta, 2010, 55, 5886 CrossRef CAS.
- X. Q. Ou, H. C. Gu, Y. C. Wu, J. W. Lu and Y. J. Zheng, Electrochim. Acta, 2013, 96, 230 CrossRef CAS.
- A. V. Murugan, T. Muraliganth and A. Manthiram, J. Phys. Chem. C, 2008, 112, 14665 CrossRef CAS.
- Y. Y. Liu, J. J. Gu, J. L. Zhang, F. Yu, J. Wang, N. Nie and W. Li, RSC Adv., 2015, 5, 9745 RSC.
- H. B. Liu, C. Miao, Y. Meng, Y. B. He, Q. Xu, X. H. Zhang and Z. Y. Tang, Electrochim. Acta, 2014, 130, 322 CrossRef CAS.
- Y. Zhang, W. Wang, P. Li, Y. Fu and X. Ma, J. Power Sources, 2012, 210, 47 CrossRef CAS.
- N. Recham, L. Dupont and M. Courty, Chem. Mater., 2009, 21, 1096 CrossRef CAS.
- J. G. Tu, K. Wu, H. Tang, H. H. Zhou and S. Q. Jiao, J. Mater. Chem. A, 2017, 5, 17021 RSC.
- J. F. Qian, M. Zhou, Y. L. Cao, X. P. Ai and H. X. Yang, J. Phys. Chem. C, 2010, 114, 3477 CrossRef CAS.
- S. A. Hong, S. J. Kim, J. Kim, K. Y. Chung, B. W. Cho and J. W. Kang, Res. Chem. Intermed., 2011, 37, 429 CrossRef CAS.
- D. Zhang, R. Cai, Y. K. Zhou, Z. P. Shao, X. Z. Liao and Z. F. Ma, Electrochim. Acta, 2010, 55, 2653 CrossRef CAS.
- B. Pei, H. Yao, W. Zhang and Z. Yang, J. Power Sources, 2012, 220, 317 CrossRef CAS.
- H. Huang, S. C. Yin and L. F. Nazar, Electrochem. Solid-State Lett., 2001, 4, A170 CrossRef CAS.
- H. Gabrisch, J. D. Wilcox and M. M. Doeff, Solid-State Lett., 2006, 9, A360 CrossRef CAS.
- Y. Lin, M. X. Gao, D. Zhu, Y. F. Liu and H. G. Pan, J. Power Sources, 2008, 184, 444 CrossRef CAS.
- R. Dominko, M. Bele, M. Gaberscek, M. Remskar, D. Hanzel, S. Pejovnik and J. Jamnik, J. Electrochem. Soc., 2005, 152, A607 CrossRef CAS.
- W. L. Shang, L. Y. Kong and X. W. Ji, Solid State Sci., 2014, 38, 79 CrossRef CAS.
- K. Amine, J. Liu and I. Belharouak, Electrochem. Commun., 2005, 7, 669 CrossRef CAS.
- K. Zaghib, J. Shim, A. Guerfi, P. Charest and K. A. Striebel, Electrochem. Solid-State Lett., 2005, 8, A207 CrossRef CAS.
- J. M. Chen, C. H. Hsu, Y. R. Lin, M. H. Hsiao and G. T. K. Fey, J. Power Sources, 2008, 184, 498 CrossRef CAS.
- Y. Q. Hu, M. M. Doeff, R. Kostecki and R. Finones, J. Electrochem. Soc., 2004, 151, A1279 CrossRef CAS.
- M. M. Doeff, Y. Q. Hu, F. McLarnon and R. Kostecki, Electrochem. Solid-State Lett., 2003, 6, A207 CrossRef CAS.
- J. D. Wilcox, M. M. Doeff, M. Marcinek and R. Kostecki, J. Electrochem. Soc., 2007, 154, A389 CrossRef CAS.
- Y. H. Nien, J. R. Carey and J. S. Chen, J. Power Sources, 2009, 193, 822 CrossRef CAS.
- J. K. Kim, J. W. Choi, G. S. Chauhan, J. H. Ahn, G. C. Hwang, J. B. Choi and H. J. Ahn, Electrochim. Acta, 2008, 53, 8258 CrossRef CAS.
- T. Nakamura, Y. Miwa, M. Tabuchi and Y. Yamada, J. Electrochem. Soc., 2006, 153, A1108 CrossRef CAS.
- C. W. Ong, Y. K. Lin and J. S. Chen, J. Electrochem. Soc., 2007, 154, A527 CrossRef CAS.
- X. H. Yang, Y. Y. Mi, W. D. Zhang, B. R. Wu and H. H. Zhou, J. Power Sources, 2015, 275, 823 CrossRef CAS.
- B. Zhao, Y. Jiang, H. Zhang, H. Tao, M. Zhong and Z. Jiao, J. Power Sources, 2009, 189, 462 CrossRef CAS.
- W. Liu, P. Gao, Y. Y. Mi, J. T. Chen, H. H. Zhou and X. X. Zhang, J. Mater. Chem. A, 2013, 1, 2411 RSC.
- F. Y. Su, C. You, Y. B. He, W. Lv, W. Cui, F. Jin, B. Li, Q. H. Yang and F. Y. Kang, J. Mater. Chem., 2010, 20, 9644 RSC.
- M. S. Bhuvaneswari, N. N. Bramnik, D. Ensling, H. Ehrenberg and W. Jaegermann, J. Power Sources, 2008, 180, 553 CrossRef CAS.
- R. Y. Tian, H. Q. Liu, Y. Jiang, J. K. Chen, X. H. Tan, G. Y. Liu, L. N. Zhang, X. H. Gu, Y. J. Guo, H. F. Wang, L. F. Sun and W. G. Chu, ACS Appl. Mater. Interfaces, 2015, 7, 11377 CrossRef CAS PubMed.
- J. L. Yang, J. J. Wang, Y. J. Tang, D. N. Wang, B. W. Xiao, X. F. Li, R. Y. Li, G. X. Liang, T. K. Sham and X. L. Sun, J. Mater. Chem. A, 2013, 1, 7306 RSC.
- C. Y. Wu, G. S. Cao, H. M. Yu, J. Xie and X. B. Zhao, J. Phys. Chem. C, 2011, 115, 23090 CrossRef CAS.
- Y. Y. Xing, Y. B. He, B. H. Li, X. D. Chu, H. Z. Chen, J. Ma, H. D. Du and F. Y. Kang, Electrochim. Acta, 2013, 109, 512 CrossRef CAS.
- W. J. Ren, K. Wang, J. L. Yang, R. Tan, J. T. Hu, H. Guo, Y. D. Duan, J. X. Zheng, Y. Lin and F. Pan, J. Power Sources, 2016, 331, 232 CrossRef CAS.
- B. S. Lalia, T. Shah and R. Hashaikeh, J. Power Sources, 2015, 278, 314 CrossRef CAS.
- Y. F. Tang, F. Q. Huang, H. Bi, Z. Q. Liu and D. Y. Wan, J. Power Sources, 2012, 203, 130 CrossRef CAS.
- D. W. Xu, X. D. Chu, Y. B. He, Z. J. Ding, B. H. Li, W. J. Han, H. D. Du and F. Y. Kang, Electrochim. Acta, 2015, 152, 398 CrossRef CAS.
- C. S. Zhao, L. N. Wang, J. T. Chen and M. Gao, Electrochim. Acta, 2017, 255, 266 CrossRef CAS.
- Y. Y. Liu, J. J. Gu, J. L. Zhang, J. Wang, N. Nie, Y. Fu, W. Li and F. Yu, Electrochim. Acta, 2015, 173, 448 CrossRef CAS.
- J. J. Wang, J. L. Yang, Y. J. Tang, J. Liu, Y. Zhang, G. X. Liang, M. Gauthier, X. F. Li, R. Y. Li, J. Wang, T. K. Sham and X. L. Sun, Nat. Commun., 2014, 5, 3415 CrossRef PubMed.
- J. L. Yang, J. J. Wang, D. N. Wang, X. F. Li, D. S. Geng, G. X. Liang, M. Gauthier, R. Y. Li and X. L. Sun, J. Power Sources, 2012, 208, 340 CrossRef CAS.
- B. Wang, T. F. Liu, A. M. Liu, G. J. Liu, L. Wang, T. T. Gao, D. L. Wang and X. S. Zhao, Adv. Energy Mater., 2016, 6, 1600426 CrossRef.
- M. Maccario, L. Croguennec, B. Desbat, M. Couzi, F. Le Cras and L. Servant, J. Electrochem. Soc., 2008, 155, A879 CrossRef CAS.
- M. J. Matthews, M. A. Pimenta, G. Dreesselhaus, M. S. Dreesselhaus and M. Endo, Phys. Rev. B, 1999, 59, R6585 CrossRef CAS.
- M. M. Chen, Q. Q. Ma, C. Y. Wang, X. Sun, L. Q. Wang and C. Zhang, J. Power Sources, 2014, 263, 268 CrossRef CAS.
- R. Dominko, J. M. Goupil, M. Bele, M. Gaberscek, M. Remskar, D. Hanzel and J. Jamnik, J. Electrochem. Soc., 2005, 152, A858 CrossRef CAS.
- R. Dominko, M. Bele, M. Gaberscek, M. Remskar, D. Hanzel, J. M. Goupil, S. Pejovnik and J. Jamnik, J. Power Sources, 2006, 153, 274 CrossRef CAS.
- X. L. Wu, L. Y. Jiang, F. F. Cao, Y. G. Guo and L. J. Wan, Adv. Mater., 2009, 21, 2710 CrossRef CAS.
- C. Su, X. D. Bu, L. H. Xu, J. L. Liu and C. Zhang, Electrochim. Acta, 2012, 64, 190 CrossRef CAS.
- S. W. Oh, Z. D. Huang, B. Zhang, Y. Yu, Y. B. He and J. K. Kim, J. Mater. Chem., 2012, 22, 17215 RSC.
Footnote |
| † Electronic supplementary information (ESI) available. See DOI: 10.1039/c8ra09124b |
| This journal is © The Royal Society of Chemistry 2018 |

