
 Open Access Article
 This Open Access Article is licensed under a Creative Commons Attribution-Non Commercial 3.0 Unported Licence
The power of fluorescence excitation–emission matrix (EEM) spectroscopy in the identification and characterization of complex mixtures of fluorescent silver clusters†
H. Ramsay,
D. Simon,
E. Steele,
A. Hebert,
R. D. Oleschuk and
K. G. Stamplecoskie *
*
Department of Chemistry, Queen's University, Kingston, Ontario K7L 3N6, Canada. E-mail: kevin.stamplecoskie@queensu.ca
First published on 18th December 2018
Abstract
Silver and gold clusters have received a lot of recent attention for their use in biomedical imaging. However, crude solutions of clusters are often complex mixtures, leading to discrepancies in their identification and characterization; important factors in determining their utility in biological applications. In the present study, silver clusters were separated for analysis using reverse-phase high performance liquid chromatography, which has previously been implemented in the efficient separation of gold clusters. Using fluorescence excitation–emission matrix (EEM) spectroscopy, we have demonstrated that a certain family of glutathione-protected silver clusters, previously thought to be one optically distinct species, is better described as a complex mixture of at least three distinct silver cluster species, each possessing unique optical properties. Based on these findings, EEM spectroscopy can be implemented as a powerful technique for determining the purity of complex mixtures, especially when other techniques, including mass spectrometry, fail to provide adequate characterization of a given material.
Introduction
Gold and silver clusters are an emerging class of optically active nano material that display interesting photophysical properties.1–5 Clusters, which have discrete electronic states, can be differentiated from larger classes of materials, including nanoparticles and bulk metals.5–7 The unique properties of clusters, including molecule-like HOMO–LUMO transitions, fluorescence, and long-lived excited-state lifetimes, make clusters useful in a number of different applications, including photocatalysis, chemical sensing, and bio-imaging and therapy.8–12Clusters are of particular interest for bio-imaging and therapy due to their non-linear optical properties, as well as their ability to absorb light and convert the energy to heat very efficiently.13–16 Though gold clusters/nanoparticles are the most extensively studied, aqueous silver nanoclusters (AgNCs) have become of interest as a superior metal for this application, owing to their fluorescence, potent antibacterial activity, and broader chemical diversity.17–20 Of these AgNCs, those stabilized with glutathione (GSH) are the most commonly studied.21 Before clinical use, the exact composition and optical properties of cluster compounds need to be understood in order to ascertain how these materials may function or change in the body. However, most current studies explore the properties of a mixture of metal clusters or nanoparticles without providing insight into size-dependent properties, especially as they relate to chemical composition.21–23 Notably, there are challenges to determining the exact composition of silver cluster compounds and the characterization of Ag by mass spectrometry is further complicated by the distribution of isotopes present in a 10–100 Ag atom cluster, as well as the tendency for these clusters to fragment.22,24,25 To add to this confusion, multiple publications have reported that a single cluster species is responsible for a common optical “signature” (absorbance spectrum) observed for glutathione protected silver clusters.23,26 However, in this work we unequivocally determine that the same material is actually composed of at least three major components. New strategies, like fluorescence EEM spectroscopy, are required (and highlighted here) in order to characterize and identity these complex silver cluster compounds.
Fluorescence excitation–emission matrix (EEM) spectroscopy is a technique that allows for the complete, quantitative determination of the fluorescence profile of a given material.27,28 Unlike simple emission spectroscopy that is commonly used to visualize the fluorescence of metal clusters, EEM spectroscopy can afford information on the emission profile concurrently with excitation wavelength data, creating a three dimensional map of fluorescence characteristics. The observed electronic transitions are telling of the structure and properties of a material, and most importantly herein, provide greater insight into material purity and composition.29,30
EEM spectroscopy is a novel characterization tool when considering atomically precise clusters. In this work we show that this mixture of AgNCs, previously identified as a single, atomically precise species, contains at least 3 different clusters, which together dictate the optical properties of this material. Separation of these clusters by reverse-phase high performance liquid chromatography (RP-HPLC) and characterization by UV-visible absorbance spectroscopy, parallel factor (PARAFAC) analysis and thermogravimetric analysis (TGA) support this finding. The optical properties of these AgNCs, including fluorescence quantum yield, have also been determined for the first time for each of the major individual components that comprise the complex mixture.
Experimental section
Reagents and materials
Sodium borohydride (NaBH4, 98%), reduced glutathione (GSH, reduced, 98%), and silver nitrate (AgNO3, ≥99.0%) were all purchased from Sigma-Aldrich. Methanol (MeOH, ≥99.8%) and HPLC grade acetonitrile (ACN) were purchased from Sigma-Aldrich and Thermo Fisher Scientific, respectively. Milli-Q water (18 Mohm cm−1) was used in all experiments. All chemicals were utilized without further purification.Synthesis
Glutathione (GSH) protected AgNCs were synthesized following a similar procedure to previous reports.31 Briefly, 0.0848 g AgNO3 (5.12 mM) and 0.153 g GSH (5.12 mM) were dissolved in 0.5 mL and 2 mL of Milli-Q water, respectively. Sequentially, these solutions were added to ice-cold methanol (95 mL) and stirred for 5 minutes at moderate speed. The resulting silver–thiolate suspension appeared cloudy and white. A freshly prepared NaBH4 solution (5.32 × 10⁻¹ M, 15 mL) was then added to the suspension, dropwise, under vigorous stirring. Upon the beginning of dropwise addition, the solution became yellow in colour, and gradually transitioned from yellow, to amber, to brown and then black in appearance over the course of an hour. The absorbance was monitored over 24 hours (by centrifugal precipitation and dissolving in ultra pure water), at which point the absorbance peaks of the product appeared to be maximized in intensity, and the dark solution was removed from the cold stirring conditions. The solution was then centrifuged for 5 minutes at 5000 rpm. The centrifuge tubes were then decanted, and the product was left to dry in a vacuum oven, at room temperature, overnight. After drying, the solid was collected and stored in the refrigerator at 4 °C for the duration of the study. We hereby refer to this sample as the crude sample, as it has been shown to contain multiple cluster species. For mass spectrometry experiments, samples were dissolved in ultra pure water and prepared at concentrations of 20 mg mL−1 and for RP-HPLC at 1 mg mL−1 (analytical) and 200 mg mL−1 (prep-scale).Instrumentation
Absorbance spectra of nanoclusters were recorded using an Agilent Cary 60 UV-Vis absorbance spectrometer. EEM spectra were taken using the Horiba Duetta Fluorescence and Absorbance Spectrometer, and inner-filter effects and Rayleigh scattering were corrected using EzSpec™ software. Reverse-phase high performance liquid chromatography (RP-HPLC) was accomplished using a preparatory scale C18 column (Dim. 250 mm × 21.2 mm) using the Varian PS218 Solvent Delivery Module, as well as an analytical scale amide column (Waters BEH Amide; 2.1 mm × 100 mm; 1.7 μm particle size) on a Waters H-Class UPLC. The high-resolution mass spectra of AgNCs were recorded on a Bruker Autoflex TOF using laser desorption ionization (LDI) in negative ion mode with a linear detector. A total of 2000 laser shots were summed from 200 pulses of the 2 kHz SmartBeam laser set to a flat profile. The spectra were recorded in the mass range of 800–6000 m/z. Finally, thermogravimetric analysis (TGA) was performed with the TGA Q500 V6.7 Build 203 using a ramp of 5 °C min−1 and heating up to 900 °C under argon gas.Theoretical methods
Before performing PARAFAC analysis, Rayleigh scattering and Raman signals were removed from each EEM spectra of the data set and each EEM was subsequently normalized and smoothed with a Gaussian filter. PARAFAC was executed using the N-Way Toolbox for MATLAB, assuming 3 significant components were present in the data set and constraining the components to be non-negative in all dimensions.32Results and discussion
Synthesis and stability
In the first step of AgNC synthesis, AgNO3 was partially reduced by glutathione, a water-soluble thiol that strongly binds and stabilizes silver ions to form a silver–thiolate complex. Further reduction at 0 °C with NaBH4 resulted in the slow formation of AgNCs, the absorbance features of which gradually increased with time over the course of 24 hours (Fig. 1a). The final product has distinct absorbance maxima at 335 nm, 483 nm and 650 nm. Interestingly, it was found that using a molar ratio of 1![[thin space (1/6-em)]](https://www.rsc.org/images/entities/char_2009.gif) :1:16 of Ag:GSH:NaBH4 resulted in the sharpest and most consistent optical signature, as compared to using other concentrations of NaBH4 (Fig. S1†). Solid AgNCs were collected by centrifugation, dried in a vacuum oven and placed in the refrigerator at 4 °C for the duration of the study to ensure constant storage temperature during the warm summer months. This solid sample remained stable indefinitely (at least several weeks during experimentation) while kept under these storage conditions. When dissolved in water, AgNCs retain their absorbance, slowly degrading over 24 hours (Fig. 1b). It was found that storing this aqueous solution of clusters in the dark under cold temperatures results in the best retention of these optical features, likely owing to their photoactivity and susceptibility to thiol-etching over time.33
:1:16 of Ag:GSH:NaBH4 resulted in the sharpest and most consistent optical signature, as compared to using other concentrations of NaBH4 (Fig. S1†). Solid AgNCs were collected by centrifugation, dried in a vacuum oven and placed in the refrigerator at 4 °C for the duration of the study to ensure constant storage temperature during the warm summer months. This solid sample remained stable indefinitely (at least several weeks during experimentation) while kept under these storage conditions. When dissolved in water, AgNCs retain their absorbance, slowly degrading over 24 hours (Fig. 1b). It was found that storing this aqueous solution of clusters in the dark under cold temperatures results in the best retention of these optical features, likely owing to their photoactivity and susceptibility to thiol-etching over time.33
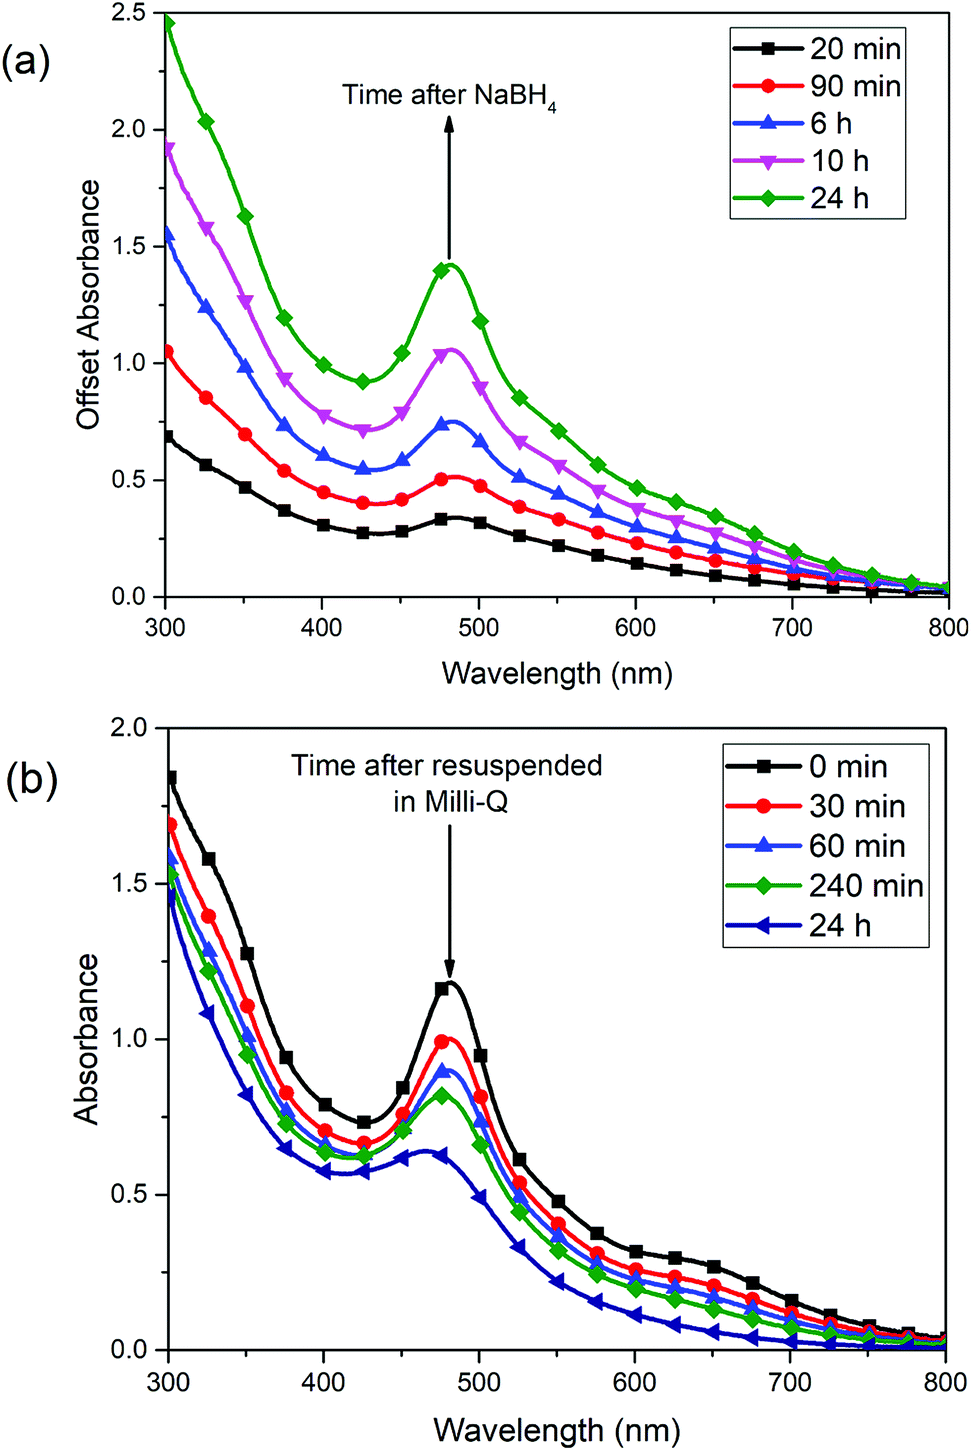 | ||
| Fig. 1 (a) Absorbance spectra of AgNC solution measured over the course of 24 h after reduction with NaBH4, and (b) absorbance spectra depicting degradation of crude sample of AgNCs in ultrapure water over 24 hours as indicated by a subsequent loss in overall absorbance. | ||
For the crude mixture of AgNCs, the excitation (λems = 680 nm) and emission (λex = 305 nm, 435 nm, 475 nm) spectra are illustrated in Fig. 2. The excitation spectrum for the crude mixture does not match well with the absorbance spectra of this sample, which is consistent with data in previous reports.26 What has been previously overlooked is that this mismatch is a strong indicator that this is not a pure sample, and the difference is due to different quantum yields of emission of the individual components of the mixture. Mass spectrometry (see ESI†) provides no clear solution to this phenomenon, as the LDI spectra of this crude sample and its separated components look identical and represent only fragments of the original clusters, common to each sample. To further investigate this, we performed separation by HPLC and subsequent analysis with EEM spectroscopy.
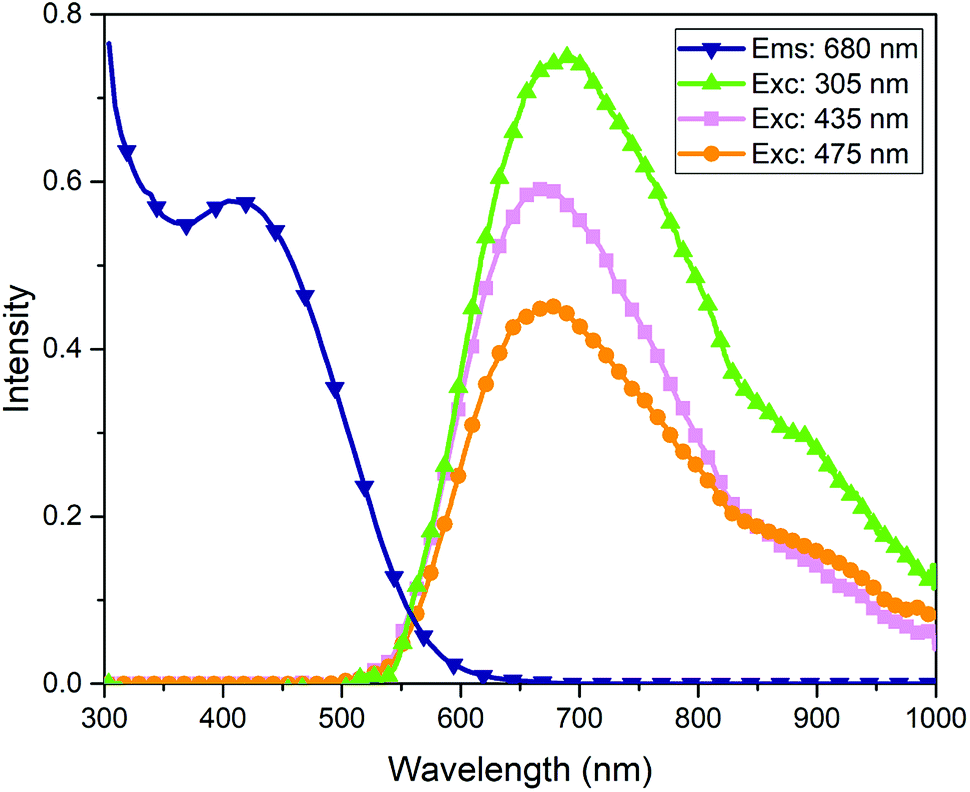 | ||
| Fig. 2 Excitation spectra of crude AgNCs probed at λems = 680 nm and emission spectra of crude AgNC probed at λex = 305 nm, 435 nm, 475 nm. | ||
The emission spectra of the crude mixture also indicate that this optical absorbance signature is accounted for by multiple species. Emission should be independent of excitation wavelength (Kasha's rule), with few exceptions.34,35 As seen in Fig. 2, it is evident that multiple emission profiles are required to generate the overall emission characteristics, indicating the presence of different cluster species in this mixture. Using simple emission spectroscopy in isolation makes it very difficult to observe this effect, as emission peaks are only shifted marginally from one another in these red-emitting cluster species.26,36,37
Separation of Agx(SG)Y mixture
The use of high performance liquid chromatography has been instrumental in separating and characterizing metal clusters, including many different gold nanocluster species.38 Herein, we have shown the utility of reverse-phase HPLC in separating these silver cluster species. The crude mixture of AgNCs were dissolved in a 50:50 solution of acetonitrile:water and loaded onto an amide column. Using an isocratic mobile phase gradient of 51:49 acetonitrile:10 mM ammonium acetate at a flow rate of 0.50 mL min−1 for 30 minutes, the clusters were eluted off the column based on the strength of their van der Waals interactions with the column (Fig. S2†). The first species to elute from the column, referred to as AgA, possessed the lowest retention time, and was rapidly eluted at 6.5 minutes. The second (AgB) and third (AgC) species to be observed were then eluted at retention times of 13 and 19 minutes, respectively. This method consistently resulted in the elution of three cluster species with three distinct optical signatures, as observed in Fig. 3. On a preparatory scale, we were able to use a C18 column to generate large quantities of individual clusters for further analysis. As the cluster species are likely very similar, and differ only by a few silver or ligand components, complete and distinct separation is challenging. However, this method is repeatable and presents a reliable method for obtaining these three distinct fractions of clusters that appear to be present in the crude sample of AgNCs.
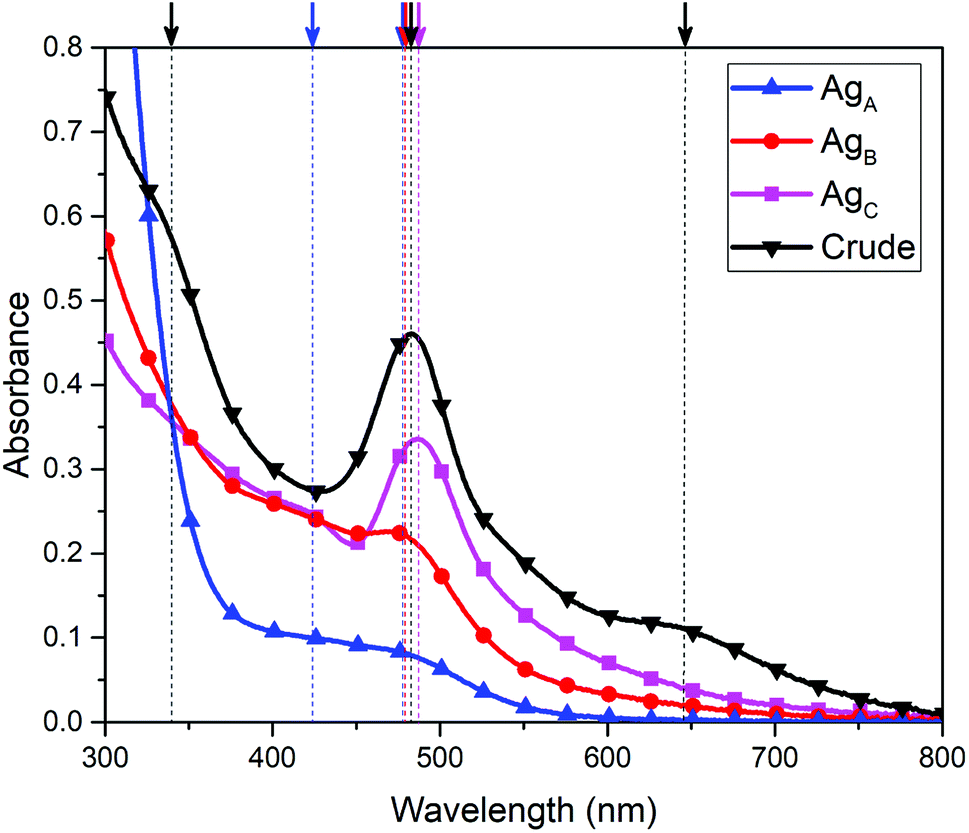 | ||
| Fig. 3 Absorbance spectra of AgA AgB and AgC from reverse phase HPLC experiment; arrows/dotted lines represent absorption maxima. | ||
The work-up of these separated fractions involved concentrating and purifying samples by centrifugation, using centrifugal filters with a 3 kDa cut-off, until the total volume of each fraction was reduced to approximately 100 μL. Following concentration, purified silver cluster species could be easily precipitated using methanol (∼2 mL), and were then precipitated by centrifugation, decanted and left to dry in the vacuum oven. These samples were placed in the refrigerator and stored at 4 °C for the duration of the study.
Characterization of AgNC by fluorescence EEM
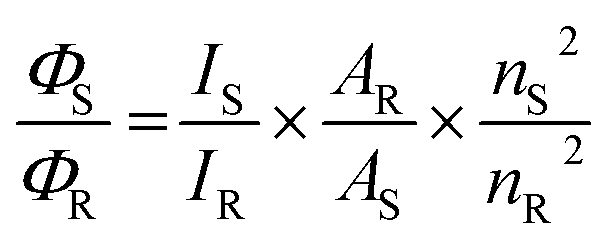
Using EEM spectroscopy, it is possible to visualize the complete fluorescence profile of each of the three cluster species isolated from RP-HPLC. We will henceforth refer to these species based on their order of elution from RP-HPLC: AgA, AgB and AgC, respectively. From the emission spectra of these three samples (λex = 445 nm) (Fig. 4), it can be observed that AgA has an emission maximum at 680 nm, AgB has an emission maximum at 665 nm and AgC has an emission maximum at 925 nm. This clearly demonstrates the different emission maxima observed for silver cluster species and showcases their unique optical signatures. Using eqn (1), we have calculated the quantum yield of emission for Ag A, B and C to be 0.323%, 0.232% and 0.083%, respectively, using a quantum yield standard of zinc phthalocyanine.
 | (1) |
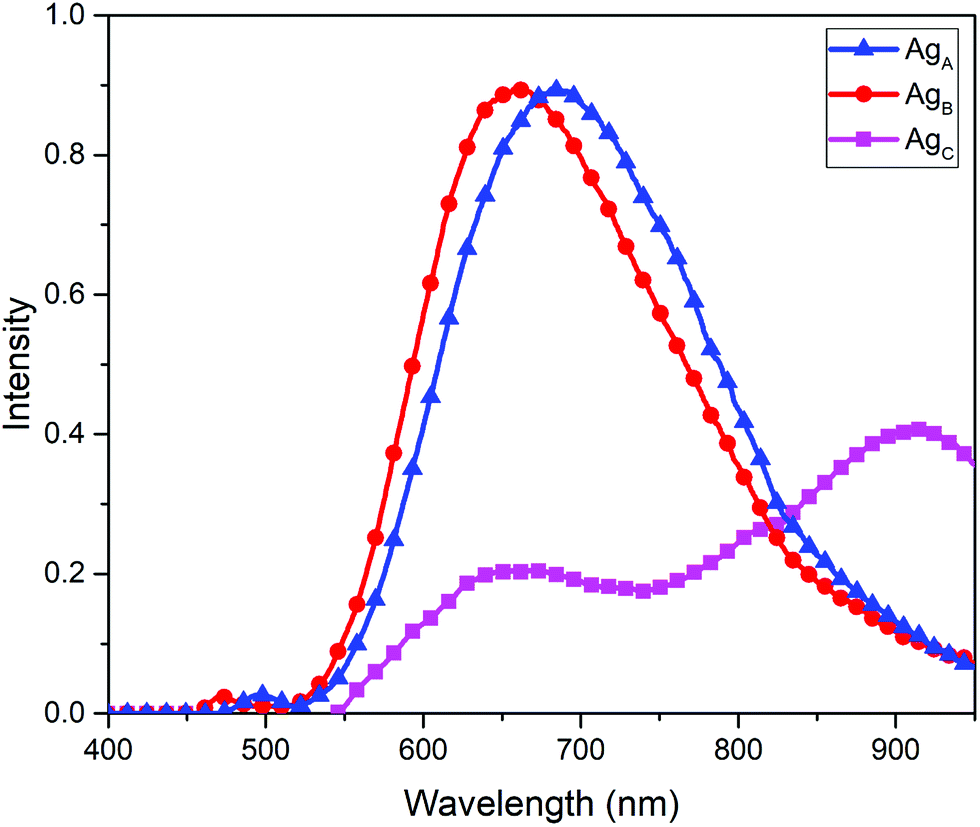 | ||
| Fig. 4 Emission spectra of separated fractions of AgNCs probed at an excitation wavelength of 445 nm, with intensity normalized to a value of 1 and corrected for inner filter effects. | ||
Based on these emission profiles, it appears that AgC has some impurity of AgB, as there is an emission peak at 665 nm observed in this fraction. As the quantum yield of AgB is much higher than AgC, any small impurity of this species would result in a noticeable emission, which could explain the minor presence of AgB in AgC.
The fluorescence EEM spectra in Fig. 5 provided the most substantial evidence that these three separated fractions are not only different, but also rationalize the fluorescence profile of the crude sample in combination. By visualizing the complete fluorescence profile of AgA, AgB and AgC, as well as the crude AgNCs, it is possible to observe that:
| Crude = a(E1) + b(E2) + c(E3) | (2) |
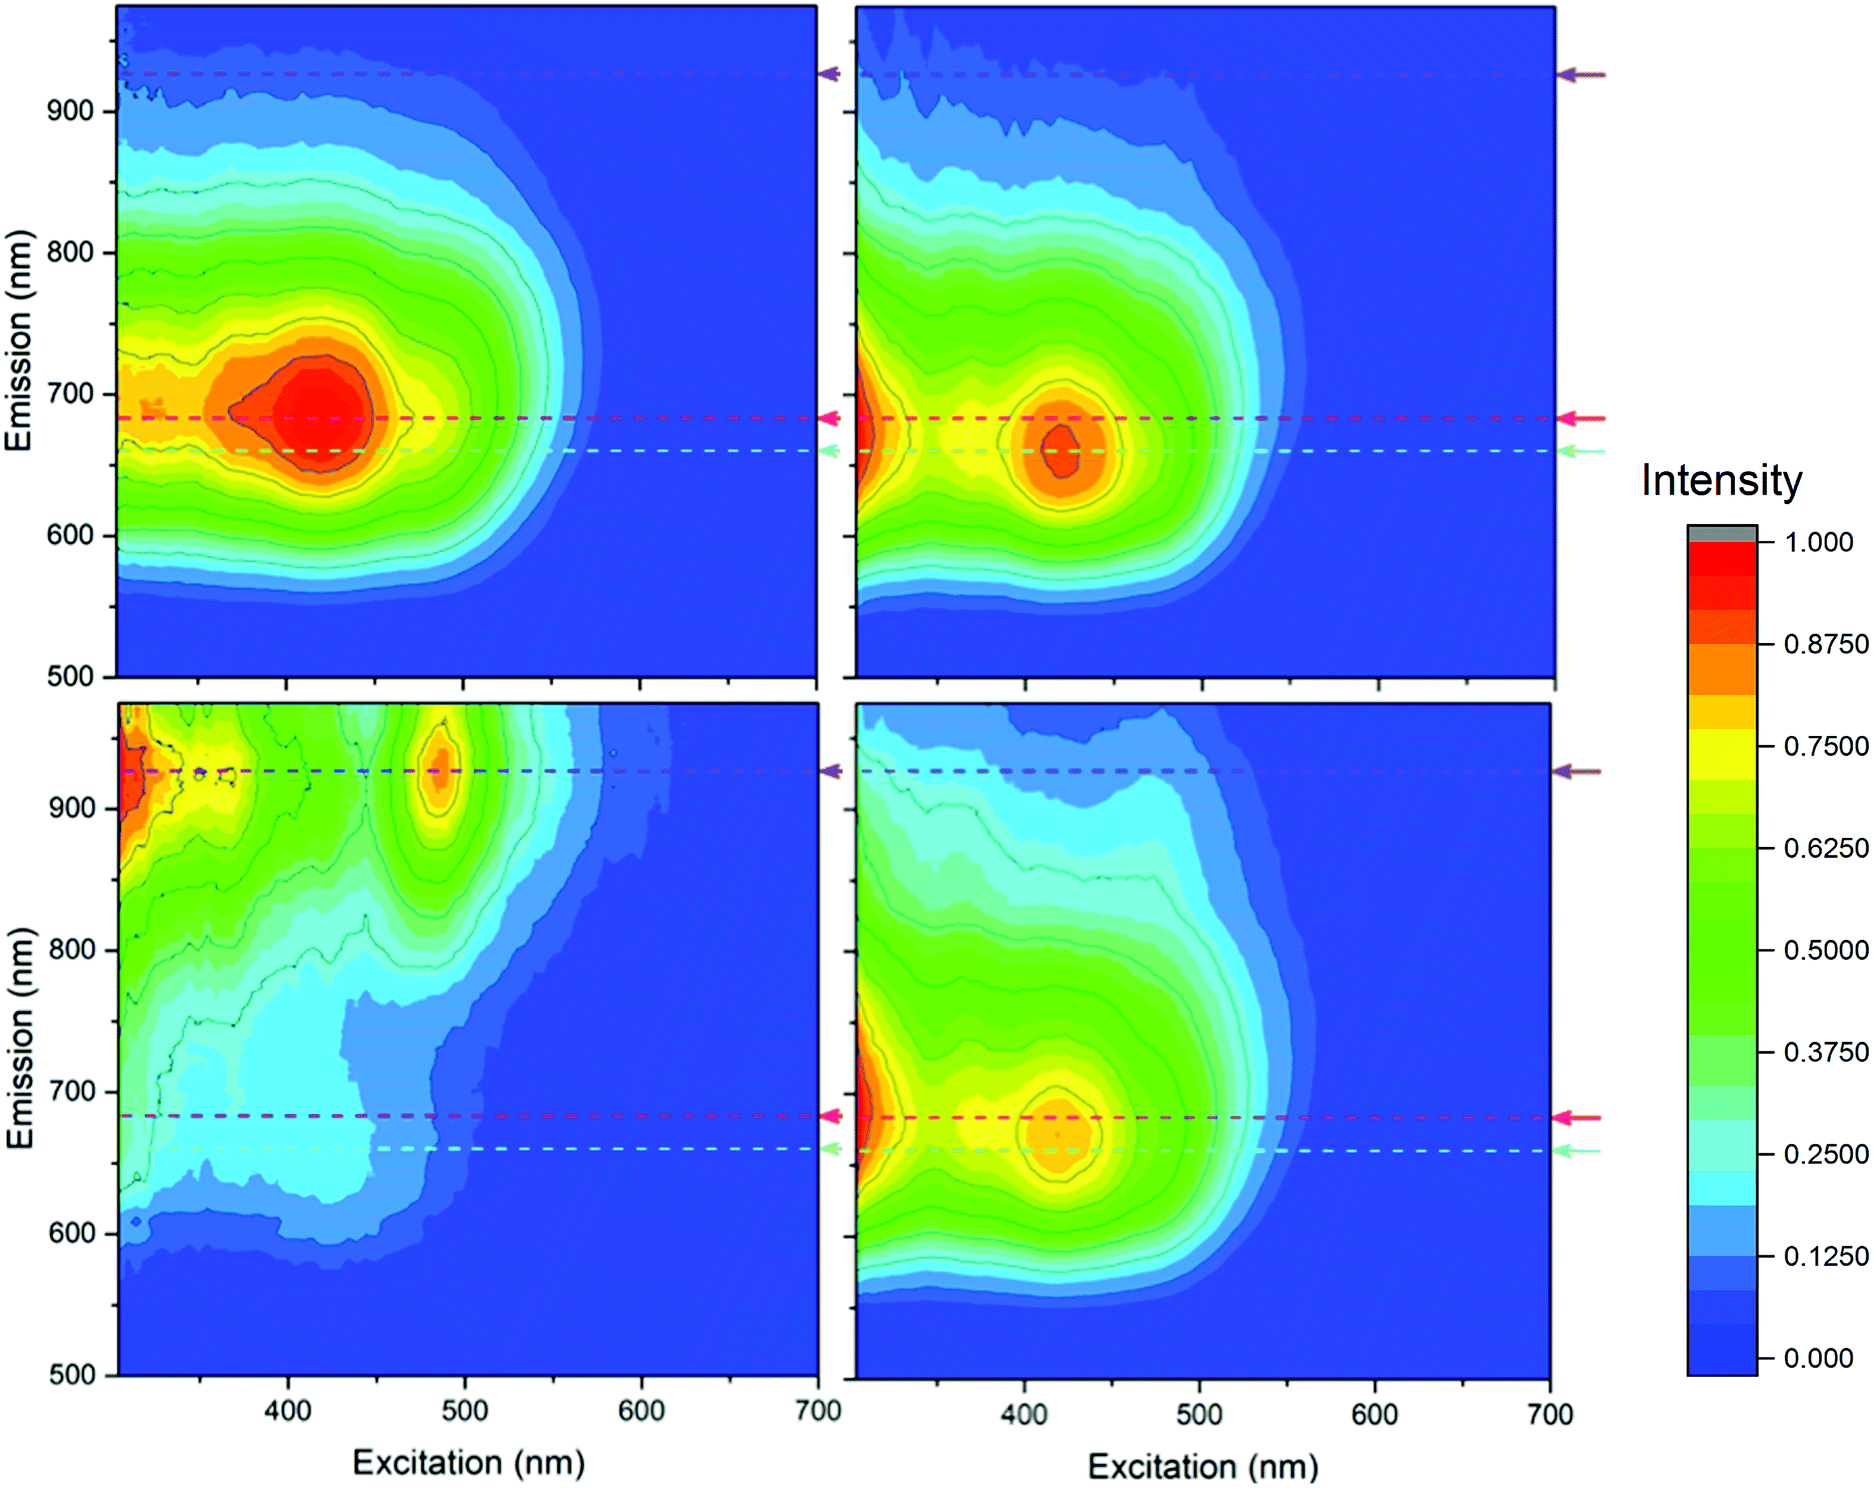 | ||
| Fig. 5 Fluorescence EEM spectra of AgA (top left), AgB (top right), AgC (bottom left) and the crude sample (bottom right). Dotted lines/arrows indicate the relative position of observed emission maxima. All plots are normalized to an intensity of 1 and were corrected for inner filter effects. The quantum yields of emission for Ag A, B and C are 0.323%, 0.232% and 0.083%, respectively. | ||
The ‘tailing up’ of the emission profile of the crude sample is indicative of the presence of AgC, and AgA and AgB emit too closely to be distinguished by the single observed emission maxima at 675 nm. However, upon separation of these components, it is possible to observe that the close-emitting clusters of AgA and AgB are distinct and both contribute to this unique emission profile.
Furthermore, parallel factor (PARAFAC) analysis, also called canonical decomposition (CANDECOMP), has been performed on these purified fractions. PARAFAC analysis is a type of tensor decomposition described by the following formula:
 | (3) |
PARAFAC is typically implemented using an alternating least squares algorithm, wherein the tensor is reshaped into a 2D array, and where the dimensions are changed from i × j × k to i × jk. Linear regression is then performed on i, while j and k are held constant. Then the matrix is reshaped to j × ik and j is regressed, then k. The process repeats until a convergence threshold is reached. The advantage of this method is that it always moves toward the optimal solution. Simply put, PARAFAC analysis fits multiple two-way arrays (slices) of a three-way array (EEM plot) in terms of a common set of factors that have different relative weights in each slice.40 Though traditionally used for assessing the fluorescence of dissolved organic matter in water samples in conjunction with EEM,41,42 this technique has found new utility in this work in qualitatively predicting the number of components present in complex data sets.
To perform the decomposition, the number of components that best represent a data set must be approximated beforehand. Then, PARAFAC analysis is run, and provides a metric describing how well the generated factors match the selected data set. As the separation performed produced three distinct cluster species, PARAFAC analysis was performed in order to establish what these three components should look like separately, because, as noted, AgC appeared to have contamination of AgB. In this sample, the EEM plots generated by PARAFAC were found to describe 99.3% of the data when fit to three components and matches the expected emission profiles of the three observed cluster species with great precision. Therefore, PARAFAC analysis qualitatively supports the presence of three distinct compounds in this complex mixture of silver clusters, which can be observed in Fig. 6.
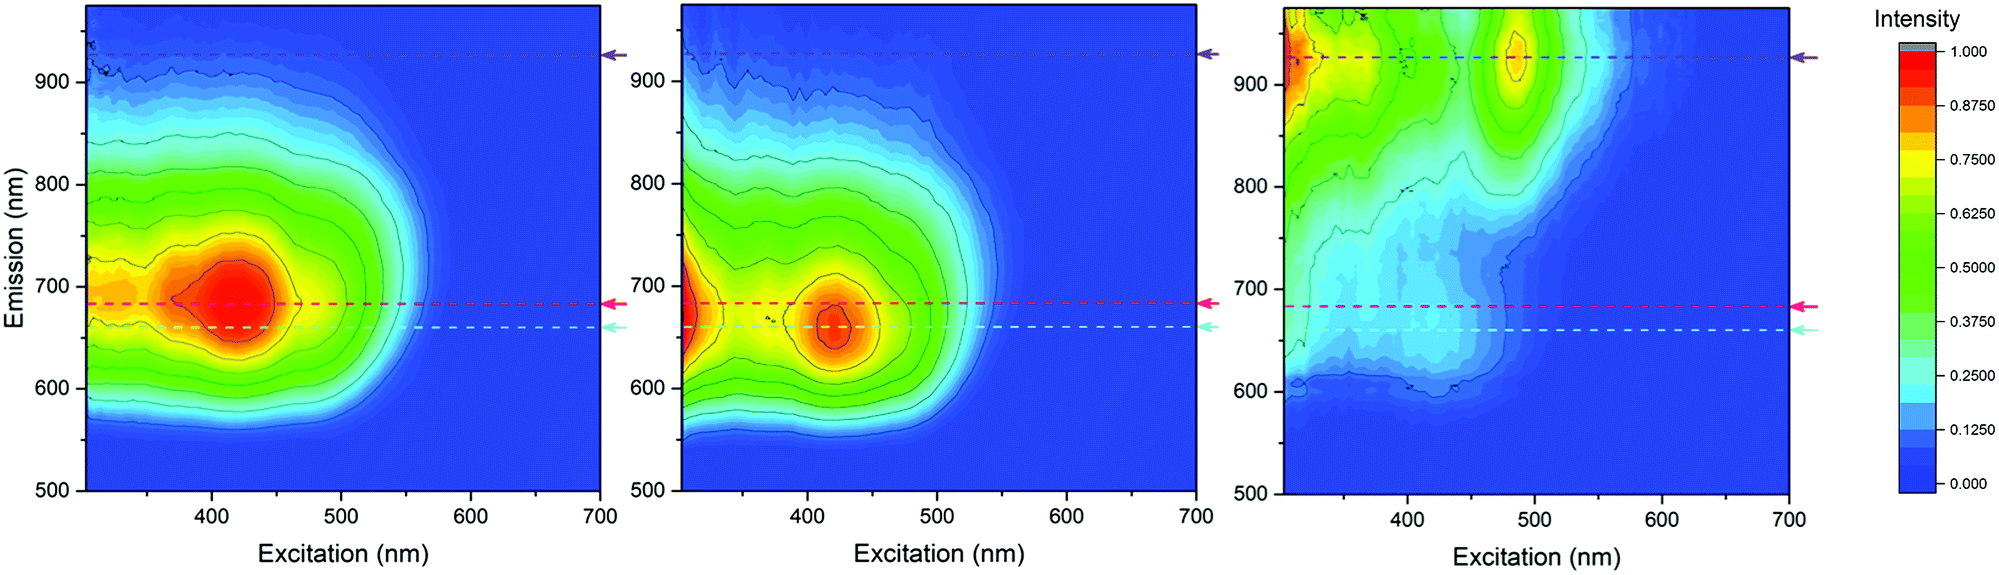 | ||
| Fig. 6 Fluorescence EEM spectra generated by PARAFAC analysis that was fit to three components and computed using EEM data obtained from mixtures of AgNCs eluted from HPLC experiments. All plots are normalized to an intensity of 1. | ||
Mass spectrometry of silver clusters remains extremely complex due to the stated challenges, including the complicated isotope patterns of both silver and sulfur, sensitive susceptibility to fragmentation as well as the aqueous solubility of these particular silver clusters and increased difficulty in ionization as a result. Previous studies have appeared to identify AgNCs with similar absorbance profiles to AgA as Ag15(SG)11 (ref. 25) and AgC as Ag32(SG)19,24 though there are conflicting results on exact identities in the literature due to the complicated nature of the mass spectra, which are often low-resolution and displaying broad and/or ambiguous peaks.23,43,44 In this study, we have achieved high-resolution mass spectrometry data, using LDI in negative ion mode with a linear detector, up to 3600 Da, which far surpasses many of the previously mentioned broad and uncertain spectra that exist in literature. These spectra have been analyzed for common fragmentation patterns (Fig. S3†), which may be telling of the larger structure of these clusters. As can be seen in Fig. S4,† it is evident that AgA is a cluster species with greater than 15 silver atoms, and based on the mass spectra, these clusters contain at least Ag23. Due to the current challenges ionizing and observing the molecular ion, it is not possible to assess differences between the mass spectra of different fractions of silver clusters. Despite this, the spectra in ESI† provide an interesting lens into the complex isotope patterns and fragmentation observed and will be an important focus of future studies involving this material.
TGA provides additional evidence that these three separated fractions are unique (Fig. S5†). The percent composition for each fraction was calculated to be: (AgA) 57.8% GSH: 42.2% Ag, (AgB) 55.7% GSH: 44.3% Ag and (AgC) 3 53.4% GSH: 46.6% Ag.45 The proportion of the mass accounted for by ligands tends to decrease with increasing magic number sizes of metal clusters.46 As AgA had the largest percentage of its mass attributed to GSH, it is likely that this cluster is the smallest in size of the three cluster species. This is further supported by the finding that this cluster had the highest quantum yield of emission, as smaller metal clusters tend to be more emissive,47 as well as that this was the first species eluted from RP-HPLC experiments, and had the fewest interactions with the column based on its small size. Additionally, there are notable differences in the mass loss profiles of these species in the third destruction step, from 500 °C to 800 °C. AgA experiences a slower rate of mass loss over this step, as evidenced by the broad curve that extends past 700 °C before beginning to plateau. Different sizes of metal clusters have been shown to display unique and varied geometries in terms of their arrangement of ligand–metal staples around a central metal core,46 which could rationalize the different breakdown profiles observed in TGA.
Conclusions
We conclude that the common optical signature observed for glutathione-protected silver clusters, previously thought to be the result of a single optically distinct species, is accounted for by a mixture of three distinct cluster species. The determination of different cluster species was only made possible with the complete fluorescence profiles provided from EEM spectroscopy. Thermogravimetric analysis supports this finding, as well as the implementation of PARAFAC analysis for assessing the components present in this complex mixture. Furthermore, we conclude that the RP-HPLC method developed for this study is an efficient method for separating and isolating these distinct glutathione-protected silver cluster species. Future studies are required to specifically identify which silver clusters are present, though the preliminary mass spectrometry characterization of these samples provides new and interesting clues towards the eventual mass determination of each species. However, more convincing and higher resolution mass spectrometry is still required to draw definite conclusions about the identity of this material.Understanding the unique optical properties of these clusters, in relation to their exact identity, will be essential in future in vivo cell-line studies with this material. The complete characterization of this material is important in understanding how silver clusters may degrade or change in the body, and will help identify which clusters can best function as safe, effective therapeutic tools. Probing the nonlinear optical properties of this material is also of future interest, to further assess the utility of silver clusters in diagnostic and therapeutic applications.
Conflicts of interest
The authors declare no conflicts of interest.Acknowledgements
The research presented herein was supported by the Natural Science and Engineering Research Council (NSERC) through the Discovery Grant program award number RGPIN-2016-05070.Notes and references
- K. G. Stamplecoskie and P. V. Kamat, J. Am. Chem. Soc., 2014, 136, 11093–11099 CrossRef CAS PubMed.
- T. Udayabhaskararao and T. Pradeep, J. Phys. Chem. Lett., 2013, 4, 1553–1564 CrossRef CAS PubMed.
- D. R. Kauffman, D. Alfonso, C. Matranga, G. Li and R. Jin, J. Phys. Chem. Lett., 2013, 4, 195–202 CrossRef CAS PubMed.
- R. Jin, H. Qian, Z. Wu, Y. Zhu, M. Zhu, A. Mohanty and N. Garg, J. Phys. Chem. Lett., 2010, 1, 2903–2910 CrossRef CAS.
- S. H. Yau, O. Varnavski and T. Goodson, Acc. Chem. Res., 2013, 46, 1506–1516 CrossRef CAS PubMed.
- M. S. Devadas, J. Kim, E. Sinn, D. Lee, T. Goodson and G. Ramakrishna, J. Phys. Chem. C, 2010, 114, 22417–22423 CrossRef CAS.
- R. Philip, P. Chantharasupawong, H. Qian, R. Jin and J. Thomas, Nano Lett., 2012, 12, 4661–4667 CrossRef CAS PubMed.
- K. G. Stamplecoskie, G. Yousefalizadeh, L. Gozdzialski and H. Ramsay, J. Phys. Chem. C, 2018, 122, 13738–13744 CrossRef CAS.
- P. V. Kamat, J. Phys. Chem. Lett., 2014, 5, 4167–4168 CrossRef CAS PubMed.
- A. Cantelli, G. Battistelli, G. Guidetti, J. Manzi, M. di Giosia and M. Montalti, Dyes Pigm., 2016, 135, 64–79 CrossRef CAS.
- K. G. Stamplecoskie, Y. Chen and P. V. Kamat, J. Phys. Chem. C, 2014, 118, 1370–1376 CrossRef CAS.
- B. Adhikari and A. Banerjee, Chem. Mater., 2010, 22, 4364–4371 CrossRef CAS.
- S. A. Patel, C. I. Richards, J.-C. Hsiang and R. M. Dickson, J. Am. Chem. Soc., 2008, 130, 11602–11603 CrossRef CAS PubMed.
- P. K. Jain, X. Huang, I. El-Sayed and M. A. El-Sayed, Acc. Chem. Res., 2008, 41, 1578–1586 CrossRef CAS PubMed.
- G. Ramakrishna, O. Varnavski, J. Kim, D. Lee and T. Goodson, J. Am. Chem. Soc., 2008, 130, 5032–5033 CrossRef CAS PubMed.
- G.-S. Park, H. Kwon, D. W. Kwak, S. Y. Park, M. Kim, J.-H. Lee, H. Han, S. Heo, X. S. Li, J. H. Lee, Y. H. Kim, J.-G. Lee, W. Yang, H. Y. Cho, S. K. Kim and K. Kim, Nano Lett., 2012, 12, 1638–1642 CrossRef CAS PubMed.
- I. Díez and R. H. A. Ras, Nanoscale, 2011, 3, 1963–1970 RSC.
- J.-C. Jin, X.-J. Wu, J. Xu, B.-B. Wang, F.-L. Jiang and Y. Liu, Biomater. Sci., 2016, 5, 247–257 RSC.
- X. Le Guével, C. Spies, N. Daum, G. Jung and M. Schneider, Nano Res., 2012, 5, 379–387 CrossRef.
- H. Liu, X. Zhang, X. Wu, L. Jiang, C. Burda and J.-J. Zhu, Chem. Commun., 2011, 47, 4237–4239 RSC.
- S. Kumar, M. D. Bolan and T. P. Bigioni, J. Am. Chem. Soc., 2010, 132, 13141–13143 CrossRef CAS PubMed.
- X. Yuan, Y. Tay, X. Dou, Z. Luo, D. T. Leong and J. Xie, Anal. Chem., 2013, 85, 1913–1919 CrossRef CAS PubMed.
- X. Yuan, M. I. Setyawati, A. S. Tan, C. N. Ong, D. T. Leong and J. Xie, NPG Asia Mater., 2013, 5, e39 CrossRef CAS.
- J. Guo, S. Kumar, M. Bolan, A. Desireddy, T. P. Bigioni and W. P. Griffith, Anal. Chem., 2012, 84, 5304–5308 CrossRef CAS PubMed.
- F. Bertorelle, R. Hamouda, D. Rayane, M. Broyer, R. Antoine, P. Dugourd, L. Gell, A. Kulesza, R. Mitric and V. Bonačić-Koutecký, Nanoscale, 2013, 12, 5637–5643 RSC.
- N. Cathcart, P. Mistry, C. Makra, B. Pietrobon, N. Coombs, M. Jelokhani-Niaraki and V. Kitaev, Langmuir, 2009, 25, 5840–5846 CrossRef CAS PubMed.
- K. Xiao, Y. Shen, S. Liang, J. Tan, X. Wang, P. Liang and X. Huang, Environ. Sci. Technol. Lett., 2018, 52, 11251–11258 CrossRef CAS PubMed.
- W. Chen, P. Westerhoff, J. A. Leenheer and K. Booksh, Environ. Sci. Technol., 2003, 37, 5701–5710 CrossRef CAS PubMed.
- A. Baker, Environ. Sci. Technol., 2001, 35, 948–953 CrossRef CAS PubMed.
- J. Cao, L. Li, X. Li, Z. Zhang, S. Xu and M. Peng, J. Mater. Chem. C, 2018, 6, 5384–5390 RSC.
- N. Sakai, S. Nakamura and T. Tatsuma, Dalton Trans., 2013, 42, 16162–16165 RSC.
- C. Andersson and R. Bro, Chemom. Intell. Lab. Syst., 2000, 52, 1–4 CrossRef CAS.
- T. Udaya Bhaskara Rao and T. Pradeep, Angew. Chem., Int. Ed., 2010, 49, 3925–3929 CrossRef CAS PubMed.
- P. Klán and J. Wirz, Photochemistry of Organic Compounds: From Concepts to Practice, John Wiley & Sons, 2009 Search PubMed.
- M. Kasha, Discuss. Faraday Soc., 1950, 9, 14–19 RSC.
- E. Hooley, V. Paolucci, Z. Liao, M. Carro Temboury and T. Vosch, Adv. Opt. Mater., 2015, 3, 1109–1115 CrossRef CAS.
- B. A. Ashenfelter, A. Desireddy, S. H. Yau, T. Goodson and T. P. Bigioni, J. Phys. Chem. C, 2015, 119, 20728–20734 CrossRef CAS.
- Y. Niihori, C. Uchida, W. Kurashige and Y. Negishi, Phys. Chem. Chem. Phys., 2016, 18, 4251–4265 RSC.
- R. Bro, Chemom. Intell. Lab. Syst., 1997, 38, 149–171 CrossRef CAS.
- R. A. Harshman and M. E. Lundy, Comput. Stat. Data Anal., 1994, 18, 39–72 CrossRef.
- S. K. L. Ishii and T. H. Boyer, Environ. Sci. Technol., 2012, 46, 2006–2017 CrossRef CAS PubMed.
- C. A. Stedmon and S. J. L. Markager, Oceanography, 2005, 50, 686–697 CAS.
- T. Goswami, M. Singh and K. M. Reddy, Mater. Res. Bull., 2018, 107, 286–294 CrossRef CAS.
- P. Gao, H. Wang, G. Zou and K.-Q. Zhang, RSC Adv., 2018, 8, 27805–27810 RSC.
- M. Farrag, M. Thämer, M. Tschurl, T. Bürgi and U. Heiz, J. Phys. Chem. C, 2012, 116, 8034–8043 CrossRef CAS.
- Y. Negishi, K. Nobusada and T. Tsukuda, J. Am. Chem. Soc., 2005, 127, 5261–5270 CrossRef CAS PubMed.
- R. Jin, C. Zeng, M. Zhou and Y. Chen, Chem. Rev., 2016, 116, 10346–10413 CrossRef CAS PubMed.
Footnote |
| † Electronic supplementary information (ESI) available. See DOI: 10.1039/c8ra08751b |
| This journal is © The Royal Society of Chemistry 2018 |