 Open Access Article
Improving the homogeneity of sugarcane bagasse kraft lignin through sequential solvents
Zhuan Jiaab,
Mingfu Liab,
Guangcong Wanab,
Bin Luoab,
Chenyan Guoab,
Shuangfei Wangab and
Douyong Min *ab
*ab
aCollege of Light Industry and Food Engineering, Guangxi University, Nanning 530004, PR China. E-mail: min.douyong@outlook.com
bGuangxi Key Laboratory of Clean Pulp & Papermaking and Pollution Control, Nanning 530004, PR China
First published on 19th December 2018
Abstract
The heterogeneous features of lignin, especially the wide distribution of its molecular weight, limit its high value-added application. To improve the homogeneity of lignin, sugarcane bagasse kraft lignin (KL) dissolved in methanol/acetone (7![[thin space (1/6-em)]](https://www.rsc.org/images/entities/char_2009.gif) :
:![[thin space (1/6-em)]](https://www.rsc.org/images/entities/char_2009.gif) 3, v/v) was successively fractionated into four fractions (i.e.., F1, F2, F3, and F4) with various organic solvents of decreasing dissolving capacity (i.e.., ethyl acetate, ethyl acetate/petroleum ether 1
3, v/v) was successively fractionated into four fractions (i.e.., F1, F2, F3, and F4) with various organic solvents of decreasing dissolving capacity (i.e.., ethyl acetate, ethyl acetate/petroleum ether 1![[thin space (1/6-em)]](https://www.rsc.org/images/entities/char_2009.gif) :
:![[thin space (1/6-em)]](https://www.rsc.org/images/entities/char_2009.gif) 1 v/v, and petroleum ether). The yields of the four fractions (F1, F2, F3, and F4) were 59.6, 28.4, 10.8, and 1.2% that of KL, respectively. Gel permeation chromatography (GPC) analysis indicated the molecular weight of each fraction decreased from F1 to F4. All fractions had a lower polydispersity than KL. KL and the fractions were comprehensively characterized by chemical composition analysis, elemental composition analysis (EA), methoxyl group analysis, Fourier transform infrared spectroscopy (FT-IR), nitrobenzene oxidation analysis (NBO), and nuclear magnetic resonance (NMR) including 31P and 1H–13C HSQC NMR. The results showed that the methoxyl group, hydroxyl group, interunit linkages, and thermal properties of the fractions varied with the molecular weight. The homogeneity of lignin was improved through solvent fractionation.
1 v/v, and petroleum ether). The yields of the four fractions (F1, F2, F3, and F4) were 59.6, 28.4, 10.8, and 1.2% that of KL, respectively. Gel permeation chromatography (GPC) analysis indicated the molecular weight of each fraction decreased from F1 to F4. All fractions had a lower polydispersity than KL. KL and the fractions were comprehensively characterized by chemical composition analysis, elemental composition analysis (EA), methoxyl group analysis, Fourier transform infrared spectroscopy (FT-IR), nitrobenzene oxidation analysis (NBO), and nuclear magnetic resonance (NMR) including 31P and 1H–13C HSQC NMR. The results showed that the methoxyl group, hydroxyl group, interunit linkages, and thermal properties of the fractions varied with the molecular weight. The homogeneity of lignin was improved through solvent fractionation.
1. Introduction
Lignin is the second renewable natural polymer next to cellulose in the plant world. It is also the only non-petroleum resource that provides renewable aromatic compounds, and it has long been regarded as an excellent raw material for the production of chemicals. Lignin consists of three different types of phenyl-propane units (p-hydroxyphenyl (H), syringyl (S), and guaiacyl (G)). These units are linked by a variety of linkages including several types of ethers (e.g., β-O-4, α-O-4) and carbon–carbon linkages (e.g., β–β, β–5). Technical lignin, which is derived from black liquor from papermaking, is primarily incinerated for steam production and power generation. Only a small quantity (<2%)1 of the lignin worldwide produced is used to produce some high value-added products, such as dispersants,2,3 adhesives,4 antioxidants,5,6 and carbon fiber.7,8 As people pay more and more attention to environmental issues, lignin has received more and more attention as an environmentally friendly and renewable material. However, the heterogeneous features of technical lignin significantly limit lignin-based applications. According to previous reports,9,10 the content of lignin functional groups and the thermal stability of lignin are closely related to the molecular weight. Several lignin fractionation methodologies have been used to improve the homogeneity of lignin. To date, four different fractionation methods have been applied including sequential organic solvent extraction,11,12 selective precipitations at reduced pH values,13,14 membrane ultrafiltration,15,16 and ethanol extraction. However, each method has its own limitations, such as expensive organic solvents, the high cost of ultrafiltration, and the recovery of ethanol leading to an increase in cost. Consequently, an economical method for lignin fraction needs to be developed which can improve the homogeneity of lignin effectively.In this study, based on the solubility and characteristics of lignin in different organic solvents, a process for fractionating KL using inexpensive organic solvents was successfully developed. KL was separated into four fractions by various organic solvents based on their solubility. Eventually, KL and the fractions (F1, F2, F3, and F4) were comprehensively characterized by various analytical methods and compared in terms of the yield, molecular weight, content of functional groups, thermal stability, and number of interunit linkages. The results showed that the homogeneity of lignin was increased by solvent fractionation.
2. Material and methods
2.1 Material
The kraft pulping black liquor of sugarcane bagasse was kindly supplied by Guangxi Guitang Co. Ltd. (Guigang, Guangxi, China). All chemicals (AR grade) were purchased from Nanning Lantian Experiment Equipment Company (Nanning, Guangxi, China).2.2 Composition analysis of black liquor
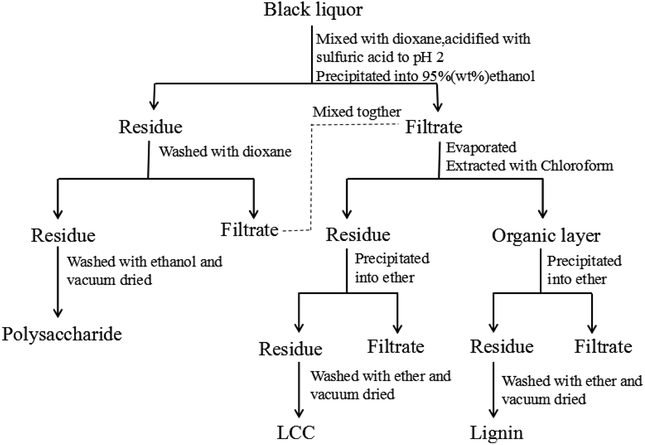
Approximately 5 g of black liquor was dried in an oven at 105 °C for 24 hours to achieve its consistency. The obtained solid was incinerated for 4 h to at 575 °C obtain the black liquor ash content. The quantities of lignin, polysaccharides, and lignin–carbohydrate complex (LCC) in the black liquor were separated and determined according to the reported literature17 as shown in Fig. 1. Approximately 5 g of black liquor was mixed with 45 mL of deionized water and 100 mL of 1,4-dioxane in a 500 mL beaker, and the pH was adjusted to 2 by 720 μL of sulfuric acid (50 wt%). Then, the mixture was dripped into 450 mL of ethanol/water (95![[thin space (1/6-em)]](https://www.rsc.org/images/entities/char_2009.gif) :
:![[thin space (1/6-em)]](https://www.rsc.org/images/entities/char_2009.gif) 5, v/v) to precipitate the polysaccharide. The polysaccharide was centrifuged and washed with 75 mL of 1,4-dioxane, and the washing liquid was mixed with the previous centrifugate. Then, the polysaccharide was washed with 75 mL of anhydrous ethanol and dried in a vacuum oven at 40 °C for 12 h prior to weighing. The mixture was first subjected to rotary evaporation to remove the ethanol, and then 100 mL of chloroform was added. Finally, extraction separation was carried out in a separatory funnel to obtain an organic layer (1,4-dioxane-chloroform phase) and a precipitation layer. The precipitate layer was dripped into 100 mL of ether to precipitate the LCC. The LCC was then washed twice with ether and dried in a vacuum oven at 40 °C for 12 h prior to weighing; the organic layer was dripped into 200 mL of ether to precipitate lignin. The lignin was washed twice with ether and dried in vacuum at 40 °C for 12 h prior to weighing.
5, v/v) to precipitate the polysaccharide. The polysaccharide was centrifuged and washed with 75 mL of 1,4-dioxane, and the washing liquid was mixed with the previous centrifugate. Then, the polysaccharide was washed with 75 mL of anhydrous ethanol and dried in a vacuum oven at 40 °C for 12 h prior to weighing. The mixture was first subjected to rotary evaporation to remove the ethanol, and then 100 mL of chloroform was added. Finally, extraction separation was carried out in a separatory funnel to obtain an organic layer (1,4-dioxane-chloroform phase) and a precipitation layer. The precipitate layer was dripped into 100 mL of ether to precipitate the LCC. The LCC was then washed twice with ether and dried in a vacuum oven at 40 °C for 12 h prior to weighing; the organic layer was dripped into 200 mL of ether to precipitate lignin. The lignin was washed twice with ether and dried in vacuum at 40 °C for 12 h prior to weighing.
2.3 Lignin extraction
Lignin extraction was carried out according to the following steps. Approximately 5 g of black liquor was first diluted ten times with distilled water and then acidified to pH = 2 with 710 μL of sulfuric acid (50 wt%) to precipitate the lignin. The precipitate was obtained by centrifugation and washed with water until neutral. Subsequently, it was freeze-dried and denoted as sugarcane bagasse kraft lignin (KL).2.4 Lignin fractionation by sequential organic solvents
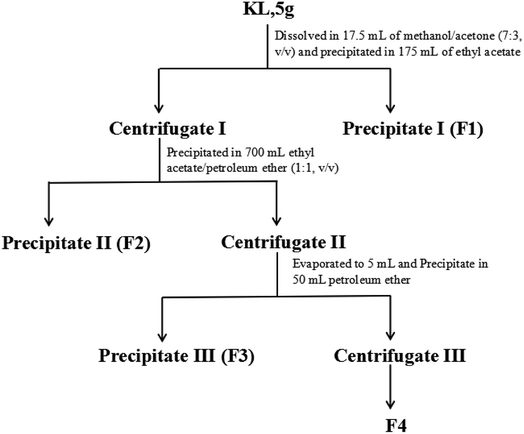
KL was sequentially fractionated with the procedure illustrated in Fig. 2. The fractionation started with 5 g of KL dissolved in 17.5 mL of methanol-acetone mixture (7![[thin space (1/6-em)]](https://www.rsc.org/images/entities/char_2009.gif) :
:![[thin space (1/6-em)]](https://www.rsc.org/images/entities/char_2009.gif) 3, v/v). Then the lignin solution was precipitated in 175 mL of ethyl acetate and centrifuged to obtain precipitate I (denoted as F1) and centrifugate I. Afterwards, centrifugate I was dripped into 700 mL of ethyl acetate/petroleum ether (1
3, v/v). Then the lignin solution was precipitated in 175 mL of ethyl acetate and centrifuged to obtain precipitate I (denoted as F1) and centrifugate I. Afterwards, centrifugate I was dripped into 700 mL of ethyl acetate/petroleum ether (1![[thin space (1/6-em)]](https://www.rsc.org/images/entities/char_2009.gif) :
:![[thin space (1/6-em)]](https://www.rsc.org/images/entities/char_2009.gif) 1, v/v) and centrifuged to obtain precipitate II (denoted as F2) and centrifugate II. The obtained centrifugate II was first evaporated to 5 mL and precipitated in 50 mL of petroleum ether to obtain precipitate III (denoted as F3) and centrifugate III. Centrifugate III was evaporated to obtain the solid (denoted as F4).
1, v/v) and centrifuged to obtain precipitate II (denoted as F2) and centrifugate II. The obtained centrifugate II was first evaporated to 5 mL and precipitated in 50 mL of petroleum ether to obtain precipitate III (denoted as F3) and centrifugate III. Centrifugate III was evaporated to obtain the solid (denoted as F4).
2.5 Characterizations
![[thin space (1/6-em)]](https://www.rsc.org/images/entities/char_2009.gif) :
:![[thin space (1/6-em)]](https://www.rsc.org/images/entities/char_2009.gif) 50. The exhaust gas was purged for 4 min, and the injection volume was 1 mL. The spectrometers were operated in the electron-impact (EI) mode, with a 35–350 m/z scan range. Moreover, the ionization energy was 70 eV and the scan rate was 0.34 s per scan, while the temperature of the ionization source and quadrupole bar was 230 and 150 °C, respectively. The GC-MS data were analyzed using the Agilent ChemStation software.
50. The exhaust gas was purged for 4 min, and the injection volume was 1 mL. The spectrometers were operated in the electron-impact (EI) mode, with a 35–350 m/z scan range. Moreover, the ionization energy was 70 eV and the scan rate was 0.34 s per scan, while the temperature of the ionization source and quadrupole bar was 230 and 150 °C, respectively. The GC-MS data were analyzed using the Agilent ChemStation software.31P NMR. 31P NMR spectra were acquired according to methods previously outlined in the literature.22–24 Briefly, 20 mg of lignin was dissolved in 500 μL of anhydrous pyridine and deuterated chloroform (1.6
![[thin space (1/6-em)]](https://www.rsc.org/images/entities/char_2009.gif) :
:![[thin space (1/6-em)]](https://www.rsc.org/images/entities/char_2009.gif) 1, v/v) until completely dissolved. Then, 100 μL of cyclohexanol (10.85 mg mL−1) and 100 μL of chromium(III) acetylacetonate solution (5 mg mL−1 in pyridine and deuterated chloroform 1.6
1, v/v) until completely dissolved. Then, 100 μL of cyclohexanol (10.85 mg mL−1) and 100 μL of chromium(III) acetylacetonate solution (5 mg mL−1 in pyridine and deuterated chloroform 1.6![[thin space (1/6-em)]](https://www.rsc.org/images/entities/char_2009.gif) :
:![[thin space (1/6-em)]](https://www.rsc.org/images/entities/char_2009.gif) 1, v/v) were added as an internal standard and relaxation reagent, respectively. Afterwards, 100 μL of phosphitylating reagent (2-chloro-4,4,5,5-tetramethyl-1,3,2-dioxaphosphol) was added to the reaction for 15 minutes under stirring and then it was transferred into an NMR tube. All chemical shifts were correlated to the reaction product of water with 2-chloro-4,4,5,5-tetramethyl-1,3,2-dioxaphosphol, which gave a sharp signal in pyridine/CDCl3 at 132.2 ppm.
1, v/v) were added as an internal standard and relaxation reagent, respectively. Afterwards, 100 μL of phosphitylating reagent (2-chloro-4,4,5,5-tetramethyl-1,3,2-dioxaphosphol) was added to the reaction for 15 minutes under stirring and then it was transferred into an NMR tube. All chemical shifts were correlated to the reaction product of water with 2-chloro-4,4,5,5-tetramethyl-1,3,2-dioxaphosphol, which gave a sharp signal in pyridine/CDCl3 at 132.2 ppm.
1H–13C HSQC. Approximately 150 mg of sample dissolved in 500 μL of dimethyl sulfoxide (DMSO-d6) was transferred into an NMR tube. The acquisition parameters were as follows: F1 spectral width (1H): 19.9947 Hz; scanning number: 16; pulse width selection of P1: 12 μs; acquisition point (TD): 65
![[thin space (1/6-em)]](https://www.rsc.org/images/entities/char_2009.gif) 536; F2 spectral width (13C): 12.9836 Hz; scanning number: 10
536; F2 spectral width (13C): 12.9836 Hz; scanning number: 10![[thin space (1/6-em)]](https://www.rsc.org/images/entities/char_2009.gif) 000; pulse width of P1: 12 μs; and acquisition point (TD): 1024. The chemical shift was corrected according to the DMSO contour (δC/δH 39.5/2.5 ppm).
000; pulse width of P1: 12 μs; and acquisition point (TD): 1024. The chemical shift was corrected according to the DMSO contour (δC/δH 39.5/2.5 ppm).
3. Results and discussion
3.1 Composition of black liquor
The consistency of black liquor was 45%. For the solid part, 19% was ash, 12% was lignin, 8% was polysaccharide, 2% was LCC, and 4% was undefined matter.3.2 Chemical compositions of lignin
KL was fractionated into four parts (F1, F2, F3, and F4) by sequential organic solvent as described in Fig. 2. The yields of the fractions (F1, F2, F3 and F4) were 59.6, 28.4, 10.8, and 1.2% that of KL, respectively. The chemical compositions of KL and the fractions are shown in Table 1.| Sample | KL | F1 | F2 | F3 | F4 |
|---|---|---|---|---|---|
| Klason lignin | 94.3 | 89.90 | 91.05 | 92.67 | 93.51 |
| Acid-soluble lignin | 3.10 | 4.70 | 5.20 | 2.90 | 3.80 |
| Total lignin | 97.43 | 94.60 | 96.25 | 95.57 | 97.31 |
| Arabinan | 0.17 | 0.23 | 0.14 | 0.16 | 0.07 |
| Galactan | 0.52 | 0.71 | 0.49 | 0.33 | 0.21 |
| Glucan | 0.09 | 0.14 | 0.08 | 0.10 | 0.05 |
| Xylan | 0.64 | 0.83 | 0.69 | 0.59 | 0.42 |
| Total sugars | 1.42 | 1.91 | 1.40 | 1.18 | 0.75 |
| Ash | 0.70 | 0.51 | 0.00 | 0.83 | 0.00 |
As expected, the lignin contents of KL and the fractions were more than 95%, and only a little amount of residual carbohydrates and ash was identified. The residual carbohydrates in the samples mainly caused from lignin–carbohydrate complex (LCC), in which residual carbohydrates were covalent bonded to lignin, which was little cleaved during kraft pulping process.25
3.3 Molecular weight of the samples
The molecular weights and the polydispersity index (PDI) of KL and the fractions are shown in Table 2.| Sample | Mw (g mol−1) | Mn (g mol−1) | PDI (Mw/Mn) |
|---|---|---|---|
| KL | 3242 | 1077 | 3.01 |
| F1 | 4205 | 1442 | 2.91 |
| F2 | 3239 | 1200 | 2.70 |
| F3 | 1951 | 961 | 2.03 |
| F4 | 760 | 522 | 1.46 |
As shown in Table 2, the molecular weights and PDIs of the fractions decreased with the fractionation process. For instance, the Mw of F1, F2, F3, and F4 were 4205, 3239, 1951, and 760 g mol−1, respectively. The PDIs of F1, F2, F3, and F4 were 2.91, 2.70, 2.03, and 1.46, respectively. It was reported by Wang and Chen26 that the solubility of lignin was related to its molecular weight. The lignin with higher molecular weight more preferred to remain in the solid part, which was consistent with our result. As a mixture of the fractions, KL possessed a lower molecular weight (Mw is 3242 g mol−1) compared to F1 (Mw is 4205 g mol−1) but a higher PDI (3.01), which was explained by the cleavages of the interunit linkages of lignin during the kraft pulping process. A similar result was reported previously.20 The GPC analysis indicated that the organic solvent fractionation can effectively improve the homogeneity of lignin.
3.4 FT-IR analysis
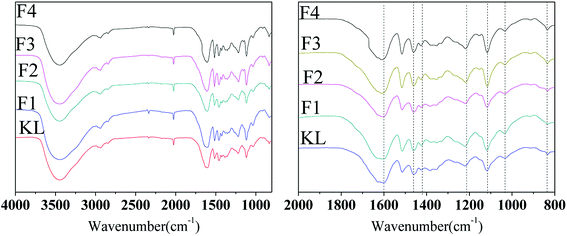
The FT-IR spectra of KL and the fractions are demonstrated in Fig. 3. The main bands assigned according to the literature24 are summarized in Table 3.| Band (cm−1) | Assignments |
|---|---|
| a S: syringyl; G: guaiacyl. | |
| 834 | C–H out of plane in G |
| 1031 | Aromatic C–H in the plane deformation of G and S |
| 1116 | S rings breathing |
| 1164 | H rings breathing |
| 1218 | C–O stretch vibration |
| 1268 | G ring breathing |
| 1329 | S skeleton vibration, C–C and C–O stretch vibration |
| 1425 | C–H deformation in lignin |
| 1461 | Aromatic ring vibration |
| 1514 | Aromatic squel vibration |
| 1608 | Aromatic squel vibration |
| 1700 | C![[double bond, length as m-dash]](https://www.rsc.org/images/entities/char_e001.gif) O stretching in unconjugated or carboxyl groups O stretching in unconjugated or carboxyl groups |
The peaks at 834 and 1268 and 1116 and 1329 cm−1 were assigned to guaiacyl (G) and syringyl (S), respectively. Moreover, the peak at 1166 cm−1 was assigned to p-hydroxyl phenyl propane (H) unit according to the literature,27 indicating that the bagasse lignin was normally HGS type lignin. The presence of G-type unit indicated that sugarcane bagasse lignin possessed potential active sites for polymerization. For instance, phenol condenses initially with formaldehyde in the presence of alkaline to form methylolphenol during phenol formaldehyde condensation reactions.28 Few structural differences between KL and the fractions indicated that the organic solvents fractionation hardly altered the lignin structure and only improved the homogeneity of lignin. In accordance with previous reports, the typical peaks of lignin fractions and the starting lignin were closely similar but different in intensity.20,26
3.5 Elemental and methoxyl content analyses
The C9 formula and the molecular weights of KL and the fractions were calculated by elemental analysis and methoxyl content determination, as shown in Table 4.| Sample | C (%) | H (%) | O (%) | N (%) | S (%) | OMe (%) | C9 formula | Unit weight |
|---|---|---|---|---|---|---|---|---|
| KL | 62.0 | 5.6 | 31.3 | 0.6 | 0.5 | 14.9 | C9H8.0O2.8(OCH3)0.92S0.03 | 191 |
| F1 | 53.3 | 4.8 | 40.8 | 0.7 | 0.4 | 13.8 | C9H7.8O4.7(OCH3)1.00S0.03 | 224 |
| F2 | 62.6 | 5.6 | 31.0 | 0.4 | 0.4 | 14.7 | C9H7.9O2.8(OCH3)0.89S0.02 | 189 |
| F3 | 63.1 | 5.8 | 30.5 | 0.3 | 0.3 | 15.4 | C9H7.8O2.6(OCH3)0.93S0.02 | 188 |
| F4 | 70.1 | 8.1 | 21.3 | 0.3 | 0.2 | 15.9 | C9H8.5O2.5(OCH3)0.96S0.02 | 186 |
The sulfur element remained in each fraction, even though the starting KL had been thoroughly washed before the fractionation. The sulfur element identified in lignin may be derived from hydrosulfide anions during the kraft pulping process. It was previously reported29 that kraft lignin contains 29% inorganic, 1% elemental, and 70% organically bonded sulfur. The sulfur remaining in the fractions was the organically bonded sulfur according to the reported literature.18 The nitrogen content was potentially due to the formation of protein-lignin complexes during the delignification process.30 The methoxyl contents increased from F1 to F4 (weight percent), whereas F4 possessed the highest methoxyl content which is 15.9% indicating that the syringyl lignin was more easily fragmented and dissolved in the pulping black liquor during the kraft pulping process. A similar result had been reported.31
3.6 Alkaline nitrobenzene oxidation
The basic structural information of lignin was achieved by alkaline nitrobenzene oxidation. Based on the yield of the oxidative products (phenolic aldehydes and corresponding acids) of lignin, the condensation degree of lignin was obtained because only non-condensed parts of lignin were oxidized by alkaline nitrobenzene oxidation. And the ratio of syringyl aldehyde to vanillin (S/V) was calculated from the corresponding oxidative products. The yield of the oxidative products from KL and the fractions were summarized in Table 5.| Oxidative products | KL | F1 | F2 | F3 | F4 | Pine KL18 |
|---|---|---|---|---|---|---|
| a N.D. stands for not detected. | ||||||
| Syringaldehyde | 12.2 | 4.2 | 10.0 | 15.5 | 4.1 | N.D. |
| Syringic acid | 6.3 | 7.0 | 8.0 | 3.9 | 1.3 | N.D. |
| 4-Hydroxybenzaldehyde | 1.8 | 1.8 | 0.8 | 1.8 | 13.4 | 0.4 |
| 4-Hydroxybenzoic acid | 1.2 | 2.2 | 2.8 | 0.9 | 3.1 | N.D. |
| Vanillin | 5.7 | 8.5 | 3.2 | 4.0 | 8.1 | 4.3 |
| Vanillic acid | N.D. | N.D. | N.D. | N.D. | 0.4 | 17.3 |
| Total | 27.2 | 23.7 | 24.8 | 26.1 | 29.9 | 22.0 |
It was showed in Table 5 that the total yield of oxidative products of KL was 27.2%, whereas that of fraction F1, fraction F2, fraction F3, and fraction F4 was respectively 23.7, 24.8, 26.1, and 29.9%. Thus, F1 had the highest degree of condensation while the fraction F4 had the least degree of condensation according to the yield of the oxidative products. Compared to pine KL used as a reference, both of yields of the oxidative products of KL and the fractions were higher than that of pine-KL.18 It was proposed that the pine lignin is enriching of G-type lignin and G-type lignin was more preferred than S-type lignin to condense during kraft pulping process. The existence of three aldehydes (syringaldehyde, 4-hydroxybenzaldehyde, and vanillin) and the corresponding acids (syringic acid, 4-hydroxybenzaldehyde, and vanillic acid) indicates that the lignin structure in bagasse was a typical HGS type, which is consistent to the result of FT-IR analysis.
3.7 31P NMR analysis
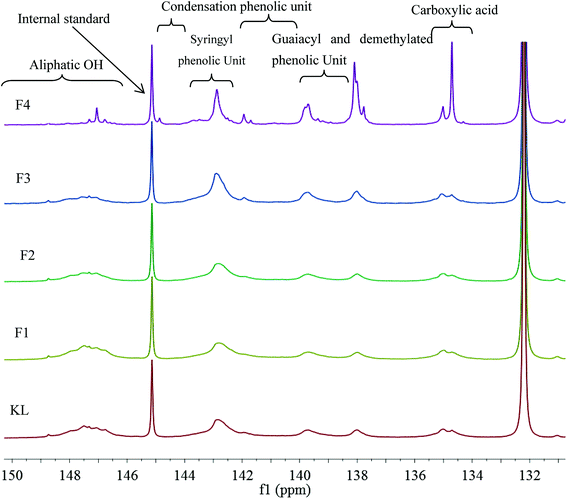
The hydroxyl group, i.e., alcoholic hydroxyl and phenolic hydroxyl, is one of the most important functional groups of lignin, which is also the main active site for the chemical modification of lignin. Therefore, the hydroxyl content was an important part of the lignin molecular structure analysis. The 31P NMR spectra of KL and the fractions are shown in Fig. 4, and the quantitative results are listed in Table 6.| Assignment | δ | Lignin samples (mmol g−1) | ||||
|---|---|---|---|---|---|---|
| KL | F1 | F2 | F3 | F4 | ||
| Aliphatic OH | 146.3–150.8 | 0.71 | 0.92 | 0.44 | 0.28 | 0.27 |
| Condensed phenolic OH | 144.3–140.2 | 1.41 | 1.27 | 1.58 | 1.93 | 1.48 |
| Syringyl OH (S) | 143.7–142.2 | 1.23 | 1.02 | 1.37 | 1.73 | 1.13 |
| Guaiacyl OH | 140.2–138.4 | 0.35 | 0.33 | 0.37 | 0.53 | 0.80 |
| Catechol | 139.0–138.2 | 0.02 | 0.04 | 0.03 | 0.06 | 0.20 |
| p-Hydroxy phenyl (H) OH | 138.6–136.9 | 0.15 | 0.14 | 0.16 | 0.38 | 1.35 |
| Carboxylic acid | 135.6–133.7 | 0.38 | 0.38 | 0.34 | 0.45 | 1.00 |
| Total phenolic OH | — | 1.91 | 1.74 | 2.11 | 2.85 | 3.63 |
Table 6 indicates that the total phenolic hydroxyl content was correlated to the molecular weight of the sample. For example, the total phenolic hydroxyl content of KL was only 1.91 mmol g−1; however, the total phenolic hydroxyl content of F4 was increased to 3.63 mmol g−1, which corresponded to the cleavages of aryl ether bond (β-O-4) of lignin during the kraft pulping process. The cleavage of β-O-4 induced lignin fragmentation and its solubilization in black liquor, and the generation of new phenolic hydroxyl on the lignin fragments.19 The aliphatic hydroxyl content also correlated to the molecular weight of the sample. For instance, the aliphatic hydroxyl content of KL was 0.71 mmol g−1; however, that of F4 was decreased to 0.27 mmol g−1, which was explained by the removal of α- or γ-hydroxyl on the side chain through the formation of methylene quinone intermediate during the kraft process. Similar results have been previously reported.12,32 In addition, the catechol content increased from F1 to F4. For example, the catechol of F1 was only 0.02 mmol g−1. Nonetheless, that of F4 increased to 0.2 mmol g−1 can be explained by the demethylation of lignin during the kraft pulping process.33
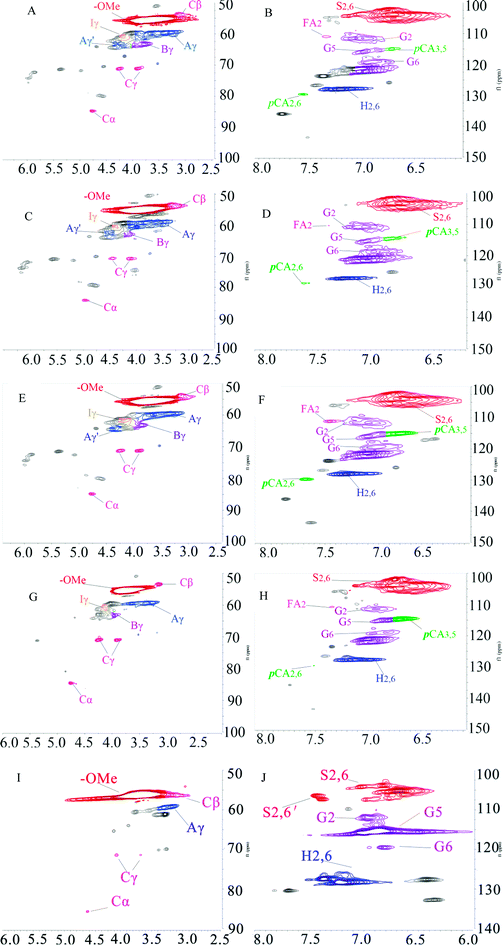
3.8 2D HSQC NMR analyses
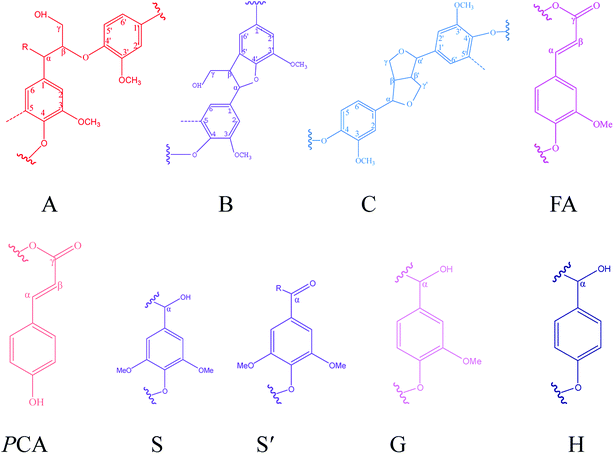
1H–13C HSQC NMR was used to characterize the lignin structure. The 2D HSQC NMR spectrum can be defined as two main regions: the side chain region (δC/δH 50–90/2.5–6.5 ppm) and the aromatic region (δC/δH 100–140/5.5–8.0 ppm), as shown in Fig. 5. The HSQC spectra and main substructures of lignin identified by 2D HSQC NMR are shown in Fig. 5 and 6. The main contours were assigned according to the literature and are summarized in Table 7.34,35| Label | δC/δH | Assignment |
|---|---|---|
| Bβ | 53.3/3.48 | Cβ–Hβ in β–5′ substructures (B) |
| Cβ | 53.5/3.08 | Cβ–Hβ in pinoresinol substructures (C) |
| Aγ | 60.0/3.43 | Cγ–Hγ in β-O-4′ substructures (A) |
| Iγ | 61.3/4.13 | Cγ–Hγ in coniferyl alcohol end groups (I) |
| Bγ | 62.7/3.70 | Cγ–Hγ in β–5′ substructures (B) |
| Cγ | 70.7/3.76 and 4.17 | Cγ–Hγ in pinoresinol substructures (C) |
| Cα | 84.8/4.63 | Cα–Hα in pinoresinol substructures (C) |
| S′2,6 | 106.4/7.31 | C2,6–H2,6 in oxidized (Cα![[double bond, length as m-dash]](https://www.rsc.org/images/entities/char_e001.gif) O) syringyl units (S′) O) syringyl units (S′) |
| S2,6 | 103.8/6.69 | C2,6–H2,6 in syringyl units (S) |
| G2 | 111.0/7.02 | C2–H2 in guaiacyl units (G) |
| G5 | 115.1/6.72 | C5–H5 in guaiacyl units (G) |
| G6 | 119.0/6.77 | C6–H6 in guaiacyl units (G) |
| H2,6 | 127.9/7.01 | C2,6–H2,6 in p-hydroxyphenyl units (H) |
| pCA2,6 | 130.0/7.50 | C2,6–H2,6 in free p-coumaric acid (pCA) |
| pCAα/FAα | 144.1/7.50 | Cα–Hα in free p-coumaric acid (pCA) and ferulic (FA) acids |
| pCA3,5 | 115.5/6.79 | p-Coumarate |
| FA2 | 110.9/7.32 | Ferulate |
| FA6 | 122.5/7.15 | Ferulate |
The peaks at δC/δH 60.0/3.43 ppm and δC/δH 63.1/4.36 ppm were assigned to Cγ of aryl ether (β-O-4 structure) (denoted as Aγ) and Cγ–OH of alkyl-aryl ethers (β-O-4) acylated with pCA, respectively (shown in Fig. 5). The peak at δC/δH 56.2/3.73 ppm was assigned to the methoxyl group. Due to its stability during the kraft pulping process, the methoxyl group content was set as the internal standard for the quantitative analysis of interunit linkages of lignin. The peaks at δC/δH 111.0/7.02 ppm, δC/δH 115.1/6.72 ppm, and δC/δH 119.0/6.77 ppm were respectively assigned to G2, G5, and G6. The peak at δC/δH 103.8/6.69 ppm was assigned to S2/6. The peak at δC/δH 128.0/7.23 ppm was assigned to H2/6. The presence of G-units, H-units, and S-units indicated that sugarcane bagasse lignin is HSG-type lignin which was consistent with the FT-IR analysis. The small signals assigned to FA and pCA were identified (in Fig. 5) because most of the hydroxycinnamic acids were removed during the kraft pulping process.36
The main interunit linkages of the samples were quantified according to the literature,18 and the results are summarized in Table 8. KL had a higher content of condensed linkages, i.e., β–β′ linkages (5.0/100C9) and β–5′ (0.6/100C9) and a lower content of noncondensed linkages, i.e., β-O-4′ (1.3/100C9). It has been suggested that the cleavage of aryl ether bonds (β-O-4′) induced the fragmentation of lignin, and the condensation of the generated lignin fragments occurred during the kraft pulping process.35 Table 8 shows that the fractions had different structures. Compared to KL, F1 and F2 had lower condensed linkages (β–5′ and β–β′) but higher noncondensed linkages (β-O-4′). However, F3 and F4 had higher condensed linkages but lower noncondensed linkages which was consistent with the reported result.20 Compared to aryl ether bond (β-O-4′), the C–C bonds (β–5′ and β–β′) were more stable during the kraft pulping process. Thus, the fragmentation of lignin was induced by the cleavages of β-O-4′ which reduced the molecular weight and increased the phenolic hydroxyl group content of lignin. Consequently, the fraction with a lower molecular weight had higher contents of phenolic hydroxyl group and condensed linkages. For example, the total phenolic hydroxyl group of F4 was 3.63 mmol g−1 (shown in Table 6), and the condensed linkages of F4 were 5.6/100C9 (shown in Table 8). Compared to pine KL as a reference,18 the content of β–5′ was higher than that of sugarcane bagasse lignin. Pine lignin is more enriched of G-type unit than sugarcane bagasse lignin which induced the more of β–5′ linkages in original lignin. Besides G-type lignin possessed more open C5 position which was more prone to condense for new formatting of β–5′ during kraft pulping process.
3.9 Thermal analyses
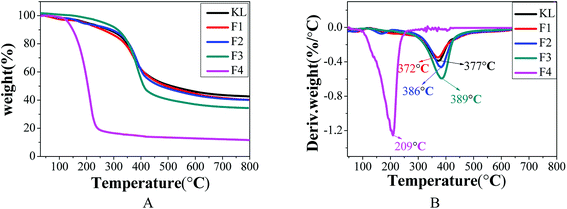
The thermodynamic properties of lignin are important factors affecting its thermochemical conversion to chemicals, energy, or materials. The TGA analysis of KL and the fractions is shown in Fig. 7 and Table 9.| Lignin sample | TM/°C | PDI/Mw/Mn | Residue char/% |
|---|---|---|---|
| KL | 377 | 3.01 | 42.7 |
| F1 | 372 | 2.91 | 40.1 |
| F2 | 386 | 2.70 | 40.1 |
| F3 | 389 | 2.03 | 34.4 |
| F4 | 209 | 1.46 | 13.6 |
Table 9 indicates that the “coke residue” of KL, F1, F2, F3, and F4 at 800 °C was 42.7, 40.1, 40.1, 34.4, and 13.6%, respectively. Fractions F1 and F2 with the highest residual coke yields may be more valuable than the other fractions in the production of activated carbon or carbon fiber with lignin as the carbon precursor.31 The decomposition curves of KL and the fractions were different, which indicated the heterogeneity of the kraft lignin. The maximum decomposition temperatures (TM) of KL, F1, F2, F3, and F4 were respectively 377, 372, 386, 389, and 209 °C. According to previous reports, the lignin with higher the molecular weight possessed better the thermal stability.9,37 The fraction of F4 with the lowest molecular weight possessing the smallest TM was expected, while the increase in the TM of F1, F2 and F3 with decreasing molecular weight was unexpected. This was explained by that the thermal stability of lignin was not only affected by its molecular weight.29 It was found that the TM of the fractions (F1, F2, and F3) shifted to higher temperatures with reduced polydispersity. The TM of F4 possessed the minimum of 209 °C, although F4 had the lowest polydispersity (PDI = 1.46). However, this was explained by the fact that the molecular weight of F4 was extremely small (Mw = 760).35 In conclusion, the thermal stability of lignin was related not only to its molecular weight but also to its polydispersity.
4. Conclusions
Sugarcane bagasse KL was separated into four fractions (F1, F2, F3, and F4) by sequential solvent fractionation. Afterwards, KL and the fractions were comprehensively characterized by wet chemistry and spectroscopies. The homogeneity of lignin was improved effectively by the sequential solvent fractionation because the fractions possessed specific solubility in different solvents. Compared to KL and F1, F2, and F3, fraction F4 had a relatively lower molecular weight and possessed more methoxyl groups, phenolic hydroxyl groups, and catechol. The thermal properties of lignin were affected by the combination of molecular weight and polydispersity. NBO analysis indicated that F4 possessed the lowest degree of condensation. F1, F2, and F3, TM increased with the decrease in polydispersity. However, F4 possessed the lowest TM but the lowest polydispersity, which can be explained by its lowest molecular weight.Conflicts of interest
There are no conflicts to declare.Acknowledgements
This research was financially supported by the Natural Science Foundation of China (NSFC No. 31400514), Postdoctoral Science Foundation of China (No. 2015M570419), the Foundation of State Key Laboratory of Pulp and Paper Engineering (2015016), and the Foundation of Guangxi Key Laboratory of Clean Pulp & Papermaking and Pollution Control (ZR201805-7).References
- H. J. Huang, S. Ramaswamy, U. W. Tschirner and B. V. Ramarao, Sep. Purif. Technol., 2008, 62, 1–21 CrossRef CAS.
- H. R. Wu, F. G. Chen, Q. H. Feng and X. P. Yue, BioResources, 2012, 7, 2742–2751 CAS.
- W. M. He, W. J. Gao and P. Fatehi, ACS Sustainable Chem. Eng., 2017, 5, 10597–10605 CrossRef CAS.
- N. Tachon, B. Benjelloun-Mlayah and M. Delmas, BioResources, 2016, 11, 5797–5815 CrossRef CAS.
- R. Kaur, S. K. Uppal and P. Sharma, Sugar Tech, 2017, 19, 675–680 CrossRef CAS.
- M. D. Garrison and B. G. Harvey, J. Appl. Polym. Sci., 2016, 133, 1–12 CrossRef.
- J. Lin, T. Yamada, K. Koda and Y. Uraki, BioResources, 2012, 7, 5634–5646 Search PubMed.
- L. Salmén, E. Bergnor, A. M. Olsson, M. Akerstrom and A. Uhlin, BioResources, 2015, 10, 7544–7554 CrossRef.
- H. Hatakeyama and T. Hatakeyama, Adv. Polym. Sci., 2009, 232, 1–63 CrossRef.
- Y. Hirohisa, M. Roland and K. P. Kringstad, Holzforschung, 1987, 41, 171–176 CrossRef.
- M. F. Li, S. N. Sun, F. Xu and R. C. Sun, Sep. Purif. Technol., 2012, 101, 18–25 CrossRef CAS.
- C. Z. Cui, R. K. Sun and D. S. Argyropoulos, ACS Sustainable Chem. Eng., 2014, 2, 959–968 CrossRef CAS.
- P. S. B. dos Santos, X. Erdocia, D. A. Gatto and J. Labidi, Ind. Crops Prod., 2014, 55, 149–154 CrossRef CAS.
- G. H. Wang and H. Z. Chen, Sep. Purif. Technol., 2013, 105, 98–105 CrossRef CAS.
- A. Toledano, A. Garcia, I. Mondragon and J. Labidi, Sep. Purif. Technol., 2010, 71, 38–43 CrossRef CAS.
- A. S. Jönsson, A. K. Nordin and O. Wallberg, Chem. Eng. Res. Des., 2008, 86, 1271–1280 CrossRef.
- T. Dai, S. B. Wu and D. L. Guo, J. Fuel Chem. Technol., 2013, 41, 169–176 CAS.
- Z. J. Hu, X. Y. Du, J. Liu, H. M. Chang and H. Jameel, J. Wood Chem. Technol., 2016, 36, 432–446 CrossRef CAS.
- W. G. Glasser, V. Dave and C. E. Frazier, J. Wood Chem. Technol., 1993, 13, 545–559 CrossRef CAS.
- H. L. Li, X. S. Chai, M. R. Liu and Y. H. Deng, J. Agric. Food Chem., 2012, 60, 5307–5310 CrossRef CAS PubMed.
- L. F. Yang, MPhil, Nanjing Forestry University, 2013.
- A. Granata and D. S. Argyropoulos, J. Agric. Food Chem., 1995, 43, 1538–1544 CrossRef CAS.
- D. S. Argyropoulos, J. Wood Chem. Technol., 1994, 14, 45–63 CrossRef CAS.
- A. Guerra, I. Filpponen, L. A. Lucia, C. Saquing, S. Baumberger and D. S. Argyropoulos, J. Agric. Food Chem., 2006, 54, 5939–5947 CrossRef CAS.
- T. M. Liitia, S. L. Maunu, B. Hortling, M. Toikka and I. Kilpelainen, J. Agric. Food Chem., 2003, 51, 2136–2143 CrossRef PubMed.
- G. Wang and H. Chen, Sep. Purif. Technol., 2013a, 120, 402–409 Search PubMed.
- N. Shukry, S. M. Fadel, F. A. Agblevor and S. F. EI-Kalyoubi, J. Appl. Polym. Sci., 2008, 109, 434–444 CrossRef CAS.
- X. B. Zhao, L. M. Dai and D. H. Liu, J. Appl. Polym. Sci., 2009, 114, 1295–1302 CrossRef CAS.
- A. Moubarik, N. Grimi, N. Boussetta and A. Pizzi, Ind. Crops Prod., 2013, 45, 296–302 CrossRef CAS.
- R. Mörck, H. Yoshida, K. P. Kringstad and H. Hatakeyama, Holzforschung, 1986, 40, 51–60 CrossRef.
- X. Jiang, D. Savithri, X. Y. Du, S. Pawar, H. Jameel, H. M. Chang and X. F. Zhou, ACS Sustainable Chem. Eng., 2017, 5, 835–842 CrossRef CAS.
- X. B. Zhao, L. M. Dai and D. H. Liu, J. Appl. Polym. Sci., 2009, 114, 1295–1302 CrossRef CAS.
- I. Brodin, E. Sjöholm and G. Gellerstedt, Holzforschung, 2009, 63, 290–297 CAS.
- A. T. Martínez, J. Rencoret, G. Marques, A. Gutierrez, D. Ibarra, J. Jimenez-Barbero and J. C. del Rio, Phytochemistry, 2008, 69, 2831–2843 CrossRef PubMed.
- J. Rencoret, G. Marques, A. Martínez, L. Nieto, J. Jimenez-Barbero and J. C. del Rio, Ind. Crops Prod., 2009, 30, 137–143 CrossRef CAS.
- F. Xu, R. C. Sun, J. X. Sun, C. F. Liu, B. H. He and J. S. Fan, Anal. Chim. Acta, 2005, 552, 207–217 CrossRef CAS.
- X. J. Shen, B. Wang, P. L. Huang, J. L. Wen and R. C. Sun, Rsc. Adv., 2016, 6, 45315–45325 RSC.
| This journal is © The Royal Society of Chemistry 2018 |

