DOI:
10.1039/C8RA08990F
(Paper)
RSC Adv., 2018,
8, 42280-42291
Coconut-based activated carbon fibers for efficient adsorption of various organic dyes
Received
30th October 2018
, Accepted 24th November 2018
First published on 19th December 2018
Abstract
In this study, using coconut fibers as raw material, activated carbon fibers were prepared via carbonization and KOH activation processes. The morphology, composition, specific surface area, pore structure and thermal stability of the resulting activated carbon fibers were systematically characterized. It was found that the activation process increases the specific surface area of carbon fibers to a greater extent via formation of a large number of micropores (0.7–1.8 nm) and a certain amount of slit-shaped mesopores (2–9 nm). The specific surface area and the pore volume of the activated carbon fibers reach 1556 m2 g−1 and 0.72 cm3 g−1, respectively. The activation process can also decompose the tar deposits formed after the carbonization process by pyrolysis, making the surface of the activated carbon fibers smoother. To study the adsorption properties of the as-prepared activated carbon fibers, the adsorption capacities and adsorption kinetics of various organic dyes including methylene blue, Congo red and neutral red were investigated. The adsorption capacities of the dyes increased with the increasing initial dye concentrations, and varied greatly with the pH value of the system. In methylene blue and neutral red systems, the adsorption capacities reach the maximum at pH 9, and in the Congo red system, it reaches the maximum at pH 3. The adsorption capacities of the activated carbon fibers in methylene blue, Congo red and neutral red systems reached equilibrium at 150, 120, and 120 min, and the maximum adsorption capacities were 21.3, 22.1, and 20.7 mg g−1, respectively. The kinetics of the adsorption process was investigated using three models including pseudo-first-order, pseudo-second-order and intraparticle diffusion models. The results indicated that the dynamic adsorption processes of coconut-based activated carbon fibers to methylene blue, Congo red and neutral red were all in accordance with the second-order kinetic model, and the equations are as follows: t/Qt = 0.1028 + t/21.3220, t/Qt = 0.1128 + t/21.5982 and t/Qt = 0.0210 + t/20.6612.
1 Introduction
Recently, activated carbon fibers, prepared via carbonization and activation of fibrous raw materials,1–3 have been used as a new material for environmental remediation. Activated carbon fibers can be widely used as decolorizing agents, deodorants, solvent recovery agents and catalyst supports in various fields such as pharmaceutical, food, and chemical industries due to their low cost, tunable pore structures, excellent chemical stability and many processed forms like paper, cloth, blankets, etc.4 According to the feedstock, the activated carbon fiber can be prepared from asphalts, phenolics, synthetic polymers (e.g. polyvinyl alcohol, polyacrylonitrile, polyimide, etc.), lignins and natural plant fibers (e.g. hemp, flax, coconut, etc.).5–7 With regard to the preparation method, activated carbon fibers can be obtained by physical activation (disordered carbon atoms in fibrous materials are oxidized to form pores by etching effect with oxygen, carbon dioxide and water vapor as activators8–10), chemical activation (the pore structure is formed via chemical reactions between carbon atoms and phosphoric acid, potassium hydroxide, zinc chloride, or ammonium sulfate11–13) and physical–chemical complex activation processes (the physical and chemical activation methods are combined to achieve a complementarity in the aspect of pore structure regulation and prime cost manipulation14).
With ever-increasing concerns on environmental pollutions and energy crisis, the feedstock of activated carbon fibers has gradually turned from petroleum resources to biomass-based materials.15,16 Biomass is a promising feedstock for the preparation of activated carbon fibers because of its abundance, environmental friendliness, low cost and good renewability. In addition, using biomass as a feedstock also affords a facile route to tailor the pore structures of the activated carbon fibers.17–19 Coconut fiber is a natural filamentous material extracted from coconut shell, which can be used as ropes, brushes, cushions, mattress and fiber filter due to its abundance, non-toxic nature and good mechanical properties.20–22 In spite of numerous scientific, technological and economic benefits, coconut fibers are unfortunately scarcely utilized in developing countries. Only a small portion of coconut fibers is utilized and most of them are discarded or burnt as fuel.23,24 A large amount of coconut fibers are discarded every year as wastes, which has caused a serious waste of resources. Therefore, if the coconut fiber and its product wastes are transferred into activated carbon fibers, the added-value of these materials can be greatly improved.
In this study, high-performance activated carbon fibers with a high micropore volume and large specific surface area have been prepared using coconut fiber as a precursor via high-temperature carbonization and KOH activation processes. The as-prepared activated carbon fiber was characterized by scanning electron microscopy (SEM), XPS, N2 adsorption–desorption isotherms, and thermogravimetric analysis. The adsorption properties of the activated carbon fiber for various dyes including methylene blue, Congo red and neutral red were further studied. The effects of initial concentration of dye pollutants, solution pH and contact time on the adsorption performance were investigated.
2 Experimental section
2.1 Material and reagents
Coconut fiber was provided by Zhaokuo Purification Equipment Co., Ltd., Shanghai, China. Other chemical reagents were of analytical grade and used as received without further purification.
2.2 Preparation of activated carbon fibers from coconut fibers
The carbonization of coconut fibers was first conducted under 600 °C using a box-type resistance furnace. The sample was placed in a covered ceramic crucible filled with other activated carbon to form an oxygen-free environment. Herein, 10 g of the carbonized coconut palm was mixed with 20 g of KOH ethanoic solution. The mixture was heated and stirred using a heating-magnetic mixer until ethanol was completely evaporated. The dried mixture was placed in a vacuum tube furnace and heated at 900 °C in a nitrogen protection environment for 150 min. The obtained crude product was soaked and rinsed with distilled water for several times and then dried to obtain the coconut fiber-based activated carbon fibers.
2.3 Structural characterization
The microstructure and chemical composition of activated carbon fibers were observed by Quanta 200 scanning electron microscopy (SEM) from Holland FEI Company. Elemental chemical statuses of the prepared samples were observed by K-Alpha+ X-ray Photoelectron Spectroscopy (XPS) from Thermo fisher Scientific. The external surface morphology and defects of activated carbon before and after activation were observed and analyzed at different magnifications. The N2 adsorption–desorption isotherms were recorded using a JW-BK100A specific surface area and pore size analyzer (Beijing JWGB SCI & Tech Co. Ltd) at 77 K. Activated carbon fibers were dried at 300 °C in vacuum for 160 min before analyses. The specific surface area of the sample was determined by the Brunauer–Emmett–Teller and Langmuir methods. The distribution of mesopores was analyzed by the Barrett–Joyner–Halenda method, while that of micropores was analyzed by the t-plot and Horvath–Kawazoe methods. The TGA analyses of the samples were recorded using a STA449F3 synchronous thermal analyzer from NETZSCH Company, Germany. The temperature range is from 25 to 1100 °C and the heating rate is 10 K min−1. High-purity nitrogen gas was purged at a flow rate of 30 mL min−1. Fourier transform infrared (FTIR) spectra were recorded using a VERTEX 70 Fourier transform infrared spectrometer. The activated carbon fibers and KBr were mixed and then compressed into tablets. The FTIR analysis was conducted at a wavelength range of 400–4000 cm−1.
2.4 Study on adsorption properties of activated carbon fibers
The adsorption of three kinds of dye solutions, namely methylene blue, Congo red, and neutral red dye was investigated. Typically, 10 mg of activated carbon fibers were first added into 50 mL of dye solutions with varying initial concentrations. The pH of the mixture was adjusted to a fixed value. The variation in dye concentration was monitored using a 722G visible spectrophotometer. The effects of initial dye concentration, solution pH and contact time on the adsorption performance were investigated. The adsorption capacity (Qe) was calculated using eqn (1):25where C0 (mg L−1) is the initial concentration of dye solution, Ce (mg L−1) is the residual concentration of dye solution, V (L) is the volume of dye solution, and m (g) is the mass of activated carbon fibers. The adsorption rate was determined using eqn (2):| | |
D = (C0 − Ce)/C0 × 100%
| (2) |
In order to analyze the adsorption kinetics, three kinds of adsorption kinetics models including pseudo-first-order equation, pseudo-second-order equation, and intraparticle diffusion equation were applied as shown in eqn (3)–(5):26
| |
Pseudo-first-order equation: ln(Qe − Qt) = ln![[thin space (1/6-em)]](https://www.rsc.org/images/entities/char_2009.gif) Qe − K1t Qe − K1t
| (3) |
where
Qt is the adsorption capacity at time
t (min),
Qe (mg g
−1) is the equilibrium adsorption capacity, and
K1 is the constant of quasi-first-order equation.
| | |
Pseudo-second-order equation: t/Qt = 1/(K2Qe2) + t/Qe
| (4) |
where
K2 is the constant of quasi-second-order equation.
| | |
Intraparticle diffusion equation: Qt = Kpt1/2 + C
| (5) |
where
Kp is the constant of particle diffusion constant and
C is the experimental constant.
3 Results and discussion
3.1 Microstructure and chemical composition of the carbon fibers
From the SEM images shown in Fig. 1a1–a3, it can be observed that the carbonized coconut fiber presents a filamentous morphology with strip axial arrangement, and that a few longitudinal grooves and many irregular particles are distributed on the fiber surface. The SEM images shown in Fig. 1b1–b3 reveal that the surface of activated carbon fiber is smoother after activation. More holes and pits are noted. Some axial wedge fractures are also observed because of high-temperature pyrolysis and activation, but the longitudinal texture and porosity of coconut biochar are still retained. It is concluded that the particles on carbonized coconut fiber are carbon species formed from the pyrolysis oil.27 In the activation process, KOH can corrode the surface carbon species and result in the formation of numerous micropores and large specific surface areas under high temperatures.28
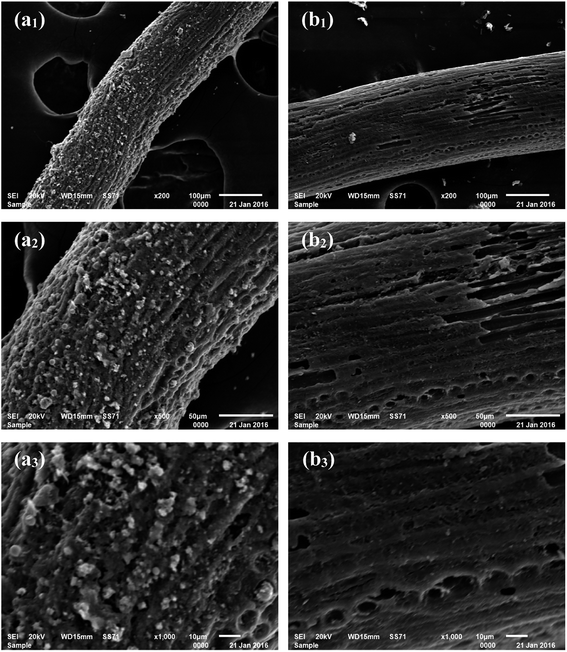 |
| | Fig. 1 SEM images of carbonized coconut fibers (a1–a3) and activated carbon fibers (b1–b3) at different magnifications. | |
In order to analyze the changes in the elemental components before and after activation of carbon fibers, the EDS spectra of point I and point II were analyzed, respectively. The results shown in Fig. 2 indicate that carbon fibers before and after activation all contained different contents of carbon, oxygen and potassium elements. The carbonated coconut fibers still retained high levels of oxygen and potassium because the raw material itself contained these two elements. However, the contents of the two elements decreased after activation, which may be due to the partial decomposition of oxygen by secondary high-temperature treatment during activation, and the dissolution and loss of potassium during washing.
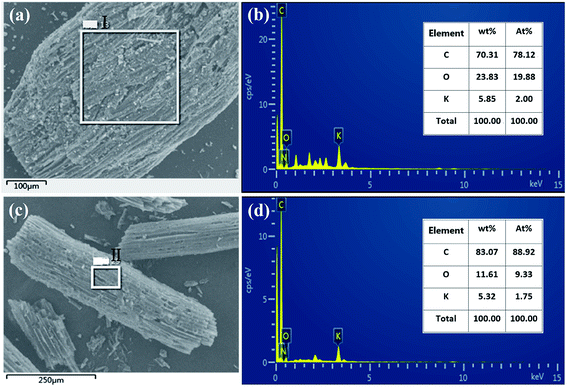 |
| | Fig. 2 EDS spectrum of carbonized coconut fibers (a and b) and activated carbon fibers (c and d). | |
3.2 XPS analysis
The chemical compositions of carbonized coconut fibers and activated carbon fibers were further analyzed by XPS, and the results are shown in Fig. 3. The C1s XPS spectra of the two samples (Fig. 3a and b) exhibited three main peaks with binding energies of around 289, 286 and 285 eV, which correspond to the functional groups of O–C![[double bond, length as m-dash]](https://www.rsc.org/images/entities/char_e001.gif) O, C–O and C–C, respectively.29 For carbonized coconut fibers, the proportions of O–C
O, C–O and C–C, respectively.29 For carbonized coconut fibers, the proportions of O–C![[double bond, length as m-dash]](https://www.rsc.org/images/entities/char_e001.gif) O, C–O and C–C are 14.5%, 19.2% and 66.3%, respectively. For activated carbon fibers, the proportions of O–C
O, C–O and C–C are 14.5%, 19.2% and 66.3%, respectively. For activated carbon fibers, the proportions of O–C![[double bond, length as m-dash]](https://www.rsc.org/images/entities/char_e001.gif) O, C–O and C–C are 19.8%, 32.7% and 47.5%, respectively. Evidently, the proportion of oxygen-containing functional groups increases sharply after KOH activation.
O, C–O and C–C are 19.8%, 32.7% and 47.5%, respectively. Evidently, the proportion of oxygen-containing functional groups increases sharply after KOH activation.
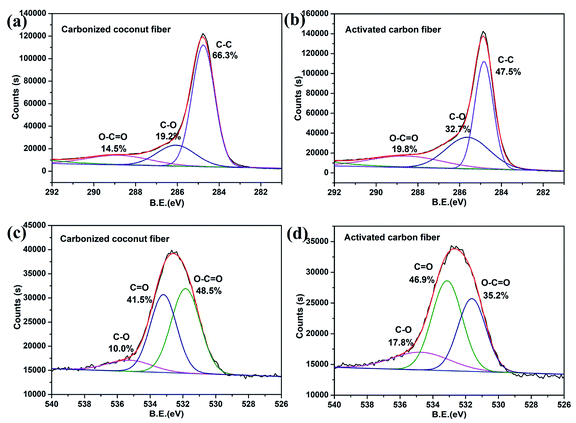 |
| | Fig. 3 XPS diagram about C1S and O1S of carbonized coconut fibers and activated carbon fibers. (a) and (b) are the C1s XPS spectra of the two samples. (c) and (d) are the O1s XPS spectra of the two samples. | |
The O1s XPS spectra of the two samples (Fig. 3c and d) also exhibited three main peaks with binding energies of around 535, 533.5 and 531.5 eV, which correspond to the functional groups of C–O, C![[double bond, length as m-dash]](https://www.rsc.org/images/entities/char_e001.gif) O and O–C
O and O–C![[double bond, length as m-dash]](https://www.rsc.org/images/entities/char_e001.gif) O, respectively.30 For carbonized coconut fibers, the proportions of C–O, C
O, respectively.30 For carbonized coconut fibers, the proportions of C–O, C![[double bond, length as m-dash]](https://www.rsc.org/images/entities/char_e001.gif) O and O–C
O and O–C![[double bond, length as m-dash]](https://www.rsc.org/images/entities/char_e001.gif) O are 10.0%, 41.5% and 48.5%, respectively. For activated carbon fibers, the proportions of O–C
O are 10.0%, 41.5% and 48.5%, respectively. For activated carbon fibers, the proportions of O–C![[double bond, length as m-dash]](https://www.rsc.org/images/entities/char_e001.gif) O, C–O and C–C are 17.8%, 46.9% and 35.2%, respectively. The results also prove that chemical activation can result in increased oxygen content of the carbon material.
O, C–O and C–C are 17.8%, 46.9% and 35.2%, respectively. The results also prove that chemical activation can result in increased oxygen content of the carbon material.
3.3 Analysis of specific surface area and pore characteristics
The specific surface area and pore structures of activated carbon are the key factors to determine its adsorption capacity, and it is often used as an important indicator to characterize the adsorption performance of activated carbon. The parameters of specific surface area and pore structure of the as-prepared activated carbon fiber are listed in Table 1. Nitrogen adsorption–desorption isotherms of activated carbon fiber are shown in Fig. 4. The pore volume of the pore size distribution curve in the HK method is shown in Fig. 5, and the BJH analysis curve of mesoporous pore volume and size distribution is shown in Fig. 6. As can be seen from Table 1, the specific surface area of activated carbon fiber was 1556 m2 g−1, and the pore volume was 0.72 cm3 g−1. The specific surface area of activated carbon is larger, leading to better adsorption performance. Through the analysis of the relevant parameters, it can be observed that the micropore surface area of activated carbon fiber accounted for 78.5% of the total surface area, and that the pore volume of micropores accounted for 68% of the total pore volume. That is, most of the surface area and pore volume of the activated carbon fiber are attributed to the micropores (diameter less than 2 nm). The results indicated that the activated carbon fibers prepared by this method had dominant micropores, which affords an advantage in the adsorption of small molecules.31 Fig. 4 shows the plot of relative pressure P/P0 and adsorbed gas volume. The specific surface areas of coconut fiber and activated carbon fiber are 20.5 m2 g−1 and 1556 m2 g−1, respectively. The results indicate that the specific surface area of the activated carbon fiber was significantly increased after carbonization and KOH activation compared with that of the coconut fiber. Fig. 4 shows the N2 adsorption–desorption isotherm of the as-prepared activated carbon fibers. When the relative pressure P/P0 is less than 0.04, the isotherm rises very quickly, whereas, when P/P0 is between 0.04–0.2, the isotherm slope becomes smaller and there is no significant turning point and platform. It is noteworthy that, at a relative pressure of 0.5, there is a faintly visible hysteresis loop. According to the classification standard of IUPAC,32 the adsorption–desorption isotherms of the activated carbon fibers belong to types I and IV, which indicates that the product is rich in micropores and contains a certain amount of mesopores. In the adsorption process, monolayer adsorption onto micropores plays a decisive role at lower relative pressure region. At higher relative pressure region, multilayer adsorption occurred on activated carbon, where the nitrogen capillary condensation took place in the mesopores, and thus, the mesopores also play an important role in the adsorption of nitrogen.33 From the distribution curve of micropores and mesopores shown in Fig. 5 and 6, it can be observed that the inside of the activated carbon fibers are mainly composed of micropores, which are mainly distributed in the range of 0.7–1.8 nm. The size of mesopores is mainly distributed in the range of 2–9 nm.
Table 1 BET specific surface area and pore texture of the as-prepared activated carbon fiber
| Parameter name |
Parameter value |
Parametric unit |
| BET total specific surface area |
1556 |
m2 g−1 |
| Micropore internal surface area |
1220 |
m2 g−1 |
| Micropore internal percentage |
78.5 |
% |
| Micropore external surface area |
335 |
m2 g−1 |
| Micropore external percentage |
21.5 |
% |
| Langmuir specific surface area |
1715 |
m2 g−1 |
| Total pore volume of adsorption |
0.72 |
cm3 g−1 |
| Micropore volume |
0.49 |
cm3 g−1 |
| Micropore volume percentage |
68.0 |
% |
| External pore volume |
0.23 |
cm3 g−1 |
| External pore percentage |
32 |
% |
| Average pore size of adsorption |
1.87 |
nm |
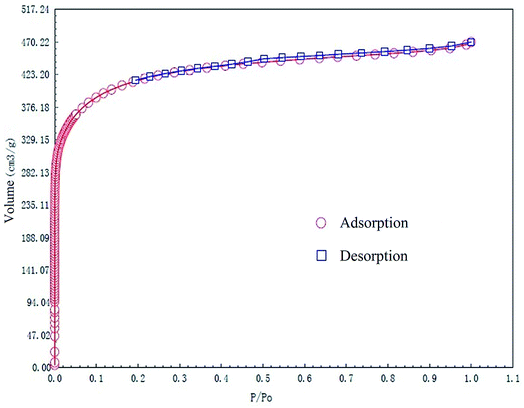 |
| | Fig. 4 N2 adsorption/desorption isotherms of the as-prepared activated carbon fibers. | |
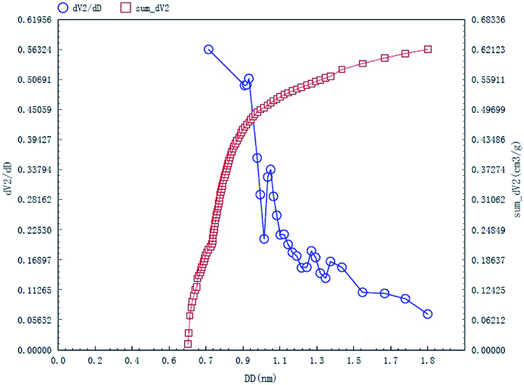 |
| | Fig. 5 HK micropore distribution curves of the as-prepared activated carbon fibers. | |
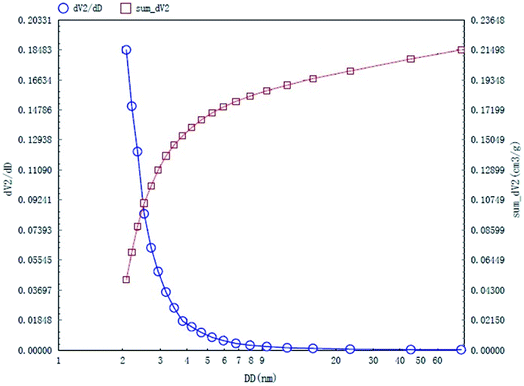 |
| | Fig. 6 BJH mesopore distribution curves of the as-prepared activated carbon fibers. | |
3.4 Thermogravimetric analysis of coconut fibers
Fig. 7 shows the thermal gravimetric analysis (TGA) and the derivative thermogravimetric analysis (DTGA) curves of the coconut fiber from 25 to 1100 °C at a heating rate of 10 K min−1. Throughout the TGA and DTGA curves, the heating pyrolysis process can be divided into three stages, that is, water evaporation stage, devolatilization and combustion stage, and decomposition stage. The details of three stages are discussed as follows: (i) at the first stage, within the temperature range of 25–200 °C, a small weight loss of 8.7% was noted in the TGA curve, which is due to the evaporation of water in the sample. (ii) As the temperature increases from 200 to 360 °C, the reaction goes to the second stage. The volatile components of the coconut fibers were evaporated out, and hence, the sample weight loss reached 41.2%. A mass loss peak is located at 307 °C and the biggest mass change rate of −4.7% per min was observed at this temperature range. (iii) In the third stage of the reaction, the temperature continues to rise, the mass loss rate is 47.8% in the temperature range of 360–480 °C. The maximum mass loss peak is located at 434 °C, corresponding to a mass change rate of −30.3% per min. There are three smaller peaks at this stage. The mass loss at this stage is mainly caused by the decomposition of organics, which accounts for a large proportion of the pyrolysis of fixed carbon. From 480 to 1100 °C, the mass did not change significantly, indicating that the pyrolysis of fixed carbon is almost complete. Based on the above analysis, most of the organics in coconut fiber were burnt when the temperature reached 480 °C, and the carbonization is completed at 600 °C. Thus, the carbonization temperature of coconut fibers was selected to be 600 °C.
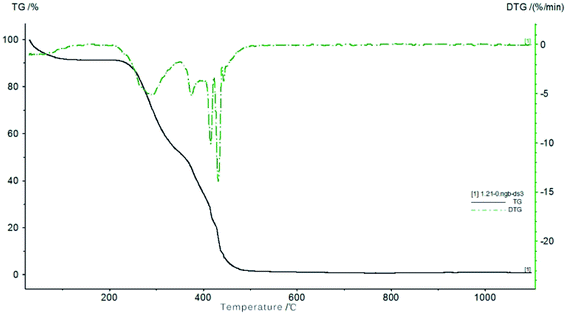 |
| | Fig. 7 TG/DTG curves of coconut fibers. | |
3.5 Fourier transform infrared (FTIR) spectroscopic analysis
The chemical structure and functional groups of activated carbon fibers can be determined by Fourier transform infrared (FTIR) spectroscopy. The FTIR spectra of the coconut carbon fibers before and after the activation are shown in Fig. 8. From Fig. 8, we can see that the characteristic absorption peaks of carbonized coconut fiber and activated carbon fiber both appeared at 3435, 2920, 2850, 1610 and 1115 cm−1. The absorption peak at 3435 cm−1 was assigned to the O–H bond stretching vibration, while those of 2920 cm−1 and 2850 cm−1 were assigned to the C–H bond stretching vibrations.34 The C![[double bond, length as m-dash]](https://www.rsc.org/images/entities/char_e001.gif) C bond stretching vibration in the aromatic ring resulted in an absorption peak at 1610 cm−1, and the absorption peak at 1115 cm−1 was attributed to the stretching vibration of the C–O bond. In addition, the FTIR spectrum of the activated carbon fibers has a weak absorption peak at 873 cm−1, which is attributed to the bending vibration of the C–H bond in the high degree of substitution of the aromatic ring.35 The results indicated that the carbonization of coconut fibers formed the aromatic ring after activation of KOH, and that the hydrogen content in the aromatic ring was replaced by other substituents due to the activation temperature of 900 °C. This is similar to the FTIR spectrum of activated carbon that was prepared from styrene-divinylbenzene at 1000 °C by phosphoric acid activation.34 Overall, the carbonized coconut fibers may contain hydroxyls, –CH2– or –CH3, C
C bond stretching vibration in the aromatic ring resulted in an absorption peak at 1610 cm−1, and the absorption peak at 1115 cm−1 was attributed to the stretching vibration of the C–O bond. In addition, the FTIR spectrum of the activated carbon fibers has a weak absorption peak at 873 cm−1, which is attributed to the bending vibration of the C–H bond in the high degree of substitution of the aromatic ring.35 The results indicated that the carbonization of coconut fibers formed the aromatic ring after activation of KOH, and that the hydrogen content in the aromatic ring was replaced by other substituents due to the activation temperature of 900 °C. This is similar to the FTIR spectrum of activated carbon that was prepared from styrene-divinylbenzene at 1000 °C by phosphoric acid activation.34 Overall, the carbonized coconut fibers may contain hydroxyls, –CH2– or –CH3, C![[double bond, length as m-dash]](https://www.rsc.org/images/entities/char_e001.gif) C, C–O and other chemical groups, and the activated carbon fiber after activation of KOH may contain hydroxyl, –CH2– or –CH3, C
C, C–O and other chemical groups, and the activated carbon fiber after activation of KOH may contain hydroxyl, –CH2– or –CH3, C![[double bond, length as m-dash]](https://www.rsc.org/images/entities/char_e001.gif) C, C–O and a higher degree of substituted aromatic ring and other chemical groups.
C, C–O and a higher degree of substituted aromatic ring and other chemical groups.
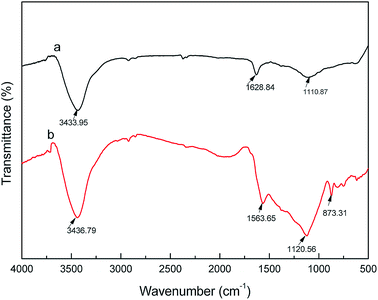 |
| | Fig. 8 FTIR spectra of carbonized (a) coconut fibers and (b) activated carbon fibers. | |
3.6 Adsorption results
The maximum absorption wavelength of methylene blue, Congo red and neutral red aqueous solution was located at 660, 500 and 520 nm, respectively. A series of methylene blue, Congo red and neutral red aqueous solutions were prepared with different concentrations to determine the concentration–absorbance curve of each dye in the corresponding maximum wavelength, and the standard curve equations and the fitting results are shown in Table 2.
Table 2 Fitting parameters of the three dyes
| Dye name |
Fitting curve |
Correlation coefficient R2 |
| Methylene blue |
A = 0.1683C + 0.0065 |
0.9992 |
| Congo red |
A = 0.0078C + 0.0096 |
0.9993 |
| Neutral red |
A = 0.1003C − 0.0478 |
0.9992 |
The effects of initial dye concentration on the adsorption capacity and adsorption rate are shown in Fig. 9. It can be observed that the dye adsorption capacity and adsorption rate of the activated carbon fiber increase with the increasing initial concentration in 120 min. The adsorption on the activated carbon fiber does not reach equilibrium and the adsorption capacity was not saturated when the initial dye concentration was 5 mg L−1 in 120 min. However, it can be observed from the adsorption rate curve that the adsorption rate of methylene blue and neutral red began to slow. If conditions do not change, the initial concentration continue to increase from 5 mg L−1, the sample of methylene blue and neutral red adsorption reached saturation at a certain concentration range, while the adsorption amount of Congo red is still increasing. In addition, when the initial solution concentration, pH and adsorption time of dyes were the same, we found that the adsorption capacity of methylene blue on activated carbon fiber reached the maximum. Comparing the three kinds of dyes, the adsorption rate of methylene blue is significantly greater than those of the other two kinds of dyes, and the difference is evident when the initial concentration is 1 mg L−1.
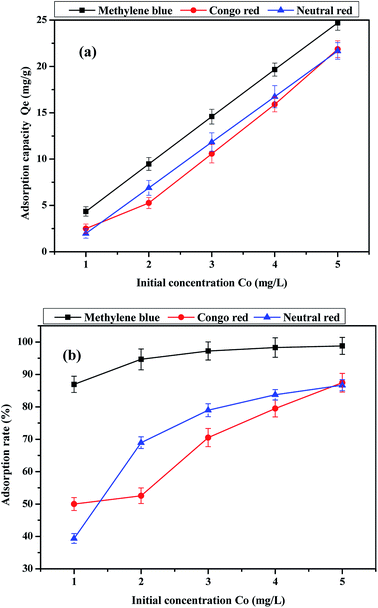 |
| | Fig. 9 Effect of initial concentration of the dye on (a) adsorption capacity and (b) adsorption rate. | |
Usually, the colored ions of the basic dye are cations when the dye molecules are ionized in aqueous solution, and the acid dyes are vice versa (anions). At the same time, methylene blue, Congo red, and neutral red were basic dye, acid dye and less basic dye, respectively. At low pH, coconut fiber-based activated carbon materials mainly have positive charge on their surface, which shows electrostatic repulsion towards methylene blue (cations) and neutral red (cations), while electrostatic adsorption towards Congo red dye (anions). The increase in pH leads to the positive charge of the activated carbon being gradually transformed to the negative charge. In this case, the electrostatic adsorption of activated carbon and Congo red is turned to repulsion, and there is an electrostatic attraction between methylene blue and neutral red. It is reported in some other research that there are two kinds of interaction forces between the activated carbon adsorbent and the compounds containing benzene ring (methylene blue, Congo red and neutral red all contain benzene rings) besides electrostatic adsorption. One is caused by the π–H bond between the hydrogen bond donor on the surface of activated carbon and the aromatic ring in the dyes, while the other is the π–π dispersion force between the base surface of the activated carbon and the benzene ring. In this study, we speculated that these three forces existed in the adsorption process between coconut-activated carbon fibers and the three dyes.36–38 Fig. 10 shows the effect of pH on the adsorption capacity of the three kinds of dye aqueous solution. It can be observed that the effect of pH on the adsorption capacity is evident. On the basic dyes of methylene blue and neutral red, the amount of adsorption increased with the increase in pH, the adsorption capacity reached the maximum when pH = 9. For acid dye of Congo red, the adsorption of Congo red dye on the activated carbon fiber is the largest at pH = 3, and then with the increase in pH, the adsorption capacity decreases. Therefore, the best pH for the adsorption of methylene blue and neutral red by activated carbon fiber was 9, and the best pH for the adsorption of Congo red was 3.
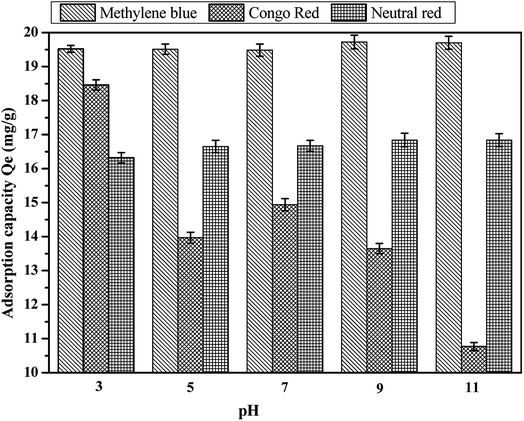 |
| | Fig. 10 Effect of pH on the adsorption capacity: (a) methylene blue, (b) Congo red and (c) neutral red. | |
The effect of adsorption time on the adsorption capacity of the three dyes is shown in Fig. 11. The adsorption capacity of the activated carbon fibers to the three kinds of dyes increased with the extension of adsorption time. The adsorption capacity increased rapidly in the first 20 minutes and the adsorption tended to balance gradually in the latter stage. The adsorption capacities of methylene blue, Congo red and neutral red reached equilibrium at 150, 120, and 120 min, respectively. It is mainly due to a large number of active adsorption sites on coconut-based activated carbon fibers. The early adsorption rate was faster because of the sufficient active sites and the later adsorption rate decreased to equilibrium because of the decrease in active sites. Since the adsorption occurred mainly on the surface of the activated carbon, when a certain amount of dye is adsorbed, the effect of steric hindrance slows down the adsorption rate of the dyes on the activated carbon. In addition, if the molecular weight of the dye increased, the adsorption and the saturated adsorption value of dyes reduce, with the dosage of adsorbent being constant.
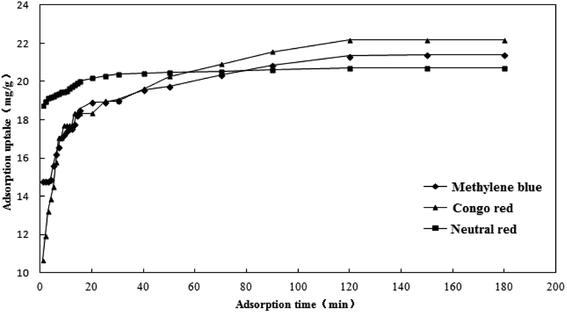 |
| | Fig. 11 Effect of adsorption time on the adsorption capacity. | |
Adsorption kinetic models are often used to describe laws of adsorption. The adsorption kinetics of coconut-based activated carbon fibers was studied based on the above adsorption equilibrium results of methylene blue, Congo red and neutral red dyes. By plotting a graph of processing time T (min) vs. ln(Qe − Qt), the first-order kinetic equation fitting curves can be obtained as shown in Fig. 12. By plotting a graph of processing time T (min) vs. t/Qt, the quasi-second-order kinetic equation fitting curves can be obtained as shown Fig. 13. By plotting the graph of t1/2 vs. Qt, the fitting curve of particle diffusion equation can be obtained as shown in Fig. 14. According to the formulas given above, the calculated kinetic parameters are summarized in Table 3.
 |
| | Fig. 12 Fitting curve of pseudo-first-order equation: (a) methylene blue, (b) Congo red and (c) neutral red. | |
 |
| | Fig. 13 Fitting curve of pseudo-second-order equation: (a) methylene blue, (b) Congo red and (c) neutral red. | |
 |
| | Fig. 14 Fitting curve of intraparticle diffusion equation: (a) methylene blue, (b) Congo red and (c) neutral red. | |
Table 3 Kinetic parameters of the adsorption of dye from activated carbon fiber
| Dyestuff |
Pseudo first order kinetic model |
Pseudo-second-order kinetic model |
Particle diffusion model |
| K1 |
R12 |
Qe |
K2 |
R22 |
Qe |
K3 |
R32 |
Intercept |
| Methylene blue |
0.0328 |
0.9377 |
6.1503 |
0.0214 |
0.9990 |
21.3220 |
0.6991 |
0.8684 |
14.774 |
| Congo red |
0.0274 |
0.8903 |
7.2420 |
0.0190 |
0.9985 |
21.5982 |
1.1002 |
0.7481 |
12.863 |
| Neutral red |
0.0335 |
0.9174 |
1.5148 |
0.1116 |
0.9999 |
20.6612 |
0.2323 |
0.8663 |
18.831 |
The adsorption equilibrium of methylene blue, Congo red and neutral red dye measured from experiment was 21.3, 22.1 and 20.7 mg g−1, respectively. By comparing the theoretical average adsorption amount of Qe and the correlation coefficient of the fitting curve R2 from Table 3, we can see that, under the same condition, relative to the quasi-first-order kinetic equation and intraparticle diffusion model, quasi-second-level dynamic adsorption model is more accurate to describe the dynamic adsorption process of activated carbon fibers for methylene blue, Congo red, and neutral red, in which the corresponding quasi-second-order kinetic equations are t/Qt = 0.1 + t/21.3, t/Qt = 0.11 + t/21.59 and t/Qt = 0.02 + t/20.66, respectively. The correlation coefficient of the quasi-second-stage kinetic equation of neutral red is 0.9999, which showed that conformity degree of adsorption process of activated carbon fiber on neutral red was higher. In addition, the intercept of diffusion equation of neutral red particles was larger, which shows that the adsorption effect on the inner surface was larger. However, the linear fitting of the three dyes to Qt − t1/2 was low, and thus, it shows that the particle diffusion process on activated carbon fiber is not the adsorption rate control step for methylene blue, Congo red and neutral red. The results indicate that complexation, coordination or chelation may occur between the adsorbent and the adsorbate via covalent or electronic exchange, belonging to the chemical adsorption process, and revealing the inherent regularity of adsorption of activated carbon fibers.
4 Conclusions
Activated carbon fibers were prepared using coconut palm fibers as a precursor. It was found that the activation process could effectively increase the specific surface area of carbon materials by forming numerous micro pores and inhibiting the formation and precipitation of tar on the surface of carbon fibers. The specific surface area of the resulting activated carbon fibers was 1556 m2 g−1 and the pore volume reached 0.72 cm3 g−1. The pore sizes of the activated carbon fibers are mainly distributed in the range of 0.7–1.8 nm, and a few mesopores in the range of 2–9 nm are also present. Using methylene blue, Congo red, and neutral red as model pollutants, the adsorption capacities and adsorption rate of the resulting activated carbon fibers increased with the increasing initial dye concentration. Under the same conditions, the adsorption capacity and adsorption rate of methylene blue are the largest as compared with those of Congo red and neutral red. For the adsorption of methylene blue and neutral red, the adsorption capacity increased with the increasing pH. For the adsorption of Congo red, the adsorption capacity showed a decreasing trend with the increasing pH value, and the adsorption capacity reached the maximum when the pH value was 3. The optimal pH values of methylene blue, Congo red and neutral red were 9, 3 and 9, respectively. The adsorption kinetics can be well described by the quasi-second-order reaction model.
Conflicts of interest
There are no conflicts to declare.
Acknowledgements
This study was financially supported by the Project of Technology Research Center for Lingnan Characteristic Fruits & Vegetables Processing and Application Engineering of Guangdong Province (No. [2015]1487), the Project of Food Science Innovation Team of Guangdong Higher Education Institutes (2016KCXTD020). The message of the fund is: Guangdong University of Petrochemical Technology 2018 university-level cultivation project for college students' innovation and entrepreneurship (2018pyA041, 2018pyA045).
References
- X. H. Duan, C. Srinivasakannan, X. Wang, F. Wang and X. Y. Liu, J. Taiwan Inst. Chem. Eng., 2017, 70, 374–381 CrossRef CAS.
- H. K. Son, S. Sivakumar, M. J. Rood and B. J. Kim, J. Hazard. Mater., 2016, 301, 27–34 CrossRef CAS PubMed.
- H. J. Amezquita-Garcia, J. R. Rangel-Mendez, F. J. Cervantes and E. Razo-Flores, Chem. Eng. J., 2016, 286, 208–215 CrossRef CAS.
- K. Xie, K. Zhang, Y. Han, K. Yuan, Q. Song, J. G. Wang and B. Wei, Electrochim. Acta, 2016, 210, 415–421 CrossRef CAS.
- X. Wang, Q. Guo and T. Kong, Chem. Eng. J., 2015, 273, 472–480 CrossRef CAS.
- W. Xiao, Z. Wang, C. Miao and X. Yan, Electrochim. Acta, 2016, 216, 467–474 CrossRef CAS.
- Z. Wang, Y. Han, Y. Zeng, Y. Qie, Y. Wang, D. Zheng and Y. Tong, J. Mater. Chem. A, 2016, 4, 5828–5833 RSC.
- E. Frank, L. M. Steudle, D. Ingildeev, J. M. Spörl and M. R. Buchmeiser, Angew. Chem., Int. Ed., 2014, 53, 5262–5298 CrossRef CAS.
- Y. Huang, E. Ma and G. Zhao, RSC Adv., 2015, 5, 70287–70296 RSC.
- J. Li, D. H. Ng, P. Song, C. Kong, Y. Song and P. Yang, Biomass Bioenergy, 2015, 75, 189–200 CrossRef CAS.
- C. H. Kim and B. H. Kim, J. Power Sources, 2015, 274, 512–520 CrossRef CAS.
- Y. Zhao, F. Fang, H. M. Xiao, Q. P. Feng, L. Y. Xiong and S. Y. Fu, Chem. Eng. J., 2015, 270, 528–534 CrossRef CAS.
- S. M. Hong, S. W. Choi, S. H. Kim and K. B. Lee, Carbon, 2016, 99, 354–360 CrossRef CAS.
- N. Díez, P. Álvarez, M. Granda, C. Blanco, R. Santamaría and R. Menéndez, Chem. Eng. J., 2015, 260, 463–468 CrossRef.
- X. Ge, Z. Wu, Z. Wu, Y. Yan, G. Cravotto and B. C. Ye, J. Taiwan Inst. Chem. Eng., 2016, 64, 235–243 CrossRef CAS.
- M. A. Yahya, Z. Al-Qodah and C. Z. Ngah, Renewable Sustainable Energy Rev., 2015, 46, 218–235 CrossRef CAS.
- V. K. Gupta, P. J. M. Carrott, R. Singh, M. Chaudhary and S. Kushwaha, Bioresour. Technol., 2016, 216, 1066–1076 CrossRef.
- A. Jain, R. Balasubramanian and M. P. Srinivasan, Chem. Eng. J., 2016, 283, 789–805 CrossRef CAS.
- H. Tounsadi, A. Khalidi, M. Abdennouri and N. Barka, J. Taiwan Inst. Chem. Eng., 2016, 59, 348–358 CrossRef CAS.
- M. G. Lomelí-Ramírez, S. G. Kestur, R. Manríquez-González, S. Iwakiri, G. B. Muniz and T. S. Flores-Sahagun, Carbohydr. Polym., 2014, 102, 576–583 CrossRef PubMed.
- N. Sarkar, G. Sahoo, T. Khuntia, P. Priyadarsini, J. R. Mohanty and S. K. Swain, Polym. Compos., 2017, 38, 2852–2862 CrossRef CAS.
- P. Staroń, J. Chwastowski and M. Banach, J. Cleaner Prod., 2017, 149, 290–301 CrossRef.
- S. S. Kumar, D. Duraibabu and K. Subramanian, Mater. Des., 2014, 59, 63–69 CrossRef.
- C. L. Hwang, V. A. Tran, J. W. Hong and Y. C. Hsieh, Constr. Build. Mater., 2016, 127, 984–992 CrossRef CAS.
- C. N. Cordeiro, M. S. d Rocha, A. C. Faleiros and I. Koshun, J. Colloid Interface Sci., 2005, 286, 459–461 CrossRef CAS.
- N. Álvarez-Gutiérrez, M. V. Gil, F. Rubiera and C. Pevida, Chem. Eng. J., 2017, 307, 249–257 CrossRef.
- R. Zhang and M. Y. Han, Carbon Tech., 1999, 101(3), 19–21 Search PubMed.
- N. Wei, N. Q. Zhao and W. Jia, J. Mater. Sci. Eng., 2003, 21, 777–780 CAS.
- Z. Li, L. Zhang, B. Li, Z. Liu, Z. Liu, H. Wang and Q. Li, Chem. Eng. J., 2017, 313, 1242–1250 CrossRef CAS.
- Z. Li, X. Hu, D. Xiong, B. Li, H. Wang and Q. Li, Electrochim. Acta, 2016, 219, 339–349 CrossRef CAS.
- C. Shi, J. W. Feng, S. C. Peng and Z. H. Hu, Environ. Chem., 2013, 32, 394–401 CAS.
- F. Rouquerol, J. Rouquerol and K. Sing, Adsorption by powders and porous solids, Academic Press, London, 1999, p. 205 Search PubMed.
- A. M. Warhurst, G. D. Fowler, G. L. Mcconnachie and S. J. T. Pollard, Carbon, 1997, 35, 1039–1045 CrossRef CAS.
- A. M. Puziy, O. I. Poddubnaya, A. M-Alonso, F. Suárez-Garcıa and J. M. D. Tascón, Carbon, 2002, 40, 1493–1505 CrossRef CAS.
- Y. Q. Lu and Z. H. Deng, Practical infrared spectroscopy, Science Press, Beijing, 1989, p. 30 Search PubMed.
- X. X. Yang, H. M. Chen, X. M. Gao and F. Fu, Ion Exch. Adsorpt., 2018, 34, 247–258 Search PubMed.
- L. M. Cotoruelo, M. D. Marqués, F. J. Díaz, R. M. José, J. J. Rodríguez and C. Tomás, Chem. Eng. J., 2012, 184, 176–183 CrossRef CAS.
- Y. Y. Zhou, X. C. Liu, L. Tang, F. F. Zhang, G. M. Zeng, X. Q. Peng, L. Luo, Y. C. Deng and Y. Pang, J. Hazard. Mater., 2017, 333, 80–87 CrossRef CAS PubMed.
|
| This journal is © The Royal Society of Chemistry 2018 |
Click here to see how this site uses Cookies. View our privacy policy here.  Open Access Article
 ab,
Ling-yu Tub,
Yan Lianga,
Qi Chen
 b,
Ze-sheng Li
 b,
Chun-hai Li*ab,
Zhi-hui Wanga and
Wen Lib
![[thin space (1/6-em)]](https://www.rsc.org/images/entities/char_2009.gif) Qe − K1t
Qe − K1t

![[double bond, length as m-dash]](https://www.rsc.org/images/entities/char_e001.gif) O, C–O and C–C, respectively.29 For carbonized coconut fibers, the proportions of O–C
O, C–O and C–C, respectively.29 For carbonized coconut fibers, the proportions of O–C![[double bond, length as m-dash]](https://www.rsc.org/images/entities/char_e001.gif) O, C–O and C–C are 14.5%, 19.2% and 66.3%, respectively. For activated carbon fibers, the proportions of O–C
O, C–O and C–C are 14.5%, 19.2% and 66.3%, respectively. For activated carbon fibers, the proportions of O–C![[double bond, length as m-dash]](https://www.rsc.org/images/entities/char_e001.gif) O, C–O and C–C are 19.8%, 32.7% and 47.5%, respectively. Evidently, the proportion of oxygen-containing functional groups increases sharply after KOH activation.
O, C–O and C–C are 19.8%, 32.7% and 47.5%, respectively. Evidently, the proportion of oxygen-containing functional groups increases sharply after KOH activation.
![[double bond, length as m-dash]](https://www.rsc.org/images/entities/char_e001.gif) O and O–C
O and O–C![[double bond, length as m-dash]](https://www.rsc.org/images/entities/char_e001.gif) O, respectively.30 For carbonized coconut fibers, the proportions of C–O, C
O, respectively.30 For carbonized coconut fibers, the proportions of C–O, C![[double bond, length as m-dash]](https://www.rsc.org/images/entities/char_e001.gif) O and O–C
O and O–C![[double bond, length as m-dash]](https://www.rsc.org/images/entities/char_e001.gif) O are 10.0%, 41.5% and 48.5%, respectively. For activated carbon fibers, the proportions of O–C
O are 10.0%, 41.5% and 48.5%, respectively. For activated carbon fibers, the proportions of O–C![[double bond, length as m-dash]](https://www.rsc.org/images/entities/char_e001.gif) O, C–O and C–C are 17.8%, 46.9% and 35.2%, respectively. The results also prove that chemical activation can result in increased oxygen content of the carbon material.
O, C–O and C–C are 17.8%, 46.9% and 35.2%, respectively. The results also prove that chemical activation can result in increased oxygen content of the carbon material.![[double bond, length as m-dash]](https://www.rsc.org/images/entities/char_e001.gif) C bond stretching vibration in the aromatic ring resulted in an absorption peak at 1610 cm−1, and the absorption peak at 1115 cm−1 was attributed to the stretching vibration of the C–O bond. In addition, the FTIR spectrum of the activated carbon fibers has a weak absorption peak at 873 cm−1, which is attributed to the bending vibration of the C–H bond in the high degree of substitution of the aromatic ring.35 The results indicated that the carbonization of coconut fibers formed the aromatic ring after activation of KOH, and that the hydrogen content in the aromatic ring was replaced by other substituents due to the activation temperature of 900 °C. This is similar to the FTIR spectrum of activated carbon that was prepared from styrene-divinylbenzene at 1000 °C by phosphoric acid activation.34 Overall, the carbonized coconut fibers may contain hydroxyls, –CH2– or –CH3, C
C bond stretching vibration in the aromatic ring resulted in an absorption peak at 1610 cm−1, and the absorption peak at 1115 cm−1 was attributed to the stretching vibration of the C–O bond. In addition, the FTIR spectrum of the activated carbon fibers has a weak absorption peak at 873 cm−1, which is attributed to the bending vibration of the C–H bond in the high degree of substitution of the aromatic ring.35 The results indicated that the carbonization of coconut fibers formed the aromatic ring after activation of KOH, and that the hydrogen content in the aromatic ring was replaced by other substituents due to the activation temperature of 900 °C. This is similar to the FTIR spectrum of activated carbon that was prepared from styrene-divinylbenzene at 1000 °C by phosphoric acid activation.34 Overall, the carbonized coconut fibers may contain hydroxyls, –CH2– or –CH3, C![[double bond, length as m-dash]](https://www.rsc.org/images/entities/char_e001.gif) C, C–O and other chemical groups, and the activated carbon fiber after activation of KOH may contain hydroxyl, –CH2– or –CH3, C
C, C–O and other chemical groups, and the activated carbon fiber after activation of KOH may contain hydroxyl, –CH2– or –CH3, C![[double bond, length as m-dash]](https://www.rsc.org/images/entities/char_e001.gif) C, C–O and a higher degree of substituted aromatic ring and other chemical groups.
C, C–O and a higher degree of substituted aromatic ring and other chemical groups.


