DOI:
10.1039/C8RA08016J
(Paper)
RSC Adv., 2018,
8, 42262-42268
The influence of phosphine ligand substituted [2Fe2S] model complexes as electro-catalyst on proton reduction†
Received
27th September 2018
, Accepted 24th November 2018
First published on 19th December 2018
Abstract
To probe the influence of phosphine ligand substitution on the well-known [2Fe2S] model, two new [FeFe]-hydrogenase model complexes with the phosphine ligands, PMe3 or P(CH3O)3, were synthesized, such as μ-(SCH(CH2CH3)CH2S)–Fe2(CO)5PMe3 1, and μ-(SCH(CH2CH3)CH2S)–Fe2(CO)5P(CH3O)3 2 Confirmation of structures was provided by FTIR, 1H NMR, 13C NMR, 31P NMR, elemental analyses and single-crystal X-ray analysis. The crystal structure of complex 2 shows that the P(CH3O)3 ligand has less steric effect on the coordination geometry of the Fe atom than the PMe3 ligand. In the presence of HOAc in CH3CN solution, the hydrogen evolution overpotentials of complexes 1 and 2 were 0.91 V and 0.81 V, respectively. Comparatively, complex 2 produces hydrogen at an overpotential of 0.1 V, lower than that for complex 1. A further electrocatalytic study showed the maximum charges for 1 and 2 were 31.3 mC and 56.3 mC at −2.30 V for 10 min, respectively. These studies showed that the complexes 1 and 2 have the ability, as novel electrocatalysts, for catalysis of hydrogen production, and complex 2 has better electrocatalytic ability than complex 1.
Introduction
Hydrogen (H2) is an ideal energy source. The route of energy production from hydrogen is environmental friendly, and therefore, is considered as a long-term sustainable energy option.1 Hydrogenase is a general term for a metalloenzyme that can reversibly cleave or regenerate hydrogen, which is found in microorganism.2 Hydrogenases can be divided into three categories according to different contents of the central metal elements, namely [Fe]-hydrogenases, [FeFe]-hydrogenases and [NiFe]-hydrogenases.3–5 Through spectroscopic and crystallographic studies, [FeFe]-hydrogenases were considered to have the best catalytic hydrogen production performance.6 The structure of [FeFe]-hydrogenases was elucidated by high-resolution X-ray crystallography analysis in the end of the last century.7 The X-ray structural studies disclosed that the active site of [FeFe]-hydrogenases (H-cluster) consists of a diiron unit coordinated by a bridging dithiolate, terminal carbonyls and cyanide ligands.8 From then onwards, scientists began to simulate the structure and function of the active centers of [FeFe]-hydrogenases. Many research groups have designed and synthesized a number of [2Fe2S] model complexes based on the structure of natural [FeFe]-hydrogenases by changing the types of bridging dithiolates or by introducing different ligands, such as P-donor ligands,9 N-donor ligands,10 S-donor ligands11 and N-heterocyclic carbene.12 Among them, the phosphorus ligands are easy to obtain at favorable prices. Due to the lone pair electrons on the phosphorus atom, the phosphorus ligands have strong coordination ability, which can transform into very stable complexes with transition metals. Additionally, their electronic effects are much like cyanides, hence it is advantageous to synthesize model compounds that are closer to natural hydrogenases.13–16 Based on the excellent properties of phosphorus ligands, many researchers have introduced a variety of different phosphorus compounds, including monodentate phosphorus ligands, bidentate phosphorus ligands and nitrogen-doped phosphorus compounds, for example, triphenylphosphine, tricyclohexylphosphine,17 Ph2P–R–PPh2 [R = –CH2CH2– (dppe), Z–CH![[double bond, length as m-dash]](https://www.rsc.org/images/entities/char_e001.gif) CH– (dppv), 1,2-C6H4 (dppb), –CH2CH2CH2– (dpp), ferrocenyl (dppf), naphthalenyl (dppbn)],18 and PNP ligands (PNP = (Ph2P)2NR; R = (CH2)3Me, (CH2)3NMe2, (CH2)3Si(OEt)3, C6H5, C6H4OMe-p, and C6H4CO2Me-p).19 Studies of such model complexes have drawn much attention since then. It is interesting to study the influence of different phosphine ligands on the active site of [FeFe]-hydrogenase model complexes. It is also important to find a new [2Fe2S] model complex, which can stimulate hydrogen production in the same way as natural metalloenzymes.
CH– (dppv), 1,2-C6H4 (dppb), –CH2CH2CH2– (dpp), ferrocenyl (dppf), naphthalenyl (dppbn)],18 and PNP ligands (PNP = (Ph2P)2NR; R = (CH2)3Me, (CH2)3NMe2, (CH2)3Si(OEt)3, C6H5, C6H4OMe-p, and C6H4CO2Me-p).19 Studies of such model complexes have drawn much attention since then. It is interesting to study the influence of different phosphine ligands on the active site of [FeFe]-hydrogenase model complexes. It is also important to find a new [2Fe2S] model complex, which can stimulate hydrogen production in the same way as natural metalloenzymes.
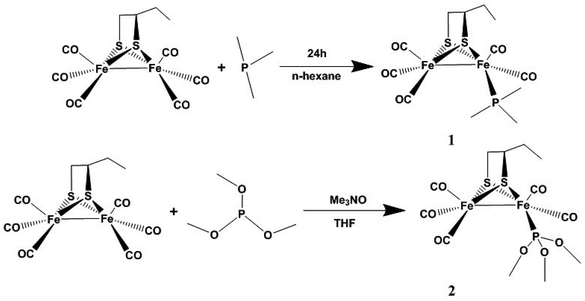
With this aim, we selected our previously reported synthetic complex μ-(SCH(CH2CH3)CH2S)–Fe2(CO)6 as the parent complex.20 To explore the effects of phosphine ligand changes on the [FeFe]-hydrogenase model complexes, particularly the electronic and catalytic properties, our group designed two new [FeFe]-hydrogenase model complexes with the phosphine ligands PMe3 or P(CH3O)3, namely μ-(SCH(CH2CH3)CH2S)–Fe2(CO)5PMe3 1 and μ-(SCH(CH2CH3)CH2S)–Fe2(CO)5P(CH3O)3 2, respectively. These complexes will help us better understand the practical applications of [2Fe2S] model complexes for the electrochemical generation of molecular hydrogen, as well as the correlations between the complex structure and its hydrogen production capacity.
Results and discussion
Synthesis and characterization of the complexes 1 and 2
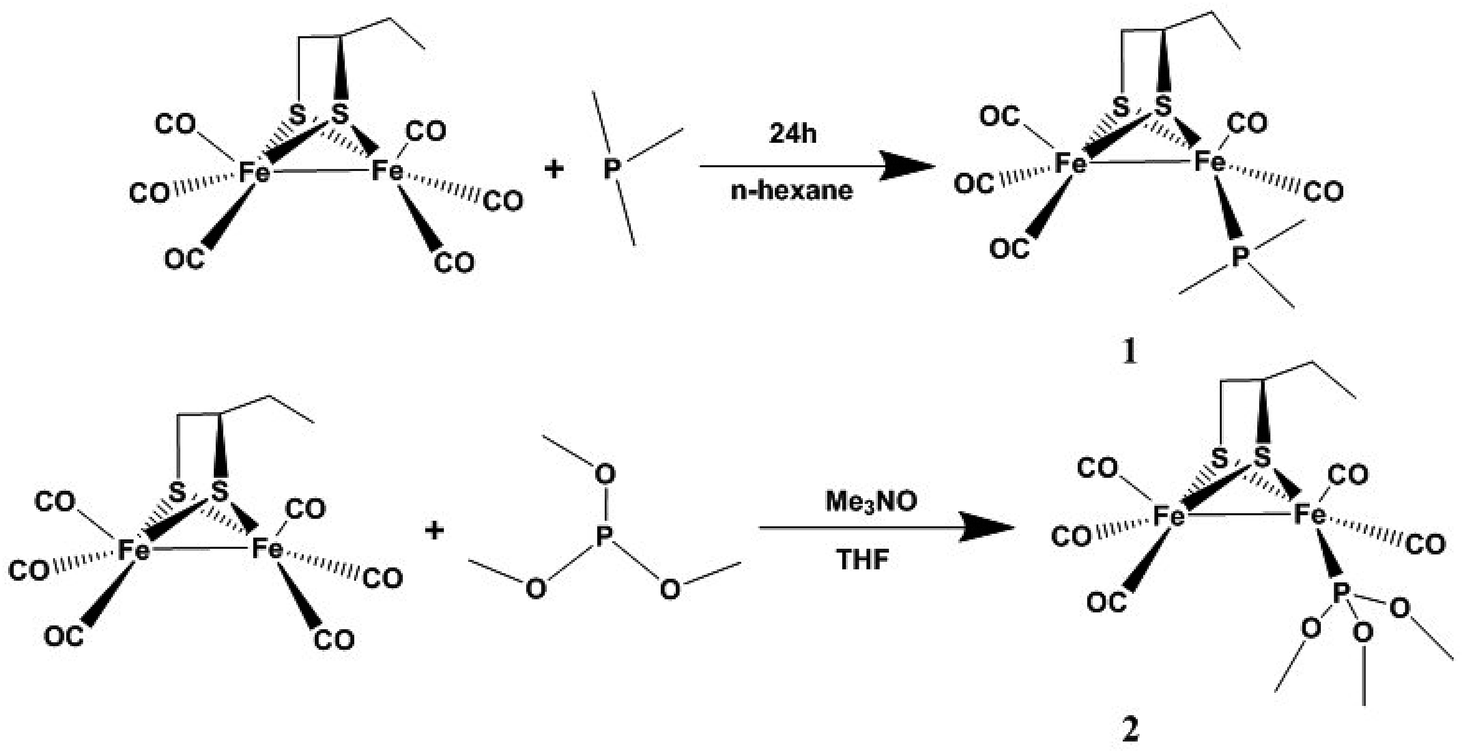
μ-(SCH(CH2CH3)CH2S)–Fe2(CO)6 was prepared according to a previous synthetic method.20 Complex 1 was prepared from the reaction of μ-(SCH(CH2CH3)CH2S)–Fe2(CO)6 and PMe3 in n-hexane at room temperature under N2 (Scheme 1). Complex 2 was obtained from the reaction of μ-(SCH(CH2CH3)CH2S)–Fe2(CO)6 and P(CH3O)3 in THF in the presence of Me3NO at room temperature under N2 (Scheme 1). The complexes were purified by column chromatography on a silica gel column and recrystallized from hexane solutions.
 |
| | Scheme 1 The synthetic routes of compounds 1 and 2. | |
The 1H NMR spectra of complexes 1 and 2 consist of expected signals for the 1,2-butanedithiol bridges and the diverse ligands in the region 0.9–2.7 ppm, shifted slightly upfield compared to the parent complex μ-(SCH(CH2CH3)CH2S)–Fe2(CO)6.20 In the 13C NMR spectra, complexes 1 and 2 show peaks at δ = 211.63, 210.34 and 209.83, 207.53 ppm, respectively. These peaks can be safely assigned to the Fe(CO)3 group or the Fe(CO)2P group. The 31P NMR spectra of 1 and 2 displayed a singlet at δ = 22.82 and 49.75 ppm, respectively.
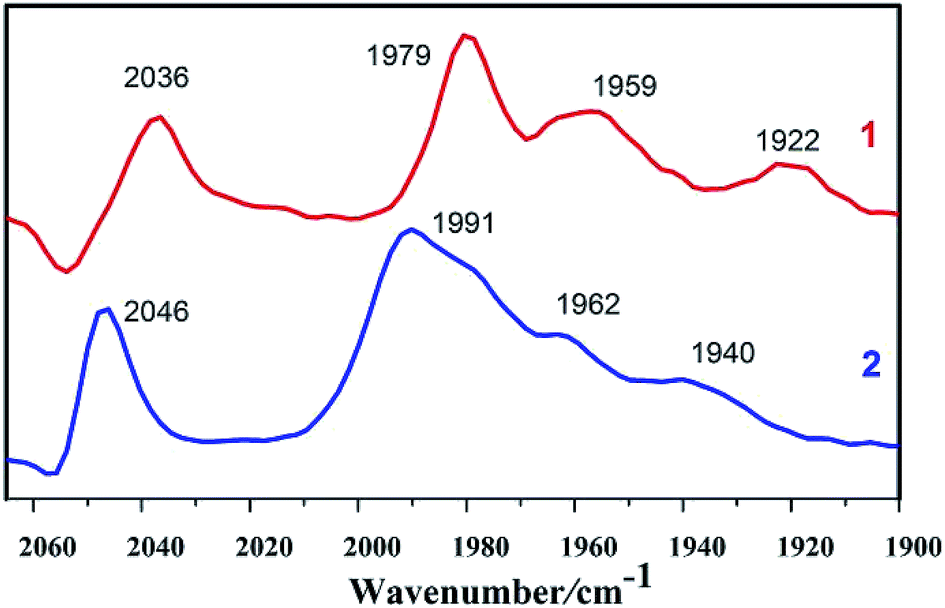
As shown in Fig. 1, IR spectrum of complex 1 in n-hexane solution consists of four characteristic bands at 2036, 1979, 1959, and 1922 cm−1. The CO stretching in complex 1 display a red shift (υCO = 10 cm−1) in comparison to those in complex 2, indicating that the PMe3 group has a stronger electron-donating ability than the P(CH3O)3 group. Electronic influence of the phosphine ligands on the Fe–Fe core is revealed by the IR spectral data. The IR spectra of the complexes indicate that the electron density around the di-iron core decreases in the order 1 > 2.
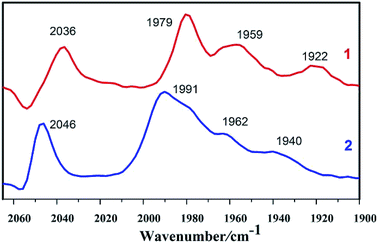 |
| | Fig. 1 IR spectra of complexes 1 and 2 in n-hexane solutions (CO region). | |
The crystal structures of 1 and 2 are shown in Fig. 2; the crystallographic data are shown in Table 1 and the selected bond lengths as well as bond angles are shown in Tables 2 and 3, respectively. The Fe–Fe bond length in complex 1 (2.5235(2) Å) is longer than that in the hexacarbonyl precursor μ-(SCH(CH2CH3)CH2S)–Fe2(CO)6 (2.5091(8) Å).20 Meanwhile, the Fe–Fe bond length in complex 2 (2.4911(13) Å) is shorter than that in the precursor μ-(SCH(CH2CH3)CH2S)–Fe2(CO)6.20 In addition, the Fe–P bond length in complex 2 (2.164(2) Å) is smaller than that of complex 1 (2.2258(3) Å), showing that the P(CH3O)3 ligand offers a smaller steric effect on the coordination geometry of the Fe atom than the PMe3 group.15,16
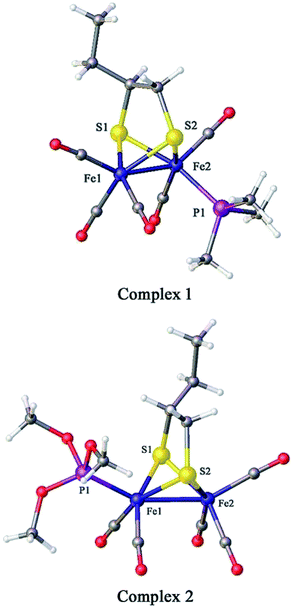 |
| | Fig. 2 Molecular structures of 1 (top) and 2 (bottom) with thermal ellipsoids drawn at 50% probability level. Hydrogen atoms have been omitted for clarity. | |
Table 1 Crystal data and structure refinement for complexes 1 and 2
| Complex |
1 |
2 |
| Empirical formula |
C12H17Fe2O5PS2 |
C12H17Fe2O8PS2 |
| Formula weight |
448.04 |
496.05 |
| Temperature/K |
113.15 |
128 |
| Crystal system |
Orthorhombic |
Monoclinic |
| Space group |
Pbcn |
C2/c |
| a/Å |
23.9678(4) |
11.163(2) |
| b/Å |
11.62457(18) |
14.887(3) |
| c/Å |
12.7424(2) |
23.086(4) |
| α/° |
90 |
90 |
| β/° |
90 |
98.118(3) |
| γ/° |
90 |
90 |
| Volume/Å3 |
3550.25(10) |
3798.1(12) |
| Z |
8 |
8 |
| ρcalc g cm−3 |
1.676 |
1.735 |
| μ/mm−1 |
1.975 |
1.867 |
| F(000) |
1824.0 |
2016.0 |
| Crystal size/mm3 |
0.26 × 0.22 × 0.16 |
0.20 × 0.18 × 0.12 |
| Radiation |
MoKα (λ = 0.71073 Å) |
MoKα (λ = 0.7107 Å) |
| 2θ range for data collection |
3.398 to 57.398 |
3.06 to 25.02 |
| Index ranges |
−32 ≤ h ≤ 32, |
−13 ≤ h ≤ 13, |
| −15 ≤ k ≤ 15, |
−14 ≤ k ≤ 17, |
| −17 ≤ l ≤ 17 |
−27 ≤ l ≤ 27 |
| Reflections collected |
45![[thin space (1/6-em)]](https://www.rsc.org/images/entities/char_2009.gif) 269 269 |
15557 |
| Independent reflections |
4586 [Rint = 0.0205, Rsigma = 0.0096] |
3335 [Rint = 0.0708] |
| Data/restraints/parameters |
4586/0/203 |
3335/192/281 |
| Goodness-of-fit on F2 |
1.034 |
1.078 |
| Final R indexes [I ≧ 2σ(I)] |
R1 = 0.0157, wR2 = 0.0410 |
R1 = 0.0754, wR2 = 0.2036 |
| Final R indexes [all data] |
R1 = 0.0170, wR2 = 0.0415 |
R1 = 0.0768, wR2 = 0.2048 |
| Largest diff. peak/hole/e Å−3 |
0.35/−0.20 |
1.411/−0.599 |
Table 2 Select bond lengths (Å) for complexes 1 and 2
| |
1 |
2 |
| Fe(1)–Fe(2) |
2.5235(2) |
2.4911(13) |
| Fe(1)–S(1) |
2.2387(3) |
2.228(2) |
| Fe(1)–S(2) |
2.2407(3) |
2.247(2) |
| Fe(2)–S(1) |
2.2545(3) |
2.247(2) |
| Fe(2)–S(2) |
2.2701(3) |
2.257(2) |
| Fe(1)–P(1) |
2.2258(3) |
2.164(2) |
Table 3 Select bond angles (o) for complexes 1 and 2
| |
1 |
2 |
| S(1)–Fe(1)–Fe(2) |
56.129(8) |
56.55(6) |
| S(1)–Fe(2)–Fe(1) |
55.534(8) |
55.81(6) |
| S(2)–Fe(1)–Fe(2) |
56.537(8) |
56.62(5) |
| S(2)–Fe(2)–Fe(1) |
55.432(7) |
56.22(5) |
| P(1)–Fe(1)–Fe(2) |
106.465(9) |
154.20(7) |
Cyclic voltammetry study
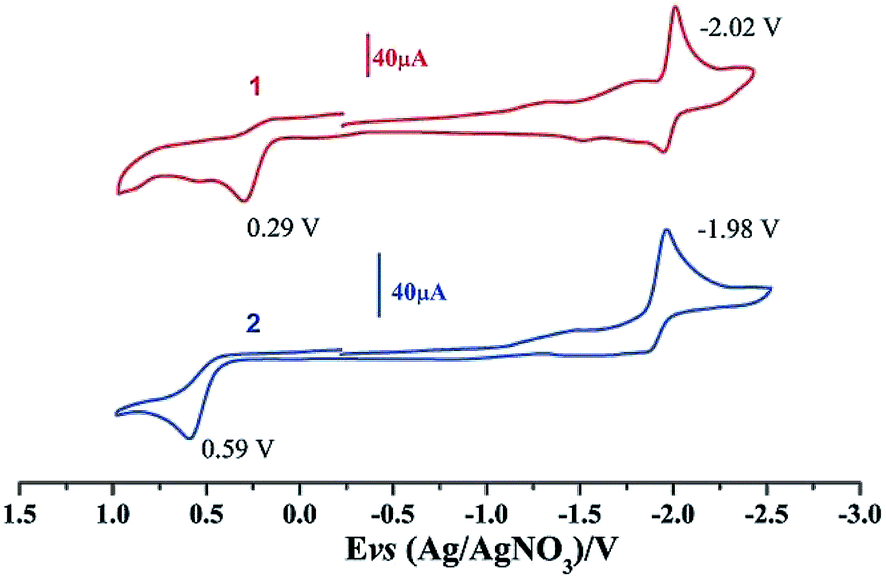
Electrochemical properties of complexes 1 and 2 were researched to assess their redox performances and potentials as electrocatalysts for hydrogen production. To investigate the electrochemical properties of complexes 1 and 2, electroanalytical experiments were done under N2 atmosphere. The cyclic voltammograms of complexes 1 and 2 are presented in Fig. 3. Complex 1 undergoes a quasi-reversible and an irreversible reduction event at ca. −2.02 V and −2.37 V, respectively. CV of complex 2 displays two irreversible reduction events at ca.−1.98 V and −2.28 V. The first reduction is a one-electron process (one metal-centered reduction), which can be assigned to the FeIFeI/FeIFe0 reduction.21 However, the family of phosphine ligands-substituted [FeFe]-hydrogenase model complexes are not usually observed to form an Fe0Fe0 state, so we suppose that the second reduction occurs at a ligand-center forming an FeIFe0 active species.22 The first reduction peak for complex 1 shows a cathodic shift of approximately 60 mV for the FeIFeI/FeIFe0 reduction, as compared to that of the complex 2, and this is consistent with the fact that the PMe3 ligand has a stronger electron-donating ability than the P(CH3O)3 ligand. To determine whether the electrochemical reactions of complexes 1 and 2 are solvent-dependent or gas-dependent, as in the case of analogue complexes,15,16,20 the cyclic voltammetry curves were conducted under CO atmosphere or in CH2Cl2 solution. Indeed, when CO was present or the solvent was changed to CH2Cl2, the reduction peaks of complexes 1 and 2 showed a switch to a two-electron process. Voltammograms of complexes 1 and 2 under CO atmosphere are shown in Fig. 4. Complexes 1 and 2 showed reduction at −2.02 V and −1.98 V, respectively, as shown in Fig. 4. These are ascribed to the process for FeIFeI → Fe0Fe0 reduction.21 In view of these results for the CO control experiments, the second reduction peak detected under N2 is most likely due to the reduction of a new complex, which can be attributed to a coordinated solvent substituted species. As shown in Fig. 5, in CH2Cl2 solution, the cyclic voltammogram data of complexes 1 and 2 reveal only a reduction peak and an oxidation peak versus Ag/AgNO3, which are ascribed to the process of FeIFeI → Fe0Fe0 reduction and the process of FeIFeI to FeIIFeI oxidation, respectively, consistent with the relatively higher electron donating abilities of the ligands. These processes are attributed to the FeIFeI/Fe0Fe0 redox couple of a coordinated solvent substituted species, which is likely to result from a radical chain reaction initiated by the production of a radical anion.
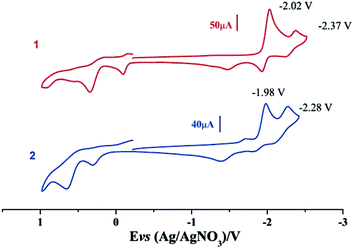 |
| | Fig. 3 Cyclic voltammograms of complexes 1 and 2 in CH3CN under N2 atmosphere (0.1 M n-Bu4PF6, 200 mV s−1 scan rate). | |
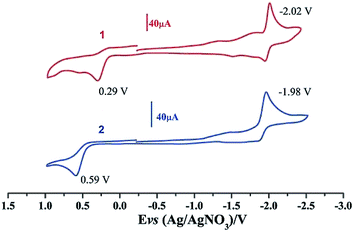 |
| | Fig. 4 Cyclic voltammograms of complexes 1 and 2 in CH3CN solution under CO atmosphere (0.1 M n-Bu4PF6, 200 mV s−1 scan rate). | |
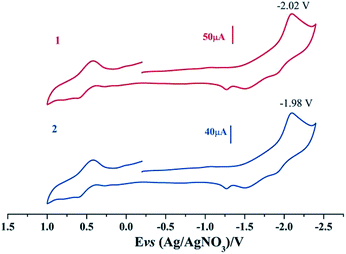 |
| | Fig. 5 Cyclic voltammograms of complexes 1 and 2 in CH2Cl2 solution under N2 atmosphere (0.1 M n-Bu4PF6, 200 mV s−1 scan rate). | |
Catalytic reduction property
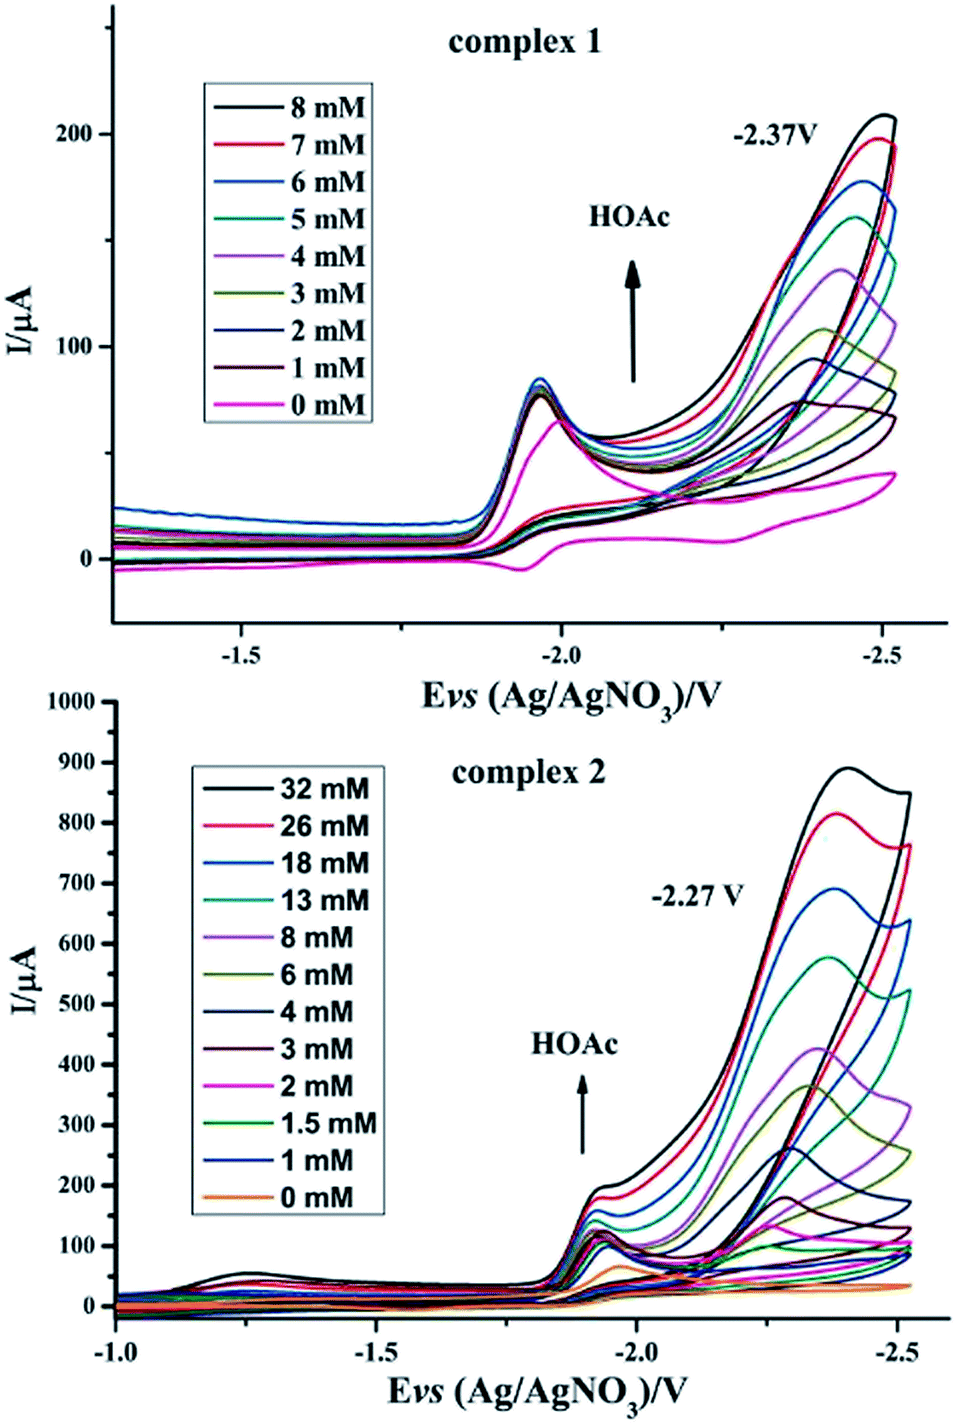
To investigate the possible electrocatalytic activities of complexes 1 and 2, the electrocatalytic property towards H2 production of complexes 1 and 2 was investigated in the presence of HOAc in CH3CN (Fig. 6). In the study of CV of complex 1, HOAc (0–8 mmol) was added continuously and a new reduction potential appeared at −2.37 V vs. Ag/AgNO3, which continuously moved to a more negative potential. The first reduction potential in the CV of complex 1 slightly increased with the addition of HOAc. In contrast, the new peak intensity significantly increased with increased addition of HOAc.23–28 For complex 2, upon the addition of HOAc into the CH3CN solution, a new peak appeared at −2.27 V versus Ag/AgNO3. As with complex 1, this new reduction peak shows an enlargement with the addition of HOAc. According to these observations, it was hypothesized that complexes 1 and 2 can combine with protons and be activated to catalyze H2 production. By calculating the overpotential using the method described by Evans et al.,29 the overpotentials of complexes 1 and 2 are found to be 0.91 V and 0.81 V, respectively. Electrocatalysts with low overpotentials turn out to be more efficient and desirable, indicating that complex 2 has higher electrocatalytic activity.
 |
| | Fig. 6 Cyclic voltammograms of complexes 1 and 2 (1 mM) in CH3CN solution with different amounts of HOAc (0.1 M n-Bu4NPF6) under N2 at room temperature; scan rate, 0.2 V s−1. | |
Especially, to evaluate the electrocatalytic abilities for H2 production catalyzed by complexes 1 and 2 in N2 atmosphere, we used the ratio of catalytic current (icat) to reductive peak current (ip) in the absence of added acid as a marker to compare the electrocatalytic abilities of 1 and 2, where a higher value of icat/ip indicates a higher catalytic activity.30 It can be seen from Table 4 that the icat/ip values of 1 and 2 in N2 atmosphere indicate that complex 2 has a better electrocatalytic activity than complex 1, which is indicative of the considerable influence of phosphine ligands on the redox properties of iron cores in the ligand-substituted diiron dithiolate complexes.31
Table 4 The relevant electrochemical and electrocatalytic data for 1 and 2 in N2 atmosphere
| Complex |
Atmosphere |
Epca (V) |
ip (μA) |
icatb (μA) |
icat/ip |
| All data for 1 and 2 (1 mM) are versus Ag/AgNO3 in 0.1 M n-Bu4NPF6/MeCN at a scan rate of 200 mV s−1. icat is the catalytic current at the highest concentration of HOAc (8 mM). |
| 1 |
N2 |
2.02 |
64.17 |
208.25 |
3.24 |
| 2 |
N2 |
1.98 |
67.14 |
428.51 |
6.21 |
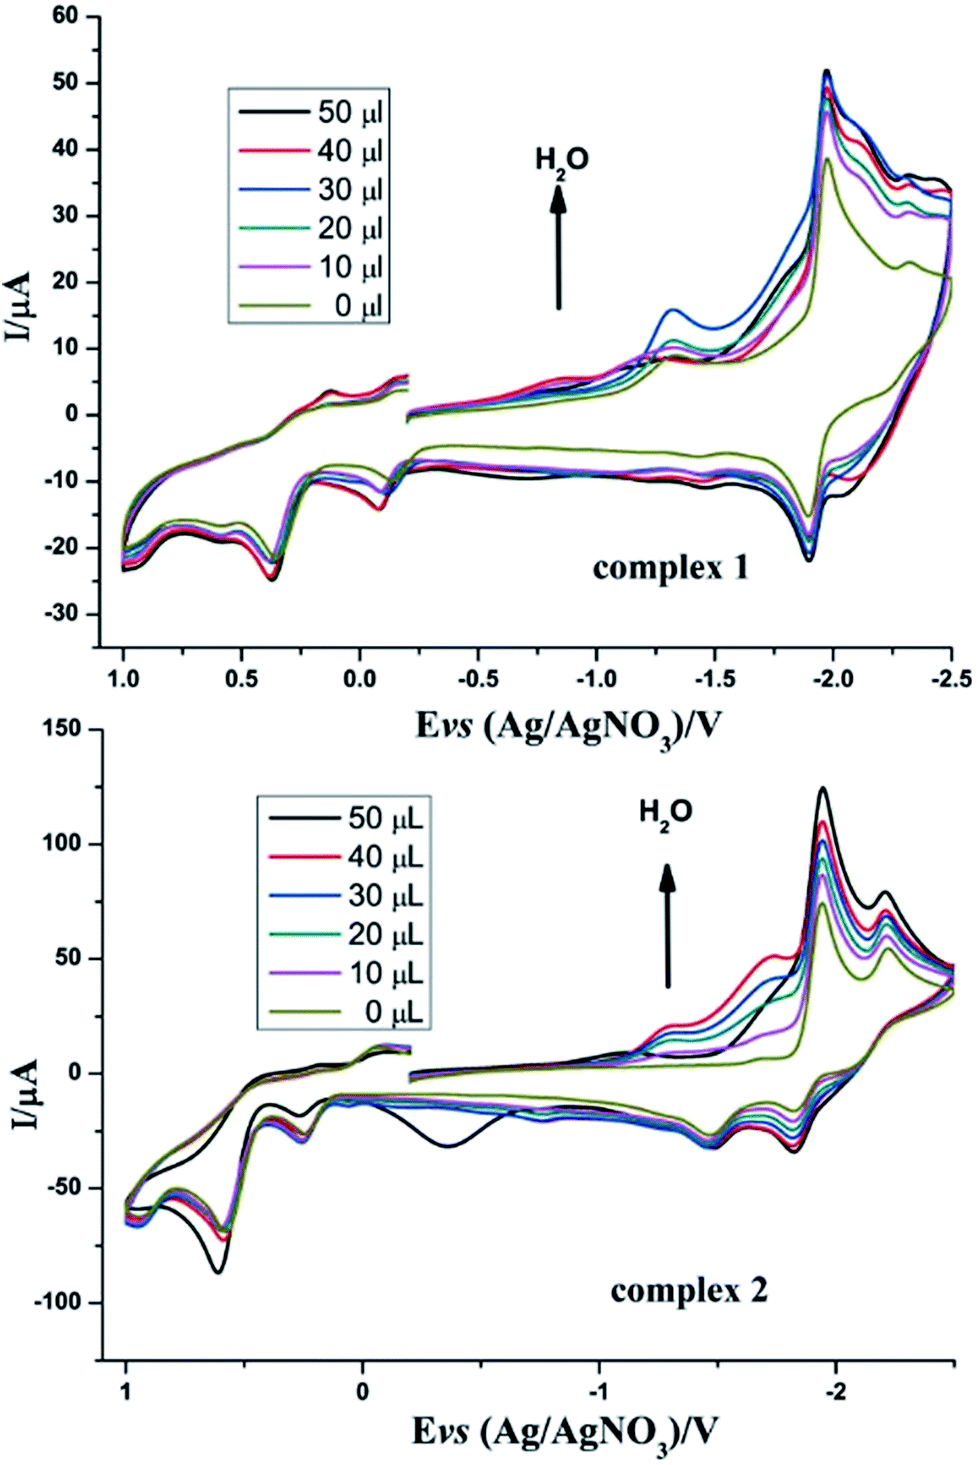
Inspired by the study by DuBois et al.,32 we also tried to explore the catalytic hydrogen evolution in aqueous media. Cyclic voltammetry was carried out in the presence of water in CH3CN. As shown in Fig. 7, following the addition of water to the solution, the reduction peak currents of both complexes 1 and 2 increase as the concentration of H2O increased, and no positive or negative shift is observed in the two reduction peaks. It indicated that complexes 1 and 2 displayed catalytic functions in water for H2 formation. Similarly, to evaluate the electrocatalytic abilities for H2 production of complexes 1 and 2, icat/ip are shown in Table 5. These results also indicate that complex 2 has better electrocatalytic activity than complex 1. Further study of the electrocatalytic ability of complexes 1 and 2 was performed in a double compartment cell, wherein the bulk electrolysis of complexes 1–2 (1 mM) with HOAc (6 mM) was conducted at −2.30 V for 10 min. The maximum charge for 1 and 2 were 31.3 mC and 56.3 mC, respectively.
 |
| | Fig. 7 Cyclic voltammograms of complexes 1 and 2 (1 mM) detailing the effect of H2O on the catalytic proton reduction in CH3CN solution (0.1 M n-Bu4NPF6) under N2 at room temperature; scan rate, 0.2 V s−1. | |
Table 5 The relevant electrochemical and electrocatalytic data for 1 and 2 in N2 atmosphere
| Complex |
Atmosphere |
Epca (V) |
ip (μA) |
icatb (μA) |
icat/ip |
| All data for 1 and 2 (1 mM) are versus Ag/AgNO3 in 0.1 M n-Bu4NPF6/MeCN at a scan rate of 0.2 V s−1. icat is the catalytic current at the highest concentration of H2O (50 μL). |
| 1 |
N2 |
2.02 |
38.62 |
52.38 |
1.35 |
| 2 |
N2 |
1.98 |
73.16 |
125.86 |
1.72 |
Experimental
General methods and materials
Inert (N2) atmosphere and Schlenk line techniques were used for the reactions related to the synthesis of model complexes. μ-(SCH(CH2CH3)CH2S)–Fe2(CO)6 was prepared by the published process. HOAc, CH3CN, n-hexane, CDCl3 and CH2Cl2 were obtained from Guangfu Chemicals (China). These reagents were all deoxygenated and dewatered on each and every occasion before use. Fe(CO)5, trimethylphosphine, trimethyl phosphite, 1,2-butanedithiol, AgNO3, phosphate buffers, ferrocene, n-Bu4NPF6 and other reagents were bought from Sigma-Aldrich. NMR spectra were obtained on a Bruker AVANCE III 400 MHz NMR spectrometer. Solution IR spectra were recorded on a Shimadzu FTIR-8400 spectrometer. Heraeus CHN-Rapid, fully automatic elemental analyzer with TCD detection, type: TMT CHN, BESTELL-NR 2215001, was used for elemental analysis. Using a Rigaku MM-007 diffractometer along with a Saturn 724CCD, the single-crystal X-ray diffraction data were gathered at 113.15 K with a confocal monochromator in Mo-Kα radiation (λ = 0.71073 Å). Data gathering, reduction, as well as absorption rectification were conducted on the CRYSTALCLEAR program.33 Structural issues were addressed by direct approaches in SHELXL-97 program 47 and also refined by SHELXL-97 on F2. Electrochemical measurements in CH3CN solutions (ca. 1 mmol L−1) under N2 were carried out with a three-electrode CHI760B electrochemical workstation.
Synthesis of μ-(SCH(CH2CH3)CH2S)–Fe2(CO)5PMe3 (1)
μ-(SCH(CH2CH3)CH2S)–Fe2(CO)6 (0.21 mmol, 82 mg) and PMe3 (0.23 mmol, 15.6 mg) were mixed in n-hexane solvent (5 mL) under N2 atmosphere. The reaction solution was continuously stirred at ambient temperature under N2 for 24 h. After the solvent was evaporated under vacuum, the crude residue was isolated by column chromatography using n-hexane as eluent. Yield (19.28 mg, 21%). 1H NMR (CDCl3): δ = 0.90, 1.05, 1.28 (d, 3H, CH3), δ = 1.51, 1.52 (d, 9H, CH3), δ = 1.69 (m, 2H, CH2), and δ = 2.46, 2.63 (m, 3H, –CH–CH2–); 13C NMR (CDCl3): δCO at Fe1 = 211.63, δCO at Fe2, Fe–P = 210.34, δdalkyl = 14.04, 30.22, 42.03, 55.75, and δP(CH3)3 = 20.45, 20.74; 31P NMR (400 MHz, CDCl3): 22.82 (s). Elemental anal. calc. (%) for C12H17Fe2O5PS2: C, 32.17; H, 3.82; found (%): C, 32.10; H, 3.78.
Synthesis of μ-(SCH(CH2CH3)CH2S)–Fe2(CO)5P(CH3O)3 (2)
μ-(SCH(CH2CH3)CH2S)–Fe2(CO)6 (84 mg, 0.21 mmol) was dissolved in dry THF (5 mL) under nitrogen, and then Me3NO (24 mg, 0.24 mmol) was added. After stirring at room temperature for 0.5 h, P(CH3O)3 (27 mg, 0.21 mmol) was added and the mixture was continuously stirred for 6 h at room temperature. The solution was evaporated to dryness. The residue was subjected to preparative gel silica column chromatography using n-hexane as the eluent. From the main red band, complex 2 was obtained as a red solid (65.12 mg, 62%). 1H NMR (CDCl3): δ = 0.91, 1.06, 1.30 (d, 3H, CH3), δ = 1.49, 1.53 (d, 9H, CH3), δ = 1.66 (m, 2H, CH2), and δ = 2.47, 2.67 (m, 3H, –CH–CH2–); 13C NMR (CDCl3): δCO at Fe2 = 209.83, δCO at Fe1, Fe–P = 207.53, δdalkyl = 14.17, 29.43, 41.38, 51.90, and dP(CH3)3 = 20.45, 20.74; 31P NMR (400 MHz, CDCl3): 49.75; Elemental anal. calc. for C12H17Fe2O8PS2: C, 29.97; H, 3.45; found: C, 30.06; H, 3.43.
Conclusions
In conclusion, we successfully prepared the complexes μ-(SCH(CH2CH3)CH2S)–Fe2(CO)5PMe3 1 and μ-(SCH(CH2CH3)CH2S)–Fe2(CO)5P(CH3O)3 2. The molecular structures of compounds 1 and 2 were well characterized by spectroscopic methods and X-ray crystallography. Electrochemical studies showed that the complexes 1 and 2, as novel electrocatalysts, have the ability to catalyze hydrogen production from HOAc or H2O.
In the presence of HOAc in CH3CN solution, the hydrogen evolution overpotentials of complexes 1 and 2 were 0.91 V and 0.81 V, respectively. Comparatively, complex 2 produced hydrogen at an overpotential of 0.1 V, lower than that of complex 1. Further study of the electrocatalytic abilities of complexes 1 and 2 was performed in a double compartment cell; the bulk electrolysis of complexes 1 and 2 (1 mM) with HOAc (6 mM) was conducted at −2.30 V for 10 min. The maximum charge for 1 and 2 were 31.3 mC and 56.3 mC, respectively. These results also indicate that complex 2 has better electrocatalytic activity than complex 1. This possibly implies that the steric and electronic character of the [2Fe2S] model complexes with different substituted-ligands might be much closer to the hydrogen production capacity. These will be relevant to the natural metalloenzyme systems and crucial to their potential industrial application. The results derived from complexes with different ligand substitution enable us to develop more efficient bio-inspired catalytic systems based on the geologically-abundant metals.
Conflicts of interest
There are no conflicts of interest to declare.
Acknowledgements
We are grateful to the National Key R&D Program of China (2017YFB0404701) for financial support.
Notes and references
- P. Hoffmann and B. Dorgan, Int. J. Hydrogen Energy, 2002, 3, 16 Search PubMed.
- R. Cammack, Nature, 1999, 397, 214–215 CrossRef CAS PubMed.
- S. Shima and R. K. Thauer, Chem. Rec., 2007, 7, 37–46 CrossRef CAS.
- C. Tard and C. J. Pickett, Chem. Rev., 2009, 109, 2245–2274 CrossRef CAS PubMed.
- T. R. Simmons, G. Berggren, M. Bacchi, M. Fontecave and V. Artero, Coord. Chem. Rev., 2014, 127, 270–271 Search PubMed.
- T. Xu, D. Chen and X. Hu, Coord. Chem. Rev., 2015, 303, 32–41 CrossRef CAS.
- Y. Nicolet, C. Piras, P. Legrand, C. E. Hatchikian and J. C. Fontecillacamps, Structure, 1997, 7, 13–23 CrossRef.
- J. W. Peters, W. N. Lanzilotta, B. J. Lemon and L. C. Seefeldt, Science, 1998, 282, 1853–1858 CrossRef CAS.
- S. Ezzaher, J. F. Capon, F. Gloaguen, F. Y. Petillon, P. Schollhammer and J. Talarmin, Inorg. Chem., 2009, 48, 2–4 CrossRef CAS PubMed.
- S. Ghosh, A. Rahaman, K. B. Holt, E. Nordlander, M. G. Richmond, S. E. Kabir and G. Hogarth, Polyhedron, 2016, 116, 127–135 CrossRef CAS.
- M. Q. Hu, C. B. Ma, X. F. Zhang, F. Chen, C. N. Chen and Q. T. Liu, Chem. Lett., 2006, 35, 840–841 CrossRef CAS.
- J. F. Capon, S. E. Hassnaoui, F. Gloaguen, P. Schollhammer and J. Talarmin, Organometallics, 2005, 24, 2020–2022 CrossRef CAS.
- C. G. Li, Y. Zhu, X. X. Jiao and X. Q. Fu, Polyhedron, 2014, 67, 416–421 CrossRef CAS.
- P. H. Zhao, X. H. Li, Y. F. Liu and Y. Q. Liu, J. Coord. Chem., 2014, 67, 766–778 CrossRef CAS.
- X. F. Liu and X. W. Xiao, J. Organomet. Chem., 2011, 696, 2767–2771 CrossRef CAS.
- X. F. Liu and B. S. Yin, J. Coord. Chem., 2010, 63, 4061–4067 CrossRef CAS.
- M. Lian, J. He, X. Yu, C. Mu, X. Liu, Y. Li and Z. Jiang, J. Organomet. Chem., 2018, 870, 90–96 CrossRef CAS.
- S. Ghosh, S. Basak-Modi, M. G. Richmond, E. Nordlander and G. Hogarth, Inorg. Chim. Acta, 2018, 480, 47–53 CrossRef CAS.
- P. Zhao, Z. Ma, M. Hu, J. He, Y. Wang, X. Jing, H. Chen, Z. Wang and Y. Li, Organometallics, 2018, 37, 1280–1290 CrossRef CAS.
- X. Zhang, T. Y. Zhang, B. Li, G. H. Zhang, L. Hai, X. Y. Ma and W. B. Wu, RSC Adv., 2017, 7, 2934–2942 RSC.
- P. Li, M. Wang, C. He, X. liu, K. Jin and L. Sun, Eur. J. Inorg. Chem., 2007, 23, 3718–3727 CrossRef.
- S. Roy, J. A. Laureanti, T. L. Groy and A. K. Jones, Eur. J. Inorg. Chem., 2017, 23, 2942–2950 CrossRef.
- S. Roy, T. L. Groy and A. K. Jones, Dalton Trans., 2013, 42, 3843–3853 RSC.
- X. H. Zeng, Z. M. Li, Z. Y. Xiao, Y. W. Wang and X. M. Liu, Electrochem. Commun., 2010, 12, 342–345 CrossRef CAS.
- J. Windhager, M. Rudolph, S. Bräutigam, H. Görls and W. Weigand, Eur. J. Inorg. Chem., 2007, 18, 2748–2760 CrossRef.
- G. A. N. Felton, C. A. Mebi, B. J. Petro, A. K. Vannucci, D. H. Evans, R. S. Glass and D. L. Lichtenberger, J. Organomet. Chem., 2009, 694, 2681–2699 CrossRef CAS.
- R. Mejia-Rodriguez, D. Chong, J. H. Reibenspies, M. P. Soriaga and M. Y. Darensbourg, J. Am. Chem. Soc., 2004, 126, 12004–12014 CrossRef CAS PubMed.
- D. Chong, I. P. Georgakaki, R. Mejia-Rodriguez, J. Sanabria-Chinchilla, M. P. Soriaga and M. Y. Darensbourg, Dalton Trans., 2003, 21, 4158–4163 RSC.
- A. K. Vannucci, S. Wang, G. S. Nichol, D. L. Lichtenberger, D. H. Evans and R. S. Glass, Dalton Trans., 2010, 39, 3050–3056 RSC.
- R. X. Li, X. F. Liu, T. Liu, Y. B. Yin, Y. Zhou, S. K. Mei and J. Yan, Electrochim. Acta, 2017, 237, 207–216 CrossRef CAS.
- P. Li, M. Wang, C. J. He, G. H. Li, X. Y. Liu, C. N. Chen, B. Åkermark and L. Sun, Eur. J. Inorg. Chem., 2005, 12, 2506–2513 CrossRef.
- U. J. Kilgore, J. A. S. Roberts, D. H. Pool, A. M. Appel, M. P. Stewart, M. R. DuBois, G. William, W. Dougherty, R. Scott Kassel, M. Bullock and D. L. DuBois, J. Am. Chem. Soc., 2011, 133, 5861–5872 CrossRef CAS PubMed.
-
(a) G. M. Sheldrick, SHELXS-97, University of Göttingen, Göttingen, Germany, 1997 Search PubMed;
(b) O. Dolomanov and H. Puschmann, Acta Crystallogr., 2007, 63, 74–75 Search PubMed.
Footnotes |
| † CCDC 1526197 and 1842131. For crystallographic data in CIF or other electronic format see DOI: 10.1039/c8ra08016j |
| ‡ These authors contribute equally to this work. |
|
| This journal is © The Royal Society of Chemistry 2018 |
Click here to see how this site uses Cookies. View our privacy policy here. 
 Open Access Article
 This Open Access Article is licensed under a Creative Commons Attribution-Non Commercial 3.0 Unported Licence
 *acd,
Shuang Jiang*acd,
Guanghui Zhanga,
Li Haia,
Jingchao Wanga and
Xiao Shaoa
*acd,
Shuang Jiang*acd,
Guanghui Zhanga,
Li Haia,
Jingchao Wanga and
Xiao Shaoa