 Open Access Article
Green and scalable synthesis of 3D porous carbons microstructures as electrode materials for high rate capability supercapacitors
A. Bello *ab,
J. Dangbegnonb,
D. Y. Momodub,
F. O. Ochai-Ejehb,
K. O. Oyedotunb and
N. Manyala
 *b
*b
aDepartment of Materials Science and Engineering, African University of Science and Technology (AUST), Abuja, Nigeria. E-mail: ncholu.manyala@up.ac.za; abello@aust.edu.ng
bDepartment of Physics, Institute of Applied Materials, SARCHI Chair in Carbon Technology and Materials, University of Pretoria, Pretoria 0028, South Africa. Fax: +27 (0)12 420 2516; Tel: +27 (0)12 420 3549
First published on 6th December 2018
Abstract
Porous carbon nanostructures have long been studied because of their importance in many natural phenomena and their use in numerous applications. A more recent development is the ability to produce porous carbon materials with tuneable properties for electrochemical applications, which has enabled new research directions towards the production of suitable carbon materials for energy storage applications. Thus, this work explores the activation of carbon from polyaniline (PANI) using a less-corrosive potassium carbonate (K2CO3) salt, with different mass ratios of PANI and the activating agent (K2CO3 as compared to commonly used KOH). The obtained activated carbon exhibits a specific surface area (SSA) of up to ∼1700 m2 g−1 for a carbon derived PANI![[thin space (1/6-em)]](https://www.rsc.org/images/entities/char_2009.gif) :
:![[thin space (1/6-em)]](https://www.rsc.org/images/entities/char_2009.gif) K2CO3 ratio of 1
K2CO3 ratio of 1![[thin space (1/6-em)]](https://www.rsc.org/images/entities/char_2009.gif) :
:![[thin space (1/6-em)]](https://www.rsc.org/images/entities/char_2009.gif) 6. Moreover, the prepared samples were tested as electrode materials for supercapacitors with the results showing excellent electrical double layer capacitor behavior. Charge storage was still excellent for scan rates of up to 2000 mV s−1, and a capacitance retention of 70% at a very high specific current of 50 A g−1 was observed. Furthermore, the fabricated device can deliver an energy density of 25 W h kg−1 at a specific current of 0.625 A g−1 and a power density of 260 W kg−1 in 1-ethyl-3-methylimidazolium bistrifluorosulfonylimide (EMIM-TFSI) ionic liquid, with excellent rate capability after cycling for 16
6. Moreover, the prepared samples were tested as electrode materials for supercapacitors with the results showing excellent electrical double layer capacitor behavior. Charge storage was still excellent for scan rates of up to 2000 mV s−1, and a capacitance retention of 70% at a very high specific current of 50 A g−1 was observed. Furthermore, the fabricated device can deliver an energy density of 25 W h kg−1 at a specific current of 0.625 A g−1 and a power density of 260 W kg−1 in 1-ethyl-3-methylimidazolium bistrifluorosulfonylimide (EMIM-TFSI) ionic liquid, with excellent rate capability after cycling for 16![[thin space (1/6-em)]](https://www.rsc.org/images/entities/char_2009.gif) 000 cycles at 3.0 V with ∼98% efficiency. These results are promising and demonstrate the electrode's potential for energy storage, leading to the conclusion that K2CO3 is a very good alternative to corrosive activation agents such as KOH in order to achieve high electrochemical performance.
000 cycles at 3.0 V with ∼98% efficiency. These results are promising and demonstrate the electrode's potential for energy storage, leading to the conclusion that K2CO3 is a very good alternative to corrosive activation agents such as KOH in order to achieve high electrochemical performance.
1 Introduction
The energy market is currently dominated by fossil fuels which represents ∼70% of the bulk of energy production.1 However, these sources of energy are also responsible for CO2 emission, a greenhouse gas that is widely considered as the primary contributor to global warming.2 To alleviate this negative impact on our immediate environment, renewable sources of energy have been extensively explored with solar and wind being at the forefront of energy research. However, these technologies depend on a reliable energy storage system which can deliver the energy stored in-demand. Though different types of batteries remain the primary energy storage devices currently used, the continuing technological requirement of high power devices by various emerging industries has exposed the limitation of battery technology in general. In that regard, supercapacitors (SCs) have been proposed as an excellent complement to the battery, showing not only a high power density, but also a longer cycle lifetime than its battery counterpart.3 Furthermore, SCs can surpass batteries if only their energy density can be improved without being detrimental to the unique high power properties which they exhibit. In other words, SCs will move from being complementary to batteries to finally replacing them, if they can deliver high energy and power density without loss of cycle lifetime.4 The major constituent of the SC device is an active material which is carbon-based and the enhancement of the energy density will obligatorily depend on the active material's new design.5 Chemical activation of carbon material remains the cheapest and easiest way of activation. Yet, it makes use of corrosive activation agents such as KOH, ZnCl2 and H3PO4 which pose a threat to human health and the environment. Mild or desirably benign agents should be considered and K2CO3 falls into this category. This particular chemical is not hazardous and is frequently found in our daily foods. It is also present as a reaction intermediate active agent obtained during the KOH activation process via carbonization.6 Adinata et al.,7 prepared activated carbon (AC) from biomass by activation with K2CO3 which exhibits a high SSA of 1170 m2 g−1, but no practical application of the material produced was demonstrated in their work. Furthermore, Yin-Tao Li et al.8 used a mixed KOH and K2CO3 to produce active carbon materials (ACs) from fallen leaves (FLs) and the materials characterizations reveal that the use of single activator such as KOH creates the most of micropores in three dimension and K2CO3 produces the mesopores/macropores mostly in shallow. They also conclude that the combination of both activators leads to enlarged pore sizes of the produced ACs and that the use of K2CO3 can prompt the formation of macropores during the activation procedure and also demonstrated electrochemical measurements with excellent capacitive performance owning to the existence of hierarchical pore channel. The surface areas and hierarchical pore structures are related to the mass ratio of two activators. Sevilla et al.9 reported a green approach of activation of hydrochar with potassium bicarbonate. Their results showed that unlike KOH, K2CO3 activation not only preserves the carbon precursor's original structure, but also that the micropore and mesopore volumes can be easily tuned by prolonging the activation time. It also demonstrated that the use of K2CO3 is predominantly favorable for the development of micropores and mesopores, limiting the formation of macropores which is detrimental to the volumetric capacitance. This broadness in pore development in KOH activation is well explained by Wang et al.6 and was related to the multiple etching and physical activation steps occurring during such processes.The choice of the carbon precursor is also critical in producing the desired activated carbon. The activation agent can interact differently with the source of carbon, thus influencing the composition of the final product. Additionally, the presence of functional nitrogen and oxygen groups on the activated carbon's surface, originating from the carbon source, can be advantageous to the performance of the electrode material. These functional groups can increase the capacitance of the electrode material via additional faradaic reactions. Conducting polymers are very good examples in general, among which polyaniline can be considered as the leading material owing to its cost effectiveness and its easiness to synthesis. It has been used as a faradaic electrode material for SC in numerous reports but its stability upon electrochemical testing is yet to be improved.10–12 As a raw material for the production of AC through pyrolysis/activation, it adds a wealth of functional groups on the resulting carbon's surface which in turn can contribute to the electrochemical activity. For example, Zhou et al.13 produced activated polyaniline-based carbon nanoparticles by polymerization of aniline in the presence of poly(4-styrenesulfonate) prior to chemical activation with KOH and pyrolysis at 700 °C in N2. The produced activated carbon was tested in a two electrode configuration within a potential window of 1 V in 6 M KOH. The result from their work showed an impressive specific capacitance (CSP) of 331 F g−1 at a specific current of 0.2 A g−1, however, only 49% of capacitance retention was observed at a high specific current of 40 A g−1. Li et al.14 electrochemically synthesized polyaniline, which was carbonized at 700 °C and subsequently activated at 450 °C under mixed oxygen and nitrogen. The SSA of the activated carbon was 929 m2 g−1 and the CSP calculated from the cyclic voltammetry (CV) measurement was 285 F g−1 at a scan rate of 2 mV s−1 in 6 M KOH electrolyte. Xiang et al.15 produced AC from PANI with K2CO3 as an activation agent. The carbonization was carried out at 600 °C in N2 flow and the final product showed a SSA of 917 m2 g−1. A CSP value of ∼210 F g−1 was obtained from the CV at a scan rate of 2 mV s−1 in 6 M KOH in a two electrode cell configuration. However, the cell had already lost 14% of its initial capacitance when the scan rate was increased to 20 mV s−1. Thus, the present report therefore undertakes a greener activation procedure using non-hazardous K2CO3 as an activation agent, optimizing the weight ratio of PANI to K2CO3 to produce the AC which could further improve the electrochemical properties of the carbon electrode. The objective of this study is to investigate the applicability limits of porous carbon derived from PANI with K2CO3 as electrodes for SC in the three and two-electrode using 1 M sulphuric acid aqueous electrolyte (H2SO4) and 1-ethyl-3-methylimidazolium bistrifluorosulfonylimide (EMIM-TFSI) ionic liquid. Furthermore, the effect of the PANI/K2CO3 mass ratio on the activated carbon electrode material's electrochemical properties would also be investigated to provide information on the optimum content of the activating agent required for activated carbon from the conducting polymer.
2 Experimental
2.1 Synthesis of polyaniline (PANI)
PANI was prepared with aniline hydrochloride (C6H8ClN) and ammonium peroxydisulfate ((NH4)2S2O8). Briefly, 50 ml of 0.25 M of ((NH4)2S2O8), and 50 ml of 0.2 M (C6H8ClN) were prepared. The former was slowly added to the latter and left to polymerize overnight. The obtained polymer (PANI) was washed thoroughly with deionized water before being dried in an electric oven at 80 °C for 24 h.2.2 Synthesis of porous carbon (AC)
The obtained PANI was then carbonised at 700 °C which was reached by using a slow ramping rate of 2 °C per minute for 2 h. The carbon material obtained was divided into two portions and chemically activated with potassium carbonate (K2CO3). The carbon and the activating agent were mechanically mixed with varying mass ratio of carbon/K2CO3 = 4, and 6. The mass of the active carbon was fixed at constant value, while the ratio of the activating agent was been varied. For example a carbon/K2CO3 = 4 (1![[thin space (1/6-em)]](https://www.rsc.org/images/entities/char_2009.gif) :
:![[thin space (1/6-em)]](https://www.rsc.org/images/entities/char_2009.gif) 4) implies a fixed mass of the carbon while the activating agent is 4 times the mass of the active material. The different mixtures were then transferred into a horizontal tube furnace annealed for 1 h at 850 °C with a ramp rate of 5 °C per minute under nitrogen flow to activate different porosities and increase the surface area. The activated carbon (AC) was then washed with 1 M aqueous HCl to remove the remaining salts and continuously washed with deionized water until a neutral pH was reached followed by drying at 80 °C for 24 h. The different ACs were denoted as AC-4 and AC-6, where the number 4 and 6 represent the carbon/K2CO3 ratio.
4) implies a fixed mass of the carbon while the activating agent is 4 times the mass of the active material. The different mixtures were then transferred into a horizontal tube furnace annealed for 1 h at 850 °C with a ramp rate of 5 °C per minute under nitrogen flow to activate different porosities and increase the surface area. The activated carbon (AC) was then washed with 1 M aqueous HCl to remove the remaining salts and continuously washed with deionized water until a neutral pH was reached followed by drying at 80 °C for 24 h. The different ACs were denoted as AC-4 and AC-6, where the number 4 and 6 represent the carbon/K2CO3 ratio.
2.3 Material characterizations
The scanning electron micrographs (SEM) were acquired using a Zeiss Ultra Plus 55 field emission scanning electron microscope (FE-SEM) working at a voltage of 2.0 kV. Philips CM12 electron microscope with AMT-XR11 at 80 kV, and photographed with an AMT digital camera. Surface area was obtained by the Brunauer–Emmett–Teller (BET) technique from the N2 adsorption isotherm on a Micrometrics TriStar II instrument. Raman measurements were carried out with a Jobin Yvon Horiba TX 6400 micro-Raman Microscope equipped with a cooled charge-coupled device (CCD) detector using a 514 nm laser excitation at a power of 10 mW to avoid thermal excitations/burnout and X-ray diffraction (XRD) studies were carried out using XPERT-PRO diffractometer (PANalytical BV the Netherlands)2.4 Electrochemical measurements
Carbon paper (CP) purchased from FUELCELL store college station Texas USA was used as the current collector (CC) for the preparations of the electrodes because acidic medium (1 M H2SO4) will be used as the electrolyte, which could etch a nickel foam current collector or react with copper or aluminium current collectors. Slurries for the electrodes were prepared in similar manner to our previous work,16 i.e. mixing 80 wt% AC, 10 wt% carbon black and 10 wt% polyvinylidene fluoride (PVDF) binder in N-methyl-2-pyrrolidone (NMP) and subsequently coating on the CP and vacuum dried at 60 °C for 12 h. The electrochemical measurements of a single electrode were investigated in a three-electrode cell configuration, wherein the as-prepared electrode served as the working electrode, platinum as counter electrode, and Ag/AgCl reference electrode. The two-electrode symmetric assembly measurement was done using a Swagelok cell with the AC used as both the positive and negative electrode, with each having a mass of ∼2.0 mg cm−2 and separated by a 0.18 μm thick cellulose filter paper. The ionic liquid electrolyte (EMIM-TFSI) was tested using the coin cell and the electrodes were assembled in a glove box (Inert Technologies, USA, O2 & H2O levels < 1 ppm) with 50 μl of EMIM-TFSI (Solvionic 99.9%) and a filter paper separator. The CV, galvanostatic charge/discharge (GCD) and electrochemical impedance spectroscopy (EIS) measurements were carried out on a VMP300 Bio-Logic instrument (France) at room temperature. The total capacitance (F) of a symmetric SC device is a reflection of the charges stored at a specific voltage and was calculated from the slope of the GCD
 | (1) |
The CS (F g−1) for the single electrode was obtained using:17,18
 | (2) |
 | (3) |
The stability test of the devices was carried out using voltage holding (floating test) as described in previous work.19 Basically, floating test is carried out at a constant current by holding the device at the maximum voltage and estimating the capacitance over the entire period, and this sequence is typically repeated several times.
3 Results and discussion
3.1 Formation mechanism and morphological analysis of the ACs
In a typical synthesis, K2CO3 was used as the activating agent. It is worth noting that K2CO3 starts to decompose at the activation temperature used in this work, i.e. 700 °C, and such a slow decomposition will also gradually release CO2 which with K2CO3 are responsible for the series of reactions below:6| K2CO3 → K2O + CO2 | (4) |
| CO2 + C → 2CO | (5) |
| K2CO3 + 2C → 2K + 3CO | (6) |
| C + K2O → 2K + CO | (7) |
Briefly, the activation process leads to the reduction of K2CO3 to CO2, K, K2O, and CO. The potassium-containing compounds, such as K2O can be reduced by carbon to form K-metal, which can diffuse into the matrix of the carbon materials, thus enlarging existing pores and forming new pore structures.7
Fig. 1 shows the SEM micrographs of the pristine PANI (Fig. 1(a) and (b)) and that of the activated carbon based PANI (Fig. 1(c)–(f)) with different mass ratio of carbon/K2CO3. The micrographs display a granular structure which is not disrupted by the activation procedure. This is in agreement with Sevilla et al.9 findings when similar morphology of the hydrochar and the derived-carbon after activation with potassium carbonate was observed. Compared to KOH activation, the etching already starts at ∼400 °C with generation of H2O vapor and additional carbon etching steps are involved at temperature below 700 °C, which could possibly distort the carbon precursor's structure.
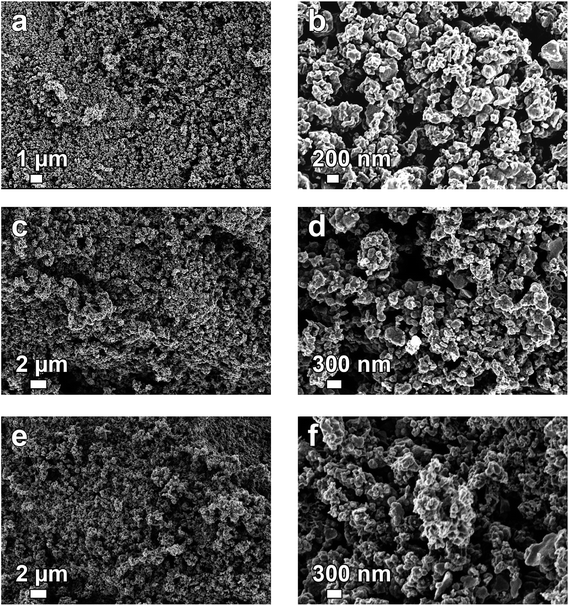 | ||
| Fig. 1 SEM micrographs of (a and b) polyaniline (PANI), (c and d) AC-4, and (e and f) AC-6 at low and high magnifications, respectively. | ||
The TEM results in Fig. 2 show the low and high magnification images of the ACs materials with all the produced carbon nanostructures revealing a porous morphology with a large density of micropore as well as mesopore embedded within the structure of the carbon which we attribute to the activation process. The clear dark spots seen in the image are indicative of the formation of localized clusters of carbon atoms which is typical of an amorphous sample. Such fine size could benefit charge storage by allowing easy ion penetration from the electrolyte to the various active sites within the carbon which will improve the electrochemical performance of the devices fabricated.
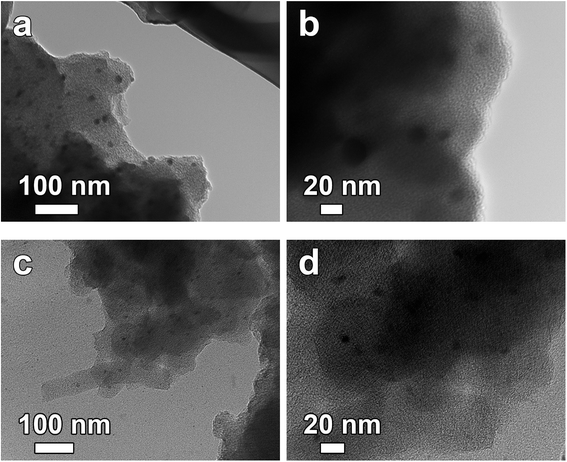 | ||
| Fig. 2 TEM micrographs of (a and b) AC-4, and (c and d) AC-6, at low and high magnifications, respectively. | ||
3.2 Structural characterization of the ACs
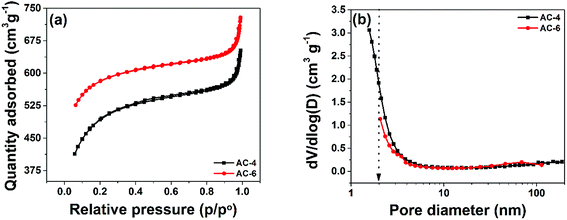
To estimate the pore development during K2CO3 activation, N2 physisorption were performed and the results are shown in Fig. 3. The physisorption isotherms in Fig. 3(a) exhibit a type II signature with H4 hysteresis which implies similar and horizontal curves ascribed to the adsorption/desorption in constricted slit-like pores which is linked with the capillary condensation in any well-developed microporous and mesoporous materials, furthermore, the two samples show similar narrow knee-shaped behaviour, suggesting fine pore size distribution (PSD).20 Fig. 3(b) shows the pore size distribution for the two samples. The behaviour of the curves hints at concentration of pores ∼2 nm and below. This confirms the presence of a fine PSD as suggested in Fig. 3(a). The different parameters extracted from the BET analysis are summarized in Table 1. The SSA and percentage of micropore rise with increasing K2CO3 mass used during activation. AC-6 which has a higher SSA and percentage of micropore volume is preferable for SC application. In addition, micropores are used for charge/ion storage and a high volume of micropores in the samples is expected to increase the charge storage capability of these electrode materials when compared to the AC-4 which has a low micropore volume.| Samples | BET SSA (m2 g−1) | Total pore volume (cm−3) | Micropore volume (cm−3) | % of micropore volume |
|---|---|---|---|---|
| PANI | 51.20 m2 g−1 | 0.1672/g | 0.000266 | — |
AC-4 (1![[thin space (1/6-em)]](https://www.rsc.org/images/entities/char_2009.gif) : :![[thin space (1/6-em)]](https://www.rsc.org/images/entities/char_2009.gif) 4) 4) |
1484.1 | 0.973 | 0.3788 | 38.9 |
AC-6 (1![[thin space (1/6-em)]](https://www.rsc.org/images/entities/char_2009.gif) : :![[thin space (1/6-em)]](https://www.rsc.org/images/entities/char_2009.gif) 6) 6) |
1694.7 | 1.088 | 0.6096 | 55.7 |
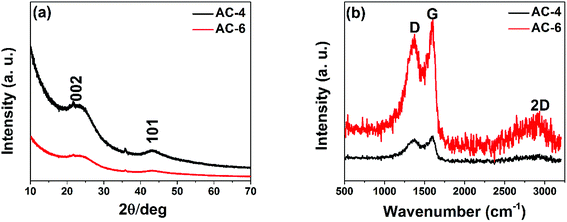
Owing to the structure and effects of graphitic composition on the electrochemical performance of carbon materials, XRD and Raman spectra were conducted to characterize the samples. Fig. 4(a) presents the XRD spectra of the two samples showing peaks identified with graphitic materials. The carbon materials are all amorphous21 in nature displaying broad diffraction peaks at 2θ values of 26° and 44°, which are assigned to typical (002) and (101) planes of graphitic carbon (JCPDS no. 41-1487). Fig. 4(b) is the Raman data confirming graphitic structures of the produced carbon materials as shown in Fig. 4(a). The presence of the D band at ∼1374 cm−1 relates to disordered carbon and is due to the breathing modes of sp2 rings activated through a dual resonance effect in the presence of defects and a G band at ∼1588 cm−1 corresponds to the phonon mode in-plane stretching of the C–C bond in graphitic materials, and a broad 2D band at ∼2700 cm−1 corresponds to the two phonon lattice vibration, which is typical symbol of graphitic carbon.22–24 The high intensity of the D-band and the broad 2D band in the spectra are attributed to the presence of a sizeable amount of defects in the activated carbon. The ratio of the intensity D peak to G peak (ID/IG) is used to determine the degree of crystallization or defects density of carbon materials. The ID/IG values of the two carbon samples are 0.85 and 0.85 respectively. These values are close to unity and confirm that the produced carbons have a low degree of graphitization.
3.3 Electrochemical measurement of the ACs
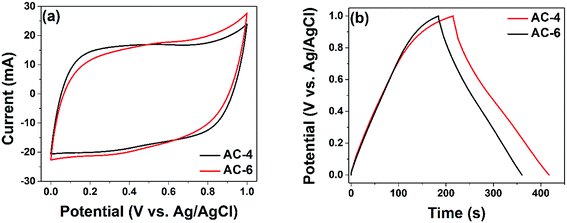
These porous carbons were tested as electrode material for supercapacitor and the results are shown below. Fig. 5 shows the CV of the two materials in three electrode configuration measurements at a sweep rate of 50 mV s−1 and the GCD at a specific current of 1 A g−1, respectively. From the CV presented in Fig. 5(a), quasi-rectangular CVs are observed which is characteristic of an electrical double layer (EDL) formation. Furthermore, the two samples all show similar result with the AC-6 showing a slightly higher capacitance. Fig. 5(b) confirms the EDL behaviour observed in Fig. 5(a). Here, quasi-symmetrical triangular GCD curves are observed. Moreover, the discharge time was also the slight higher for AC-6 electrode material confirming a higher capacitance compared with the latter. The results hint at the influence of the micropore volume on the electrochemical performance of the active material which is intimately related to carbon![[thin space (1/6-em)]](https://www.rsc.org/images/entities/char_2009.gif) :
:![[thin space (1/6-em)]](https://www.rsc.org/images/entities/char_2009.gif) K2CO3 ratio.
K2CO3 ratio.
The electrodes were further tested at different sweep rates ranging from 50 to 2000 mV s−1 in a two electrode symmetric configuration to further ascertain the true performance metrics of these materials for practical applications and the results are shown in Fig. 6(a) and (b). These electrodes still retain their rectangular shape with some small degree of distortion at sweep rate above 200 mV s−1. This demonstrates the fast ion diffusion kinetics and the fast current response on voltage reversal of these cells.13 The good rate capability at high scan rates may be explained by the high ionic conductivity of the electrolyte ions, the sizes of the hydrated sphere of the electrolyte ions and adequate micropores volume which ensure easy diffusivity between the electrodes. This excellent charge storage kinetics could also insinuate good electrochemical parameters, such as small transfer resistances as well as a shorter diffusion length, especially for the AC-6 electrode which exhibited a higher capacitance value.
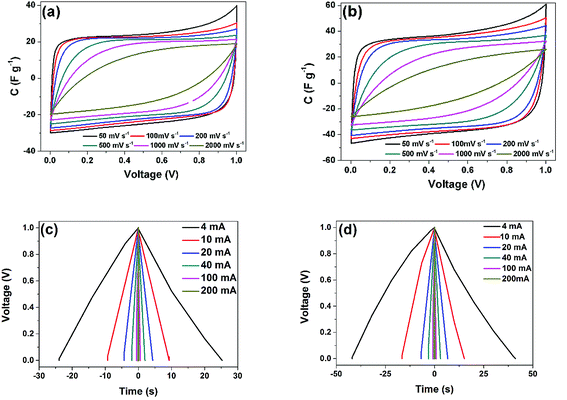 | ||
| Fig. 6 CV at different scan rate from 50–2000 mV s−1 for the two samples (a) AC-4, and (b) AC-6, and GCD at different current 4 mA −200 mA for the two samples (c) AC-4, and (d) AC-6. | ||
The galvanostatic charge discharge (GCD) at different current values from 4–200 mA (1–50 A g−1) were also performed on these electrodes and the results are presented in Fig. 6(c) and (d). The almost symmetrical triangular shape remains for all applied currents depicting the excellent capacitive performance. Furthermore, the discharge time is the shortest for the device fabricated from the AC-4, confirming once more that the high percentage of micropore developed during the activation process for the AC-6 which is responsible for the higher discharge time.
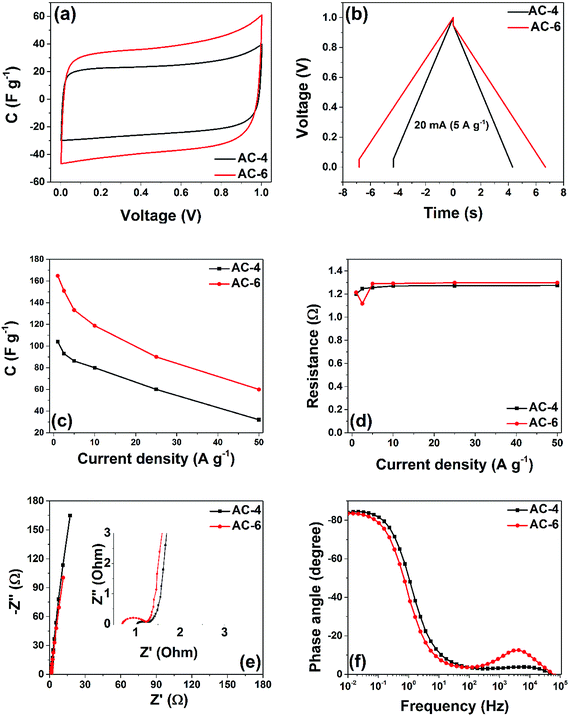
To fully understand the storage mechanism in these electrode materials, additional electrochemical tests were performed and are presented in Fig. 7. All tests were performed in an operating potential window of 1 V. Fig. 7(a) shows the comparison of the CV plots for the two fabricated cells at a scan rate of 50 mV s−1. The highest current response, which could be a reflection of higher specific capacitance (CSP) SC, is observed for AC-6 symmetric cell. The cell show higher discharge times (see Fig. 7(b)), implying higher CSP. The cells were tested by GCD at different specific currents ranging from 1 to 50 A g−1 (4–200 mA) (Fig. 7(c)). The CSP values decrease with increasing specific current. This is due to the limited time given to the ions to access the surface of the electrode material at a high specific current. At 1 A g−1, capacitance values of 100 and 165 F g−1 were calculated for the symmetric cells containing AC-4 and AC-6 electrode materials, respectively.
The AC-6 material displayed a very good capacitive retention, surpassing many electrode materials produced using other comparably high specific current conditions (see Table 2). The obtained result demonstrates the effectiveness of a greener activation method adopted in producing the activated carbon material. This exceptional charge retention for AC-6 cell is not only related to the physical properties mentioned above, but also to some intrinsic properties of the electrode material used to fabricate the cell. One of these properties is the equivalent series resistance (ESR) which comprises (i) the electronic resistance of the electrode material; (ii) the interfacial resistance between the electrode and the current-collector; (iii) the ionic (diffusion) resistance of ions moving in small pores; (iv) the ionic resistance of ions moving through the separator and (v) the electrolyte resistance.25
| Materials | SSA (m2 g−1) | Experimental condition and electrolyte | CSP (F g−1) | Capacitance retention | Ref. |
|---|---|---|---|---|---|
| K2CO3 activation of PANI | 917 | 2-Electrode and 6 M KOH | 210 (2 mV s−1) | 87% at 20 mV s−1 | 15 |
| KOH activation of PANI derived carbon | 2236 | 2-Electrode and 6 M KOH | 280 (0.2 A g−1) | 58% at 40 A g−1 | 13 |
| N2/O2 (5%) activation of carbon derived PANI | 929 | 2-Electrode and 6 M KOH | 283 (0.5 A.g−1) | 86% at 5 A g−1 | 14 |
| KHCO3 activation of hydrochar | >2000 | 2-Electrode and 1 M H2SO4 | 246 (0.5 A g−1) | 54% at 90 A g−1 | 9 |
| ZnCl2 activation of PANI | 824 | 2-Electrode and 6 M KOH | 166 (0.5 A g−1) | 84% at 5 A g−1 | 26 |
| H3PO4 activation of rice straw | 396 | 3-Electrode and 1 M H2SO4 | 112 (2 mV s−1) | 27 | |
| H3PO4/KOH activation of shiitake mushroom | 2988 | 2-Electrode and 6 M KOH | 238 (0.2 A g−1) | 74% (30 A g−1) | 28 |
| NiCl2 activation of kenaf stem | 1480 | 3-Electrode and 1 M H2SO4 | 327 (2 mV s−1) | 85% (100 mV s−1) | 29 |
| ZnCl2/FeCl3 activation of coconut shell | 1874 | 3-Electrode and 6 M KOH | 268 (1 A g−1) | 68% (30 A g−1) | 30 |
| K2CO3 activation of carbon derived PANI | 1696 | 2-Electrode and 1 M H2SO4 | 165 (1 A g−1) | 70% (50 A g−1) | This work |
3.4 Pore size effects on EDLC application
Pore size effect of porous carbon materials is important for applications in electrochemical capacitors, basically due to the fact that EDLC utilizes the adsorption ability of carbon materials, including both physisorption and electrosorption to store charges. The capacitance of carbon can be enhanced significantly when the pore size is suitable to the solvated ions sizes from the electrolytes, of which for instance micropores in general contribute mostly to the capacitance. The two carbon materials presented in this work show different structural properties as shown in Table 1 with the AC-6 showing higher micropore volume which account for the higher electrochemical performance. Meanwhile, the AC-4 has the least micropore volume which account for its low electrochemical performance. Thus, the high surface area, appropriate average pore width and high pore volume of pores of the AC-6 synergistically contribute to the high capacitance values observed. Other key parameter considered in EDCL performance is the fast ions transfer from the electrolyte into materials surface and the fast electrons transfer from bulk the bulk of the electrode to the surface. The presence of mesopores and macroporous and good wettability of the materials guarantee shortest ion transfer giving rise to the fast ions diffusion during electrochemical measurements. The following features of the carbon materials such as its fine nature, the good electro-conductivity, its sp2 configuration as observed from Raman analysis all ensure the fast electron transfer within the electrode material contributing to the good electrochemical performance observed.The resistance is also an important parameter that could influence the performance of the cells. This can be calculated from the IR drop from the GCD curve using eqn (3). Fig. 7(d) shows the ESR at different specific currents. The devices fabricated from both samples exhibited similar ESR values with increasing specific current. These ESR calculated for the devices imply that the ion in the electrolyte can easily diffuse in and out of the active electrode material. Fig. 7(e) shows the EIS of the two devices. The ESR, which is obtained at the intercept of the curve with the Z′-axis, is the smallest for AC-6 cell. Besides, this device exhibits the short diffusion length which is linked to the small size of the particle. In addition, all the cells display capacitive behaviour with a phase angle of ∼ −83°, close to −90° for an ideal capacitor (Fig. 7(f)). Furthermore, the peak appearing in the higher frequency region shifted toward a higher frequency for the device from the AC-6, implying a lower resistance encountered by the electrolyte ions penetrating the electrode.31
Floating test which consists of sequential GCD and holding of the cell at its maximum operating voltage for a long period of time was also done to investigate the stability and ageing effect of these cells. Fig. 8(a) shows the variance of the cell's CSP at 1 A g−1 over a floating time of 100 h. The decrease in the CSP value is very small, hinting at a negligible degradation of the cell after 100 h of ageing. This also signifies the presence of a rigid micropores framework which does not deteriorate upon ageing. To further understand the possible cause of such a trend, the ESR was calculated after each sequence of GCD and the results are shown in Fig. 8(b). A steep increase in the ESR value is noticed for AC-4 cell after the third sequence, while this increase was more moderate in AC-6 cell. These results mimic the behaviour in Fig. 8(a).
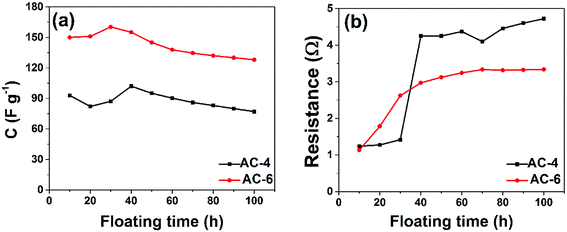 | ||
| Fig. 8 Comparison of the (a) specific capacitance and (b) resistance vs. floating time for AC-4, and AC-6 symmetric cells. | ||
CV curves of the two cells after the ageing experiment were plotted to study the effect of ageing of these cells (Fig. 9(a) and (b)). A rectangular shape still remains for AC-4 and AC-6 cells with a small drop in the capacitance value. The slight deviation from rectangular behaviour is attributed to electro-sorption of protons on the surface of the nanostructures. It may also arise from the functional groups of the carbon material's surface. The comparative CV's clearly shows that voltage holding or floating test (aging) does not have a significant degradation effect on the electrodes of the symmetric device.
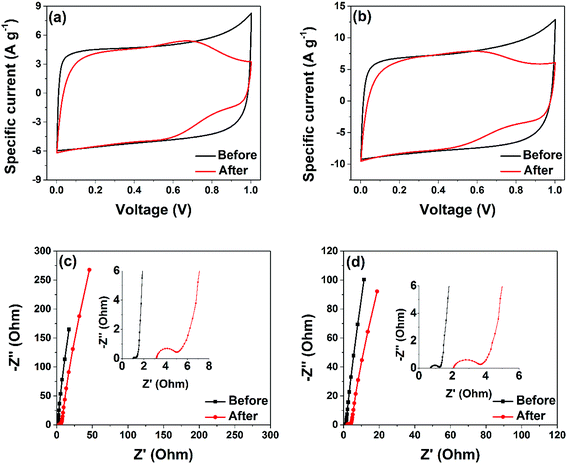 | ||
| Fig. 9 CV and EIS measurement before and after ageing for 100 h: (a and c) – AC-4 and (b and d) AC-6. | ||
The comparison of the EIS of the two cells is also done after floating (Fig. 9(c) and (d)). The AC-6 symmetric device still exhibited the smallest solution and charge transfer resistances as well as the shortest diffusion length.
An increase in the resistances after floating was evident for the AC-4 and AC-6 symmetric cells, the Nyquist plots before and after floating exhibit comparable internal resistance values (ESR (RS) = 1.02 Ω and 3.2 Ω for the AC-4 and RS = 0.65 Ω and 2.0 Ω for the AC-6 respectively), which is in good agreement with Fig. 9(b). The increase in these parameter values paints the deterioration of these cells upon voltage holding which could be explained by desorption of big particles from the current collector, supported by the increase in the charge transfer resistance. This increase, as stated earlier, might be due to the detachment of some particles, especially those at the interface between the current collector and the active material. Nonetheless, this increase is small compared to the increase noticed in AC-4 that also has an increase in the diffusion length, suggesting smaller amount of particle lost during ageing for AC-6 cell made of small carbon particles. It worth stating that several cells based on the AC-6 samples were tested and each display similar behavior after the floating test.
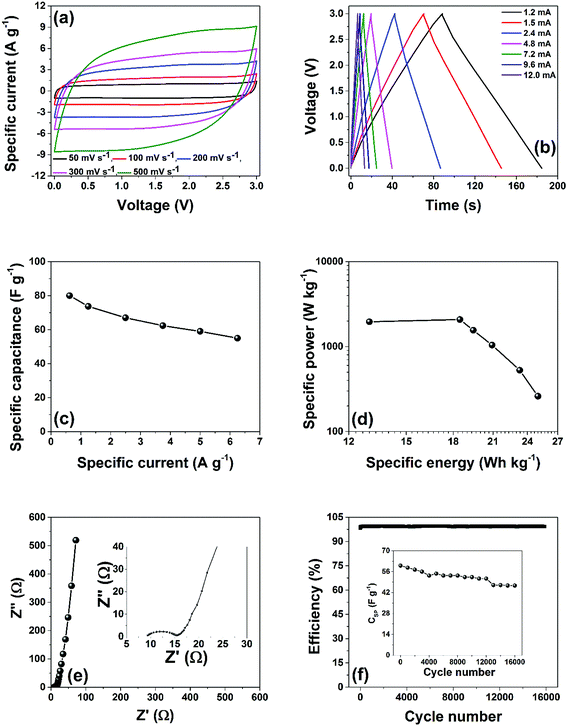
Based on the electrochemical results obtained in the acidic medium for the AC-6 electrode material, it was subjected to further investigated in non-aqueous electrolytes in a two electrode configuration. Specifically, the electrochemical properties of the AC-6 electrodes was tested in 1-ethyl-3-methylimidazolium bistrifluorosulfonylimide (EMIM-TFSI) ionic liquid, because it has been shown that they can withstand a wide operating voltage window up to 3.5 V.32 The rate capability of the device fabricated is presented in Fig. 10(a) with the cell potentiostatically scanned at different sweep rates from 50–500 mV s−1. Taking into account the properties if the AC-6 with a relatively high SSA (1700 m2 g−1), all the CVs significantly displayed electrical double-layer behavior as anticipated. At a sweep rate of 200 mV s−1, CV curves maintained the rectangular indicating minimal losses due to ion-in-pore diffusion and electrical conduction, and becomes quasi-rectangular with a higher sweep rate of 500 mV s−1, which is expected for electrically and ionically conductive carbons.33 The GCD measurements were performed at different specific currents ranging from 0.625 A g−1 to 6.25 A g−1 and the results are shown in Fig. 10(b). In a pure electrical double-layer system, the voltage–current curve should be a perfect triangular shape, the linearity of the voltage vs. time profile confirms the electrical double-layer behavior of the fabricated device observed in Fig. 10(a) above. The linearity of the voltage vs. time profiles were used for calculating specific capacitance (CSP measured in F g−1) at the various specific currents according to eqn (3) as shown in Fig. 10(c). A CSP of 80 F g−1 was obtained at 0.625 A g−1 and 55 F g−1 at 6.25 A g−1 which represent ∼70% retention as the specific current is increased by a factor of 10. The maximum specific energy density (W h kg−1) and power density (W kg−1) were calculated based on the GCD curves at the various specific currents and the results are presented in Fig. 10(d) as the Ragone plot. From the plot, the fabricated device can deliver energy density of about 25 W h kg−1 at a power density of 260 W kg−1. The device performance is comparable with some results in literature9,34–38 on similar ionic liquid electrolytes and in some cases even higher. EIS was performed to investigate the electrochemical performance of the device as shown in Fig. 10(e). The data in figure is associated with the frequency responses of the device, with an arc at the high-frequency region signifying a high charge-transfer resistance (diameter of the arc), followed by a line in the low-frequency range corresponding to ideal capacitive behavior for EDLC. The intercept on the x-axis in the high-frequency region represent the equivalent series resistance (ESR) or solution resistance with a value of 9.3 Ω. This high value is due to the poor conductivity of the ionic liquid used that guarantees a high voltage window that leads to the high energy value obtained. Galvanostatic cycling were performed for 16![[thin space (1/6-em)]](https://www.rsc.org/images/entities/char_2009.gif) 000 cycles at a potential of 3.0 V, at a specific current of 9.6 mA (5 A g−1) as presented in Fig. 10(f). The coulombic efficiency of these cells was 98%. This implies small degradation of the electrodes material after subjecting to the high voltage and several cycling numbers. The capacitance retention (inset to the Fig. 10(f)) after 16
000 cycles at a potential of 3.0 V, at a specific current of 9.6 mA (5 A g−1) as presented in Fig. 10(f). The coulombic efficiency of these cells was 98%. This implies small degradation of the electrodes material after subjecting to the high voltage and several cycling numbers. The capacitance retention (inset to the Fig. 10(f)) after 16![[thin space (1/6-em)]](https://www.rsc.org/images/entities/char_2009.gif) 000 cycles at 3.0 V was ∼80%.
000 cycles at 3.0 V was ∼80%.
4 Conclusion
Polymer based material (PANI) were carbonized to produce activation of carbon (AC) from a non-corrosive K2CO3 activating. Structural and morphological characterization data reveal that the synthesized AC is mainly amorphous, while N2 physisorption show that the carbon material synthesised with the highest mass of K2CO3 possess a large amount of micropores, with reasonable amount of mesopores, high porosity, SSA of ∼1700 m2 g−1, and micropore volume Vmicro = 0.6 cm3 g−1. Owing to these properties, a shorter diffusion length, a lower diffusive resistance, a lower ESR value as well as smaller charge transfer resistance were demonstrated for this material, when used as a supercapacitor electrode material. Furthermore, negligible electrode deterioration was noticed upon ageing for 100 h. Similarly in ionic liquid, 1-ethyl-3-methylimidazolium bistrifluorosulfonylimide (EMIM-TFSI), the cell fabricated exhibited energy density of about 25 W h kg−1 at a power density of 260 W kg−1, 98% coulombic efficiency and 80% capacitance retention after charging and discharging the cells at room temperature to 3.0 V at a specific current of 5 A g−1 for 16![[thin space (1/6-em)]](https://www.rsc.org/images/entities/char_2009.gif) 000 cycles. It is also worth noting that the production of these carbon materials is easy and environmentally friendlier than KOH activation. Further work can increase the electrode specific capacitance and the voltage applied to these systems. Suitable engineering techniques can be used to maximize the energy density of full cells, bringing them close in terms of energy density to aqueous rechargeable batteries, but with much better cycle-life compared to batteries. We hope this synthetic strategy can also open up a new way to synthesize renewable biomass-derived carbon materials for high-performance energy storage applications in the future.
000 cycles. It is also worth noting that the production of these carbon materials is easy and environmentally friendlier than KOH activation. Further work can increase the electrode specific capacitance and the voltage applied to these systems. Suitable engineering techniques can be used to maximize the energy density of full cells, bringing them close in terms of energy density to aqueous rechargeable batteries, but with much better cycle-life compared to batteries. We hope this synthetic strategy can also open up a new way to synthesize renewable biomass-derived carbon materials for high-performance energy storage applications in the future.
Conflicts of interest
Authors declare that no conflict of interest of any form exists.Acknowledgements
This research is supported by the South African Research Chairs Initiative of the Department of Science and Technology and National Research Foundation of South Africa (Grant No. 61056). The finding and conclusion or recommendation expressed in this article is that of the author(s) and the NRF does not accept any liability in this regard. A. Bello acknowledge the National research Foundation (NRF) through the SARCHI chair in Carbon Technology and the African Centres of Excellence Program, the Pan African Materials Institute (PAMI), and the African Development Bank (AfDB), for their financial support.References
- BP, Statistical Review of World Energy report, 2017 Search PubMed.
- Z. Yang, J. Zhang, M. C. W. Kintner-Meyer, X. Lu, D. Choi, J. P. Lemmon and J. Liu, Chem. Rev., 2011, 111, 3577–3613 CrossRef CAS PubMed.
- B. E. Conway, Electrochemical Supercapacitors Scientific Fundamentals and Technological Applications, Kluwer Academic/Plenum, New York, 1999 Search PubMed.
- A. Burke, J. Power Sources, 2000, 91, 37–50 CrossRef CAS.
- Y. Gogotsi, A. Nikitin, H. Ye, W. Zhou, J. E. Fischer, B. Yi, H. C. Foley and M. W. Barsoum, Nat. Mater., 2003, 2, 591–594 CrossRef CAS PubMed.
- J. Wang and S. Kaskel, J. Mater. Chem., 2012, 22, 23710–23725 RSC.
- D. Adinata, W. M. A. Wan Daud and M. K. Aroua, Bioresour. Technol., 2007, 98, 145–149 CrossRef CAS PubMed.
- Y.-T. Li, Y.-T. Pi, L.-M. Lu, S.-H. Xu and T.-Z. Ren, J. Power Sources, 2015, 299, 519–528 CrossRef CAS.
- M. Sevilla and A. B. Fuertes, ChemSusChem, 2016, 9, 1880–1888 CrossRef CAS PubMed.
- K. S. Ryu, K. M. Kim, N.-G. Park, Y. J. Park and S. H. Chang, J. Power Sources, 2002, 103, 305–309 CrossRef CAS.
- H. Mi, X. Zhang, S. Yang, X. Ye and J. Luo, Mater. Chem. Phys., 2008, 112, 127–131 CrossRef CAS.
- M. M. Khandpekar, R. K. Kushwaha and S. P. Pati, Solid-State Electron., 2011, 62, 156–160 CrossRef CAS.
- J. Zhou, T. Zhu, W. Xing, Z. Li, H. Shen and S. Zhuo, Electrochim. Acta, 2015, 160, 152–159 CrossRef CAS.
- Z. Li, E. Liu, Y. Zhu, T. Hu, Z. Luo and T. Liu, Mater. Res. Bull., 2015, 64, 6–11 CrossRef CAS.
- X. Xiang, E. Liu, L. Li, Y. Yang, H. Shen, Z. Huang and Y. Tian, J. Solid State Electrochem., 2011, 15, 579–585 CrossRef CAS.
- A. Bello, F. Barzegar, M. J. Madito, D. Y. Momodu, A. A. Khaleed, T. M. Masikhwa, J. K. Dangbegnon and N. Manyala, Electrochim. Acta, 2016, 213, 107–114 CrossRef CAS.
- P. L. Taberna, P. Simon and J.-F. F. Fauvarque, J. Electrochem. Soc., 2003, 150, A292–A300 CrossRef CAS.
- S. Zhang and N. Pan, Supercapacitors Performance Evaluation, Adv. Energy Mater., 2015, 5, 01401401 CrossRef.
- P. W. Ruch, D. Cericola, A. Foelske-Schmitz, R. Kötz and A. Wokaun, Electrochim. Acta, 2010, 55, 4412–4420 CrossRef CAS.
- R. V. R. A. Rios, J. Silvestre-Albero, A. Sepú Lveda-Escribano, M. Molina-Sabio and F. Rodríguez-Reinoso, J. Phys. Chem. C, 2007, 111, 3803–3805 CrossRef CAS.
- M. Sevilla, G. A. Ferrero and A. B. Fuertes, Energy Storage Mater., 2016, 5, 33–42 CrossRef.
- M. A. Pimenta, G. Dresselhaus, M. S. Dresselhaus, L. G. Cancado, A. Jorio and R. Saito, Phys. Chem. Chem. Phys., 2007, 9, 1276–1290 RSC.
- A. Sadezky, H. Muckenhuber, H. Grothe, R. Niessner and U. Pöschl, Carbon, 2005, 43, 1731–1742 CrossRef CAS.
- M. J. Madito, A. Bello, J. K. Dangbegnon, C. J. Oliphant, W. A. Jordaan and T. M. Masikhwa, et al., Raman analysis of bilayer graphene film prepared on commercial Cu(0.5 at% Ni) foil, J. Raman Spectrosc., 2015, 47, 553–559 CrossRef.
- A. G. Pandolfo and a F. Hollenkamp, J. Power Sources, 2006, 157, 11–27 CrossRef CAS.
- X. Xiang, E. Liu, Z. Huang, H. Shen, Y. Tian, C. Xiao, J. Yang and Z. Mao, J. Solid State Electrochem., 2011, 15, 2667–2674 CrossRef CAS.
- A. Thambidurai, J. K. Lourdusamy, J. V. John and S. Ganesan, Korean J. Chem. Eng., 2014, 31, 268–275 CrossRef CAS.
- P. Cheng, S. Gao, P. Zang, X. Yang, Y. Bai, H. Xu, Z. Liu and Z. Lei, Carbon, 2015, 93, 315–324 CrossRef CAS.
- L. Wang, Y. Zheng, Q. Zhang, L. Zuo, S. Chen, S. Chen, H. Hou and Y. Song, RSC Adv., 2014, 4, 51072–51079 RSC.
- L. Sun, C. Tian, M. Li, X. Meng, L. Wang, R. Wang, J. Yin and H. Fu, J. Mater. Chem. A, 2013, 1, 6462–6470 RSC.
- K. V. Sankar and R. Kalai Selvan, Carbon, 2015, 90, 260–273 CrossRef CAS.
- T. Y. Kim, H. W. Lee, M. Stoller, D. R. Dreyer, C. W. Bielawski, R. S. Ruoff and K. S. Suh, ACS Nano, 2011, 5, 436–442 CrossRef CAS PubMed.
- N. Mao, H. Wang, Y. Sui, Y. Cui, J. Pokrzywinski, J. Shi, W. Liu, S. Chen, X. Wang and D. Mitlin, Nano Res., 2017, 10, 1767–1783 CrossRef CAS.
- A. Lewandowski, A. Olejniczak, M. Galinski and I. Stepniak, J. Power Sources, 2010, 195, 5814–5819 CrossRef CAS.
- J. Zhang, H. Feng, J. Yang, Q. Qin, H. Fan, C. Wei and W. Zheng, ACS Appl. Mater. Interfaces, 2015, 7, 21735–21744 CrossRef CAS PubMed.
- T. Y. Kim, H. W. Lee, M. Stoller, D. R. Dreyer, C. W. Bielawski, R. S. Ruoff and K. S. Suh, ACS Nano, 2011, 5, 436–442 CrossRef CAS PubMed.
- M. Lazzari, F. Soavi and M. Mastragostino, J. Power Sources, 2008, 178, 490–496 CrossRef CAS.
- F. Soavi, C. Arbizzani and M. Mastragostino, J. Appl. Electrochem., 2014, 44, 491–496 CrossRef CAS.
| This journal is © The Royal Society of Chemistry 2018 |

