 Open Access Article
Study of driving skill level discrimination based on human physiological signal characteristics
Fuwang Wang *a,
Qing Xua,
Rongrong Fub and
Guangbin Sun
 c
c
aSchool of Mechanic Engineering, Northeast Electric Power University, Jilin 132012, China. E-mail: wangfuwangfeixue@163.com; 20152622@neepu.edu.cn; wangfuwangbaiyang@126.com; Tel: +86-432-64807382
bCollege of Electrical Engineering, Yanshan University, Qinhuangdao 066004, China
cTechnology and Engineering Center for Space Utilization, Chinese Academy of Sciences, Beijing 100094, China. E-mail: gbsun@csu.ac.cn
First published on 18th December 2018
Abstract
The primary purpose of the study is to distinguish the differences in driving skill between novice and experienced drivers from the viewpoint of human cognitive behavior. Firstly, EEG (electroencephalogram) signals were collected using EEG acquisition equipment called Neuroscan. The δ sub-band and EOG (electrooculogram) signals were extracted from the EEG. Furthermore, the eye movement rate and the sample entropy (SampEn) values of δ sub-bands were calculated. Finally, the heart rate variability (HRV) characteristics, calculated using the SampEn algorithm, were used to analyze driving skill. The final result showed that human physiological signals (EEG, EOG and ECG (electrocardiogram)) could effectively distinguish different driving skills.
1 Introduction
Research shows that novice drivers are generally considered as having a higher risk of traffic accidents than experienced drivers.1–6 According to the traffic accident statistics of Nanjing City in China in 2015, the accident rate of novice drivers under one year's driving age is 13.6%, which is much higher than that of experienced drivers with more than three years of driving experience.7 Compared with experienced drivers, novice drivers have insufficient knowledge of relevant information in the driving process.8 Therefore, we can draw the conclusion that although novice drivers have obtained driver's licenses as well as experienced drivers, novice drivers still pose a greater threat to traffic safety. Therefore, it is particularly important to accurately distinguish between the novice drivers and experienced drivers for traffic safety. The traditional method to identify a driver's driving level is an official driving test, which uses passing the exam as a qualified standard. However, it is still dangerous for novice drivers to drive on the road, even though they have obtained a driving licence. The level of human driving skills is related to the brain cognition degree, which is directly related to traffic safety.9–12 The brain cognition, which involves cognitive abilities, such as learning, reasoning, decision making and attention, is one of the important functions for a human body.13,14 In this study, we mainly researched on the subjects' driving skill from their cognitive behavior.Previous study has demonstrated that people's physiological information characteristics can directly reflect their cognitive level to external things.15–17 Niu Sifang's research shows that the eye movement frequency of experienced pilots are significantly higher than that of novice pilots in flight simulation operations.18 The research results of Brookings J. B. and Wilson G. F. show that the EOG signals is one of the primary external performances of cognitive behavior, which can be used to estimate the cognitive requirements of different tasks.19,20 Eye movements have been used to infer cognitive processes with a long history. And the classic experiments organized by Yarbus indicated that saccadic eyes movements can reflect cognitive processes.21 In recent years, many significant developments in the study of cognition based on eye movements have been completed.22–27 Research conducted over the past 40 years has established EEG as one of the primary tools to study neurocognition.28 The EEG, as primary external performances of cognitive behaviors, was used to estimate the cognitive requirements of different tasks.29 Compared with experienced drivers, novice drivers have insufficient knowledge of relevant information in the driving process.8 Peng Jiahui's research shows that the complexity of brain nervous system will increase with the increase of cognitive information.30 During actual task demands, the extent of α power suppression is positively correlated with cognitive performance, whereas again the opposite holds true for the θ sub-band.16 Fauzan N. et al. has studied on neurocognition. And their research showed that the changes of the δ band of EEG signals at the prefrontal area and the central regions for the normal are associated with cognitive level.31 Researches show that the change of human alertness is consistent with the change of HRV.32–34 Previous studies have shown that the HRV was associated with human neurocognitive activities.35–38 In addition, it has been proved that the heart rate (HR) is an indicator of the primary responses of the autonomic nervous activities.39–41
The aim of this research was to find out whether there were physiological differences between novice drivers and experienced drivers. In fact, the characteristics of EEG, EOG and ECG signals, as the primary external performances of cognitive behavior, have been proved to be effective in distinguishing the driving skill level for drivers by our experiment. In addition, our results showed that the HRV characteristics could identify the driving cognition level as effectively as the EEG characteristics and the EOG characteristics. And this ECG acquisition equipment, which has a lower price than the traditional EEG equipment, is convenient and practical to be used in actual driving test. And the ECG data were collected and analyzed online, which was of great significance for future practical application.
2 Materials and methods
2.1 Experiment
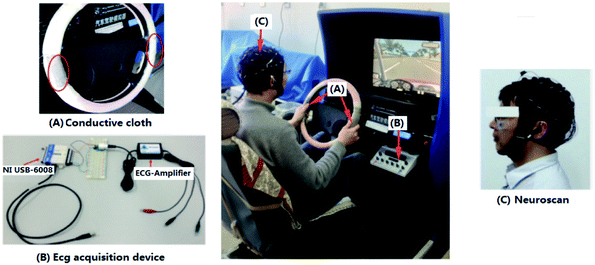
(1) EEG acquisition equipment. The Neuroscan (Compumedics Neuroscan, Inc., Charlotte, NC, USA) is used in the experiments, which is recognized as the widespread use of EEG acquisition device. And its electrodes (Ag/AgCl) are attached to the scalp according to the international 10–20 system (30 channels = FP1, FP2, F7, F3, FZ, F4, F8, FT7, FC3, FCZ, FC4, FT8, T3, C3, CZ, C4, T4, TP7, CP3, CPZ, CP4, TP8, T5, P3, PZ, P4, T6, O1, OZ, and O2). And the impedances of all electrodes are kept below 10 kΩ. The AFz is chosen as the ground electrode. The initial EEG data is digitized with a 22-bit A/D converter, in which the on-line sampling frequency of the data is 1000 Hz. In the experiment, the connection state of electrodes should be checked frequently. And it should be ensured that all leads are in a normal connection state during recording data for each stage. Fig. 1 shows the experimental set-up.
(2) ECG acquisition equipment. The ECG acquisition equipment, which was used to collect the ECG signals of the palm part, consists of two parts, the data acquisition card (NI USB-6008) and the signal amplifier (EKG sensor). The NI USB-6008 provides connection to eight analog input (AI) channels, 12 digital input/output (DIO) channels and a 32-bit counter with a Full-Speed USB interface. The EKG sensor, which can accurately complete ECG signal acquisition and preprocessing, can measure cardiac electrical potential waveforms. In the process of building the equipment platform, we have integrated the ECG acquisition equipment into the electrical acupuncture stimulator (KWD-808I). Fig. 1 shows the experimental set-up.
(3) Simulating driving device. The vehicle simulator simulates the real driving environment, whose hardware mainly consists of steering wheel, clutch, foot brake, hand brake, accelerator, computer and liquid crystal display. The upper computer driving software includes a variety of driving modes, one of which is driving teaching mode.
The experiment was performed in simulation driving condition. A total of 32 healthy subjects [16 males and 16 females; aged 33 ± 6.6 (S.D)], who were randomly selected from the volunteers, have been arranged to participate in the experiment. In the experiment, the subjects were divided into two groups, one group of 16 novice drivers and the other group of 16 experienced drivers. All the subjects, free of medication during the experiment, were reported to have no sleep-related disorders or history of neurological diseases, and asked to refrain from consuming any type of stimulus such as alcohol, tea or coffee during the experiment. In addition, all subjects must hold a drivers licence and have normal or corrected to normal vision. In the experiment, each subject was asked to sit quietly in a chair and rest for half an hour to avoid the influence due to the different amount of exercise before the experiment. In experiment, all the experimenters used the driver's license examination “subject two” on the simulated driving software to simulate driving the car. The driving subjects are shown in Fig. 2.
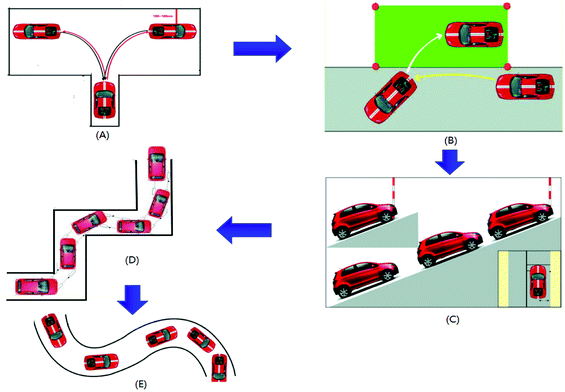 | ||
| Fig. 2 Driver's license examination “subject two”. (A) Reverse parking (B) parallel parking (C) fixed-point parking and starting on ramp (D) right angle bend (E) S-shaped road driving. | ||
Fig. 2(A) shows “reverse parking”, in which drivers need to park a car in the garage by reversing the car without pressing the line. And the Fig. 2(B) shows “reverse parking”, in which drivers need to park a car in the garage on the right without pressing the line. In the Fig. 2(C), drivers need to complete the work of starting and stopping a car and finally pass the bridge without car sliding or flameout. Fig. 2(D) shows “right angle bend”, in which drivers need to select appropriate positions in the continuous right-angle lane to complete a right-angle turn to the left or right without pressing the line. Fig. 2(E) shows “S-shaped road driving”, in which drivers need to drive a car in the S-shaped lane and continuously adjust the steering wheel to correct the driving route without pressing the line. The above five subjects, which are often used when driving at ordinary times, are considered likely to cause accidents if drivers are not proficient in them.
All subjects were informed about the research background and the study protocol. And they were free to choose to participate in the experiment or give up. Moreover, all of them gave their written informed consent to be included in the study. The Ethics Committee at the Northeast Electric Power University Hospital endorsed the study protocol, according to The Code of Ethics of the World Medical Association (Declaration of Helsinki).
2.2 Methods
Researches have shown that EEG signal is easily disturbed by external noise which mainly contain numerous low frequency and high frequency noise known as artifacts, such as the noises produced by vehicle simulator body vibration, the biological electrical signals and the human body movement, etc. So we need to remove noise before extracting EEG features. For ECG signal, we used the wavelet transform to carry out simple de-noising such as removing the powerline interference, electromyographical interference (EMG) and baseline wander to ensure effective ECG information is obtained. Meanwhile, we used the WPD method to filter for the useful frequency band. Such as the δ sub-band frequency band, which associated with the human cognitive activities to the outside world,31 was extracted from the raw EEG.Consider a time series given by {xn}n=1N. And with a given embedding dimension m, the series can be denoted as
| Xn = {xn, xn+1, …, xn+m−1} ∈ Rm, n = N0, N0 + 1, …N | (1) |
The distance function d[X(i), X(j)], which was used to calculate the maximum distance between X(i) and X(j), is defined as
| d[X(i), X(j)] = max‖x(i + k − 1) − x(j + k − 1)‖ | (2) |
| Cim(r) = {d[X(i), X(j)] ≤ r}/(N − m), i ≤ N − m + 1 |
 | (3) |

This study calculated SampEn with the most widely-used parameter setting, i.e., m = 2 and r = 20% of the original time series standard deviation.
This study used a three-layer BP neural network to analyze blink characteristics. Let n, p and q denote the unit number of the input layer, hidden layer and output layer, respectively. In a simple three-layer BP network, it is assumed that the input vector is X = (x1, x2, …, xn); the implicit layer input vector is hi = (hi1, hi2, …, hip); the hidden layer output vector is ho = (ho1, ho2, …, hop); the input vector of the output layer is yi = (yi1, yi2, …, yiq); the output vector of the output layer is yo = (yo1, yo2, …, yoq); the expected output vector is do = (d1, d2, …, dq); the connection weight value from the input layer to the hidden layer is wih; the connection weight value from the hidden layer to the output layer is who; the threshold of each neuron in the hidden layer is bh; the threshold of each neuron in the output layer is bo; the number of samples is k = 1, 2, …, m; the activation function is f(·); the error function is:
 | (4) |
The BP neural network algorithm is composed of the following steps.
(1) Network initialization: each connection weight is assigned a random number within the interval (−1, 1); the error function is set to e; the given calculation precision value is set to ε and the maximum number of studies is set to M.
(2) The kth input sample and the corresponding expected output are randomly selected:
| X(k) = (x1(k), x2(k), …, xn(k)) | (5) |
| do(k) = (d1(k), d2(k), …, dq(k)) | (6) |
(3) The input and output of each neuron in the hidden layer are calculated:
 | (7) |
| hoh(k) = f(hih(k)), h = 1, 2, …, p | (8) |
 | (9) |
| yoo(k) = f(yio(k)), o = 1, 2, …, q | (10) |
(4) Using the expected output and actual output of the network, the partial derivative (δo(k)) of the error function to each neuron in the output layer is calculated.
 | (11) |
 | (12) |
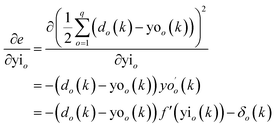 | (13) |
(5) The partial derivative (δh(k)) of the error function to each neuron in the hidden layer is calculated.
 | (14) |
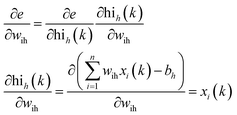 | (15) |
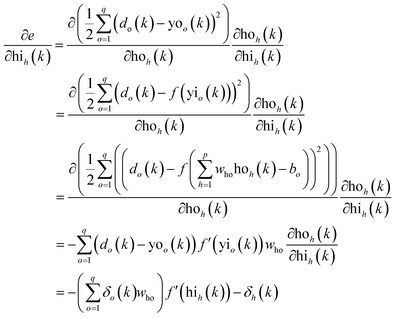 | (16) |
(6) The connection weights (who(k)) are corrected by using the outputs of each neuron in the output layer and each neuron in the hidden layer.
 | (17) |
(7) The connection weights are modified by the inputs of each neuron (δh(k)) in the hidden layer and each neuron in the input layer.
 | (18) |
(8) Calculate the global error:
 | (19) |
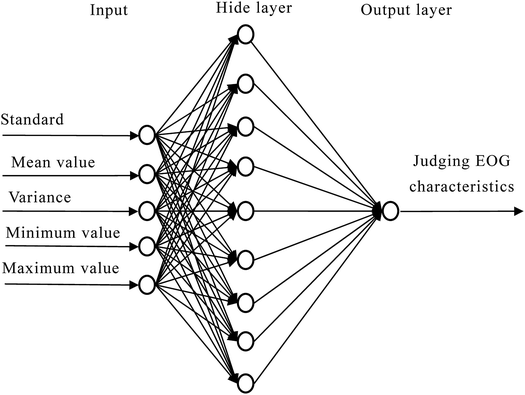
(9) Judging whether the network error meets the requirements. If the error reaches the preset precision or the number of learning times is greater than the set maximum number of times, the algorithm ends. Otherwise, select the next learning sample and the corresponding expected output, return to the third step, and enter the next round of learning. In this paper, the selected BP network input layer includes 5 input units, the hidden layer neuron selection 9, and the output layer is 1 output unit, which shown, as shown in Fig. 3.
3 Results
3.1 EEG characteristics
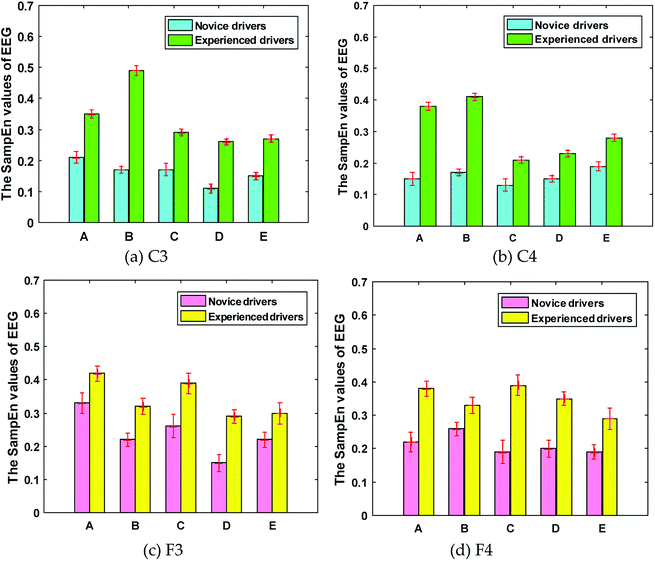
Research has shown that the changes of the δ band of EEG signals at the prefrontal area (F3, F4) and the central regions (C3, C4) for the normal are associated with cognitive level.31 The neural region of the brain is in an excited state after training, which reflects the cognitive level of the human being.44,45 This study used the sample entropy values of F3, F4, C3 and C4 lead EEG signals to analyze the level of human driving. The results were shown in the Fig. 4.Fig. 4 shows that there are significant differences in the SampEn values of EEG signals (C3, C4, F3 and F4 lead) among subjects with different driving levels (P < 0.05). In the C3, C4, F3 and F4 lead signals, the SampEn values of the experienced drivers are significantly higher than that of the novice drivers, which indicates that the neural activity in the prefrontal area and the central regions of the experienced drivers is more active during the driving operation. The differences in nerve activity between the experienced drivers and novice drivers in these two brain regions can be clearly seen in Fig. 5.
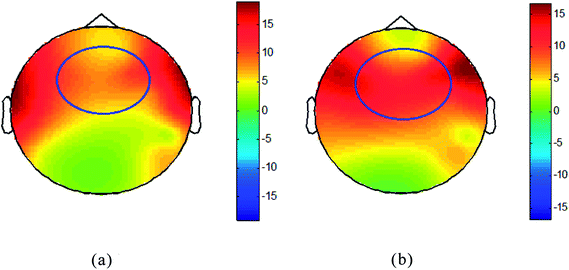 | ||
| Fig. 5 The comparison of brain topography of a novice driver and a experienced driver. (a) Novice drivers (b) experienced drivers. | ||
For brain topography, low activity is indicated by the blue-shaded areas, whereas high activity is indicated by the red-shaded areas. Fig. 5 shows the brain topography, which indicates nerve activities for the subjects. Obviously, for the brain topography, there is a significant difference between the novice driver and the experienced driver in the prefrontal area (F3, F4) and the central region (C3, C4). The prefrontal area and the central region were marked on the brain topographic map with blue oval lines, as shown in Fig. 5.
3.2 Eye movement
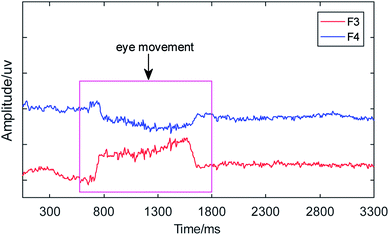
The brain's frontal area, in which the EEG signal was very obvious, was used as the acquisition area of EOG signals in this experiment. The channels F3 and F4, as the important leads in the prefrontal area of the brain, were chosen to study the characteristics of eye movement. The waveform of these two lead signals were approximately symmetrical when eye movements occur, as shown in Fig. 6.Fig. 6 shows the EOG signals of one eye movement, which are extracted from the channels F3 and F4. And then the Pearson correlation coefficient is used to analyze the relationship between F3 and F4. The Pearson correlation coefficient is represented by:
 | (20) |
 | (21) |
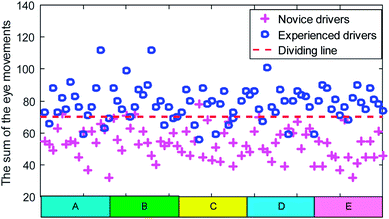
![[x with combining macron]](https://www.rsc.org/images/entities/i_char_0078_0304.gif) and ȳ are series means, and σX, σY are the standard values of deviation. In the study, the moving window with the step n = 100 is used to test the eye movement signals of F3 and F4 lead. One eye movement can be recorded if the correlation coefficient calculated by eqn (21) meet the condition −1 < rXY < −0.8. Then the BP neural network algorithm is used to detect eye movement signal characteristics. Fig. 7 shows the sum of the eye movements of each driver in the five experiments.
and ȳ are series means, and σX, σY are the standard values of deviation. In the study, the moving window with the step n = 100 is used to test the eye movement signals of F3 and F4 lead. One eye movement can be recorded if the correlation coefficient calculated by eqn (21) meet the condition −1 < rXY < −0.8. Then the BP neural network algorithm is used to detect eye movement signal characteristics. Fig. 7 shows the sum of the eye movements of each driver in the five experiments.
Obviously, there is a significant difference in the total number between the novice drivers and experienced drivers, as shown in Fig. 7. The numbers of eye movement for most of the experienced drivers are more than 70. However, most of the novice drivers are less than 70. A conclusion can be drawn that the eye movement rate of drivers can been used as an indicator for judging driving skill.
3.3 ECG
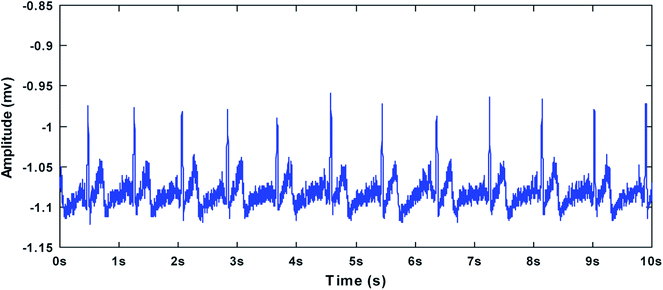
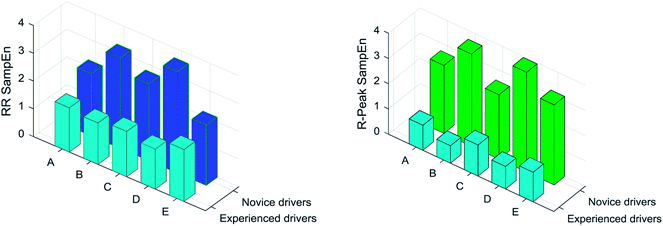
Research has shown that the HRV is associated with human neurocognitive activities.28 In this paper, we used the SampEn of the HRV characteristics (R-peaks series and RR intervals series) to analyze the changes of the neurocognitive activities. Fig. 8 shows the ECG signal that was acquired from the palm of one of the subject hands.The analysis of HRV characteristics was carried out for 20 subjects in the driver's license examination “subject two”. Additionally, the SampEn values were calculated separately for RR intervals series and R-peaks series. Throughout the experimental phase, the comparison of the HRV characteristics between the novice drivers and the experienced drivers are shown in Fig. 9.
Fig. 9 shows that there are significant differences in the SampEn values of ECG signals between the novice drivers and the experienced drivers (P < 0.05). The SampEn values of the novice drivers' ECG signals are significantly higher than that of the experienced drivers, which indicates that the experienced drivers, whose vagus nerve is less active than that of the novice drivers, deal with driving information with a calm mood and a gentle heartbeat.
4 Discussion
The experiment was performed in simulation driving condition. A total of 32 healthy subjects (16 novice drivers, 16 experienced drivers), who were randomly selected from the volunteers, have been arranged to participate in the experiment. All subjects used the driver's license examination “subject two” on the simulated driving software to simulate driving the car. The paper mainly analyzes three physiological indexes of drivers. The SampEn values of EEG reflects the brain's cognitive level of driving operation. The brain of experienced drivers process more driving-related information than novice drivers when driving, which the nervous system involved is more active than the novice drivers'. So their SampEn values of EEG are bigger than that of the novice drivers' as shown in Fig. 4. This means that the neuron clusters, which are in the prefrontal area (F3, F4) and the central region (C3, C4), are in a more active state when the experienced drivers drive a car comparing with the novice drivers. Furthermore, for the EOG characteristics, the experienced drivers are skilled in driving movements, and the time of looking at each information position is short. So their frequency of eye movement was significantly higher than that of the novice drivers. Therefore, we got the result shown in Fig. 7. It means that the visual nerve of the experienced drivers process the driving information faster than the novice drivers. And the time of the eye gaze at the driving scene is shorter compared with the novice drivers. Therefore, the frequency of eye movements of the experienced drivers is higher than that of the novice drivers. Finally, the heart rate variability (HRV) characteristics, calculated by SampEn algorithm, were used to analyze driving skill. Researches have shown that the change of human alertness is consistent with the change of HRV.5–7 In the experiment, due to the low level of driving skills, the novice drivers always keep a high degree of vigilance during driving tests to prevent violations such as line pressing. On the contrary, the experienced driver does not worry too much about this. So we got the result shown in Fig. 9. Therefore, it is clear that the human physiological signals can effectively distinguish different driving skills.Our experimental result has shown that there is a significant difference in physiological characteristics between novice and experienced drivers. Although novice drivers have obtained driver's licenses as well as experienced drivers, novice drivers pose a greater threat to traffic safety. So we can let novice drivers do driving simulation training. Meanwhile, the physiological characteristic indexes reflecting the driving cognition level are detected. During this period, novice drivers are not advised to drive on the road until their physical indicators are consistent with those of experienced drivers. We believe that it will be meaningful to improve traffic safety.
In our research, we only studied on the distinction between the novice drivers and the experienced drivers. No research has been carried out on what indicators the driver's physiological characteristics need to reach in order to ensure safe driving in real driving. In future research works, the physiological parameters corresponding to the drivers reaching the safe driving level, which could be used by novice drivers who were constantly training in driving to measure their driving standards, will be determined. During the novice drivers simulation training, they are not advised to drive on the road until their physical indicators are consistent with those of experienced drivers. We believe that it will be meaningful to improve traffic safety.
5 Conclusions
In this paper, the characteristics of EEG, EOG and ECG signals, as the primary external performances of cognitive behavior, were used to distinguish different driving skill levels. Firstly, there are significant differences in the SampEn values of EEG signals (C3, C4, F3 and F4 lead) among subjects with different driving levels. In the C3, C4, F3 and F4 lead signals, the SampEn values of the experienced drivers are significantly higher than that of the novice drivers. Furthermore, the eye movement rates of the novice drivers are significantly less than the experienced drivers in the experiment, which means that the eye movement rates can reflect the cognitive degree of driving task for drivers. Finally, the heart rate variability (HRV) characteristics, calculated by SampEn algorithm, were used to analyze driving skill. And the SampEn values of the novice drivers' ECG signals are significantly higher than that of the experienced drivers. Therefore, we can draw the conclusion that the human physiological signals (EEG, EOG and ECG) can effectively distinguish different driving skills. And the reason for these differences in human physiological signals is that the experienced drivers have rich experience in driving operation and they can think about problems positively with calm. In addition, they can efficiently and correctly deal with problems with concentrated spirit. However, the novice drivers can't reach this level of cognition about driving.Conflicts of interest
The authors declare no conflict of interests.Acknowledgements
We gratefully acknowledge the financial support by the National Natural Science Foundation of China (51605419), Northeast Electric Power University (BSJXM-201521) and Jilin City Science and Technology Bureau (20166012).References
- D. Shinar, Traffic Safety and Human Behavior, Accident Causes, 2007 Search PubMed.
- A. K. Pradhan, A. Pollatsek and M. Knodler, et al., Can younger drivers be trained to scan for information that will reduce their risk in roadway traffic scenarios that are hard to identify as hazardous?, Ergonomics, 2009, 52(6), 657–673 CrossRef CAS PubMed.
- C. Freydier, C. Berthelon and M. Bastientoniazzo, Does early training improve driving skills of young novice French drivers?, Accid. Anal. Prev., 2016, 96, 228–236 CrossRef PubMed.
- L. Jackson, P. Chapman and D. Crundall, What happens next? Predicting other road users' behaviour as a function of driving experience and processing time, Ergonomics, 2009, 52(2), 11 CrossRef PubMed.
- U. K. Knutsson, Swedish National Road and Transport Research Institute, IATSS Research, 2003, 27(2), 88–91 CrossRef.
- D. R. Mayhew, H. M. Simpson and D. Singhal, et al., Reducing the Crash Risk for Young Drivers, Compliance, 2006 Search PubMed.
- http://www.xinhuanet.com/legal/2016-01/18/c_128640089.htm.
- D. Crundall, Some hazards are more attractive than others: drivers of varying experience respond differently to different types of hazard, Accid. Anal. Prev., 2012, 45(1), 600–609 CrossRef PubMed.
- B. Scott-Parker, Review of the graduated driver licensing programs in Australasia, J. Australas. Coll. Road Saf., 2016, 27(4), 15 Search PubMed.
- B. Scott-Parker and O. Oviedo-Trespalacios, Young driver risky behaviour and predictors of crash risk in Australia, New Zealand and Colombia: same but different?, Accid. Anal. Prev., 2017, 99, 30–38 CrossRef PubMed.
- M. Sivak and B. Schoettle, Recent decreases in the proportion of persons with a driver's license across all age groups, 2016 Search PubMed.
- M. Sivak and B. Schoettle, Recent decreases in the proportion of persons with a driver's license across all age groups, 2016 Search PubMed.
- A. J. Anderson and S. Perone, Developmental change in the resting state electroencephalogram: insights into cognition and the brain, Brain Cogn., 2018, 126, 40–52 CrossRef PubMed.
- K. I. Erickson, C. H. Hillman and A. F. Kramer, Physical activity, brain, and cognition, Curr. Opin. Behav. Sci., 2015, 4, 27–32 CrossRef.
- C. M. Rimkus, I. M. B. Avolio and E. C. Miotto, et al., The protective effects of high-education levels on cognition in different stages of multiple sclerosis, Mult. Scler. Relat. Disord., 2018, 22, 41–48 CrossRef PubMed.
- C. Chen, S. Nakagawa and Y. An, et al., The exercise-glucocorticoid paradox: how exercise is beneficial to cognition, mood, and the brain while increasing glucocorticoid levels, Front. Neuroendocrinol., 2017, 44, 83–102 CrossRef CAS PubMed.
- M. Yamashita and T. Yamamoto, Tryptophan circuit in fatigue: from blood to brain and cognition, Brain Res., 2017, 1675, 116–126 CrossRef CAS PubMed.
- S. Niu, Study on Eye movement patterns of pilot's under the flight simulation tasks, The Fourth Military Medical University, 2014 Search PubMed.
- J. B. Brookings, G. F. Wilson and C. R. Swain, Psychophysiological responses to changes in workload during simulated air traffic control, Biol. Psychol., 1996, 42(3), 361–377 CrossRef CAS PubMed.
- G. F. Wilson, An analysis of mental workload in pilots during flight using multiple psychophysiological measures, Int. J. Aviat. Psychol., 2002, 12(1), 3–18 CrossRef.
- M. Hayhoe and D. Ballard, Eye movements in natural behavior, Trends Cognit. Sci., 2005, 9(4), 188–194 CrossRef PubMed.
- J. M. Henderson, Human gaze control during real-world scene perception, Trends Cognit. Sci., 2003, 7(11), 498–504 CrossRef.
- S. P. Liversedge and J. M. Findlay, Saccadic eye movements and cognition, Trends Cognit. Sci., 2000, 4(1), 6–14 CrossRef.
- J. M. Findlay and I. D. Gilchrist, Active vision: the psychology of looking and seeing, Oxford University Press, 2003 Search PubMed.
- J. Henderson and F. Ferreira, Interface of Language, Vision and Action, Psychology Press, 2013 Search PubMed.
- A. Bulling, J. A. Ward and H. Gellersen, et al., Eye movement analysis for activity recognition using electrooculography, IEEE Trans. Pattern Anal. Mach. Intell., 2011, 33(4), 741–753 Search PubMed.
- K. Rayner, S. P. Liversedge and S. J. White, et al., Reading disappearing text: cognitive control of eye movements, Psychol. Sci., 2003, 14(4), 385–388 CrossRef PubMed.
- M. Fabiani, G. Gratton and K. D. Federmeier, Event-related brain potentials: methods, theory, and applications, Handbook of Psychophysiology, 2007, pp. 53–84 Search PubMed.
- W. Klimesch, EEG alpha and theta oscillations reflect cognitive and memory performance: a review and analysis, Brain Res. Rev., 1999, 29(2), 169–195 CrossRef CAS PubMed.
- J. Peng, The Research of Brain Cognitive and Visual-auditory Evoked EEG Signal Processing, 2014 Search PubMed.
- N. Fauzan and N. H. Amran, Brain Dynamics of Mild Cognitive Impairment (MCI) from EEG Features, Procedia Soc. Behav. Sci., 2015, 165(165), 284–290 CrossRef.
- C. T. Lin, M. Nascimben and J. T. King, et al., Task-related EEG and HRV entropy factors under different real-world fatigue scenarios, Neurocomputing, 2018, 311, 24–31 CrossRef.
- W. B. Verwey and D. M. Zaidel, Preventing drowsiness accidents by an alertness maintenance device, Accid. Anal. Prev., 1999, 31, 199–211 CrossRef CAS PubMed.
- Q. Wu, An ECG-Based Approach to Driving Fatigue Detection, Zhejiang University, Zhejiang, China, 2008 Search PubMed.
- P. M. Léger, F. D. Davis and T. P. Cronan, et al., Neurophysiological correlates of cognitive absorption in an enactive training context, Comput. Hum. Behav., 2014, 34, 273–283 CrossRef.
- J. Achten and A. E. Jeukendrup, Heart rate monitoring: applications and limitations, Sports Med., 2003, 33(7), 517–538 CrossRef PubMed.
- M. Pagani, N. Montano and A. Porta, et al., Relationship between spectral components of cardiovascular variabilities and direct measures of muscle sympathetic nerve activity in humans, Circulation, 1997, 95(6), 1441–1448 CrossRef CAS PubMed.
- S. B. Park, B. C. Lee and K. S. Jeong, Standardized Tests of Heart Rate Variability for Autonomic Function Tests in Healthy Koreans, Int. J. Neurosci., 2007, 117(12), 1707 CrossRef PubMed.
- Y. Gao, D. Borlam and W. Zhang, The Association between Heart Rate Reactivity and Fluid Intelligence in Children, Biol. Psychol., 2015, 107, 69–75 CrossRef PubMed.
- A. T. Ginty, A. C. Phillips and G. Der, et al., Heart rate reactivity is associated with future cognitive ability and cognitive change in a large community sample, Int. J. Psychophysiol., 2011, 82(2), 167 CrossRef PubMed.
- S. Scrimin, E. Patron and E. Ruli, et al., Dynamic psychophysiological correlates of a learning from text episode in relation to reading goals, Learn Instr., 2018, 54, 1–10 CrossRef.
- Big Data Report on Traffic Accidents in Nanjing in 2015: “Road Killer” is A Novice Driver, available online: http://www.xinhuanet.com/legal/2016-01/18/c_128640089.htm Search PubMed.
- C. S. Yoo and S. H. Yi, Effects of Detrending for Analysis of Heart Rate Variability and Applications to the Estimation of Depth of Anesthesia, J. Korean Phys. Soc., 2004, 44, 561 CrossRef.
- J. Frost and A. Eden, The Effect of Social Sharing Games and Game Performance on Motivation to Play Brain Games//Games for Health, 2014, Springer Vieweg, Wiesbaden, 2014, pp. 48–55 Search PubMed.
- X. Li, X. Sun and E. Cai, et al., Improving Brain Function States by Special Game Training, Chin. J. Biomed. Eng., 2017, 36(6), 685–691 Search PubMed.
| This journal is © The Royal Society of Chemistry 2018 |

