 Open Access Article
Investigations on the driving forces of the fluorocarbon surfactant-assisted spontaneous imbibition using thermogravimetric analysis (TGA)
Haihui Chen ab,
Hongfu Fan*ab,
Yi Zhangc,
Xingguang Xu
 *d,
Long Liuab and
Qingfeng Hou*c
aSchool of Energy Resource, China University of Geosciences (Beijing), Beijing 100083, P. R. China. E-mail: fanhongfu@cugb.edu.cn
bBeijing Key Laboratory of Unconventional Natural Gas Geological Evaluation and Development Engineering, Beijing 100083, P. R. China
cResearch Institute of Petroleum Exploration & Development, CNPC, Beijing 100083, P. R. China. E-mail: houqingfeng@petrochina.com.cn
dEnergy Business Unit, Commonwealth Scientific Industrial Research Organization (CSIRO), Perth 6151, Australia. E-mail: Xingguang.Xu@csiro.au
First published on 14th November 2018
Abstract
Spontaneous imbibition is crucial for the development of matrix-fractured petroleum reservoirs. To improve the ultimate oil recovery, it is essential to demonstrate the role of the surfactant solution on the imbibition process. In this study, spontaneous imbibition experiments were carried out using self-prepared oil sand that to investigate the dependence of oil recovery on the concentration of a fluorocarbon surfactant (FS-30). Emulsion and solubilization were assessed to identify the correlation between oil-water interface properties and spontaneous imbibition. Moreover, thermogravimetric analysis (TGA) was also applied to accurately determine the imbibition recovery and look into the influence of components of crude oil on spontaneous imbibition. The maximum ultimate oil recovery in this work was 70.8% using 0.3 wt% FS-30, when the oil-solid adhesion tension, the capillary pressure (PC) and solubilization factor (SF) attained extreme values of −3.7002 mN m−1, 4.8751 MPa and 242.7 mL g−1, respectively. It was found that the surface activator played a critical role in promoting the imbibition process through altering the contact angle and interfacial tension. A negative adhesive tension and a positive capillary pressure would accordingly be generated, which facilitated the departure of oil droplets from the rock surface. In addition, it was observed that a lower solubilization factor and higher emulsion stability could favour spontaneous imbibition. Finally, heavier components in oil sands were more prone to be displaced than lighter counterparts, especially when the surfactant concentration was relatively high. This study may shed light on the effect of surfactants on spontaneous imbibition and thus is of great significance in understanding the underlying mechanism of the imbibition process.
1. Introduction
Spontaneous imbibition refers to a spontaneous process in which the wetting phase is imbibed into the porous media under capillary pressure and the non-wetting phase is expelled at the same time.1 It is a key process for oil recovery in naturally fractured reservoirs.2 It is estimated that more than 50% of the reservoirs worldwide are natural oil-wet reservoirs where water always needs to overcome the capillary pressure in the secondary recovery process.3 Consequently, chemicals, primarily surfactants, are widely employed to assist in the imbibition process in oil-wet reservoirs.4As an amphiphilic additive with unique properties, the surfactant has been considered in a variety of fields. A great number of scientists have reported the important role which surfactants play in the imbibition process.4–9 In brief, surfactants can alter the rock wettability and change the oil/water interfacial tension (IFT), resulting in the increase in capillary pressure. Therefore, the imbibition recovery was significantly enhanced for the capillarity driven natural imbibition (CDNI).6 Under the assumption that the capillary radius of reservoir were constant, the capillary force could be determined by the contact angle (CA) and interfacial tension (IFT) as shown in eqn (1):
 | (1) |
It can be seen from eqn (1) that IFT between oil and water should be reasonable so that the driving force of imbibition, i.e. capillary force, was sufficient. This explained why the nonionic surfactants can achieve higher CNDI recovery compared to ionic surfactants.4,10,11 However, other studies have shown that spontaneous imbibition also occurred at lower interfacial tension (below 10−2 mN m−1) and that the effect of capillary force seemed to be insignificant. Some scholars speculated it was the formation of emulsion that caused the displacement of oil. In this scenario, the influence of capillary force became negligible. Accordingly this process was called emulsification driven natural imbibition (EDNI).6,12–14
In order to investigate how capillary force and emulsification may affect the chemical imbibition, and what are the predominant controlling factors in the chemical imbibition process, we chose FS-30, a fluorocarbon surfactant, as the imbibition enhancer. Compared with the conventional hydrocarbon surfactants, fluorocarbon surfactants noticeably impact the wettability and surface tension at relatively low concentration, which was largely attributed to the strong hydrophobic effect of the C–F bonds.15,16
In the previous work, we found that the oil composition significantly changed after the chemical imbibition. Based on this observation, we speculated that surfactants would selectively displace each component in the crude oil. In order to verify this point, we used the synthetic oil with a fixed ratio of several neat hydrocarbons to perform the imbibition experiments with the assistance of thermogravimetric analysis (TGA).17 TGA is an effective tool to quantitatively identify substances in mixtures.18 The quality change of each substance is tracked by TG-DTG (thermal gravity-differential thermal gravity) curve to quantify the variation of one component.19,20 As such, we may specify how the interaction between different components in crude oil and surfactants would impact the imbibition recovery.
The main objective of this work is to identify the key controlling factors in the process of chemical imbibition. Imbibition experiments using oil sands with self-prepared synthetic oil were carried out. The effects of surfactants on imbibition velocity and ultimate imbibition recovery were investigated using TGA technique. In particular, the emulsion stability and solubilization factor were evaluated, based on which the effect of surfactants on spontaneous imbibition was proposed. Finally, influences of the displacement sequence of light and heavy components in crude oil on the imbibition recovery were specified. We believe this work will provide more insights into the factors controlling the chemical imbibition and may have significant implications on enhancing imbibition recovery.
2. Experimental materials and methods
2.1. Materials
![[thin space (1/6-em)]](https://www.rsc.org/images/entities/char_2009.gif) :
:![[thin space (1/6-em)]](https://www.rsc.org/images/entities/char_2009.gif) 3 (MC16H34
3 (MC16H34![[thin space (1/6-em)]](https://www.rsc.org/images/entities/char_2009.gif) :
:![[thin space (1/6-em)]](https://www.rsc.org/images/entities/char_2009.gif) M2#HAB = 7
M2#HAB = 7![[thin space (1/6-em)]](https://www.rsc.org/images/entities/char_2009.gif) :
:![[thin space (1/6-em)]](https://www.rsc.org/images/entities/char_2009.gif) 3). The viscosity and density of the hydrocarbon mixture (synthetic oil) was 4.0 mPa s and 0.8 g cm−3 at 45 °C. Using this synthetic oil enabled the investigation on the displacement sequence of light and heavy components in the surfactants-assisted imbibition.
3). The viscosity and density of the hydrocarbon mixture (synthetic oil) was 4.0 mPa s and 0.8 g cm−3 at 45 °C. Using this synthetic oil enabled the investigation on the displacement sequence of light and heavy components in the surfactants-assisted imbibition.Quartz (primarily SiO2) was used in this study to represent the sandstone rock. The parameters of the quartz sand are shown in Table 1. Its permeability and porosity were measured with a quartz sand filling tube(a tube filled with 80–100 mesh of quartz sand under 2 MPa pressure) using a FS-II porosity and permeability tester (ZJ, China). The synthetic oil and quartz sand were then stirred with a mass ratio of 1![[thin space (1/6-em)]](https://www.rsc.org/images/entities/char_2009.gif) :
:![[thin space (1/6-em)]](https://www.rsc.org/images/entities/char_2009.gif) 7 by a self-made oil sand agitator to prepare the oil sand. The agitator rotates for 24 hours at a uniform speed under 45 °C. Afterwards, the oil sand was aged for two weeks at 45 °C. The oil saturation in the prepared oil sand was calculated to be 56.76% based on the porosity of quartz sand and the absolute mass of the synthetic oil.
7 by a self-made oil sand agitator to prepare the oil sand. The agitator rotates for 24 hours at a uniform speed under 45 °C. Afterwards, the oil sand was aged for two weeks at 45 °C. The oil saturation in the prepared oil sand was calculated to be 56.76% based on the porosity of quartz sand and the absolute mass of the synthetic oil.
| Mesh | Particle size (μm) | Porosity (%) | Permeability (10−3 μm2) |
|---|---|---|---|
| 80–100 | 180–150 | 18.9 | 51.2 |
2.2. Spontaneous imbibition experiment
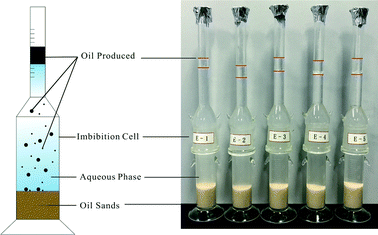
15 g of oil sand was loaded into a modified Amott imbibition cell (Fig. 2) that subsequently was pressurized to 2 MPa. Then 60 g of brine or FS-30 solutions with concentrations of 0.01 wt%, 0.05 wt%, 0.1 wt%, 0.15 wt%, and 0.3 wt% was then injected into the bottle. The oil sand was collected from the cells for TGA measurements after 1, 2, 6, 10, 14, and 24 h, respectively. The peak area of DTG curve of each component in the oil sand before and after the imbibition was calculated, based on which the imbibition recovery was obtained.2.3. Measurement of interfacial tension and contact angle
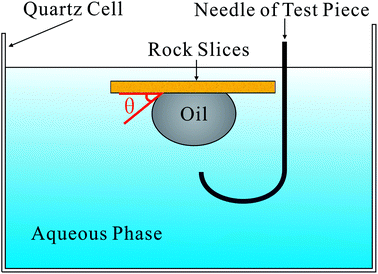
The TX-500C interface tension meter (CNG CO., USA) was used to measure the interfacial tension (IFT) between the synthetic oil and surfactant solution (or brine) at 45 °C,7 and the value of the equilibrium interface tension was recorded after 2 h.Contact angle (CA) was measured using the method proposed by Liang (Fig. 3).22 The oil sand was compressed to rock slices under the pressure of 30 MPa. The rock slices were then soaked in the aqueous phase with different concentrations of FS-30. Next, a synthetic oil droplet was dropped into the aqueous FS-30 solution through a needle. The equilibrium contact angle was obtained by the captive bubble method23 at 45 °C.
2.4. Solubilization ratio
The surfactant has a certain solubilization capacity, and many studies have been conducted in enhanced oil recovery (EOR).14 However, there are few studies on the solubilization performance of surfactant in imbibition, and whether there is a certain relationship between the solubilization properties and the imbibition capability remains to be tested. The solubilization ratio is defined as the ratio of the oil or water volume in the emulsion to the weight of the surfactant.24,25
 | (2) |
 | (3) |
The synthetic oil was blended with the surfactant solutions with various concentrations at a volume ratio of 1![[thin space (1/6-em)]](https://www.rsc.org/images/entities/char_2009.gif) :
:![[thin space (1/6-em)]](https://www.rsc.org/images/entities/char_2009.gif) 1. The mixture was then emulsified by a T10 disperser for 3 min before it was placed in a water bath at 45 °C. The volume of oil phase, middle phase, and water phase were recorded over time, and the equilibrium values were used to calculate the solubilization ratios.
1. The mixture was then emulsified by a T10 disperser for 3 min before it was placed in a water bath at 45 °C. The volume of oil phase, middle phase, and water phase were recorded over time, and the equilibrium values were used to calculate the solubilization ratios.
2.5. Emulsion stability
The zeta potential (ζ), an indicator of the emulsion stability,26,27 of the emulsion samples were obtained using a NanoBrook 90Plus ZetaPALS (Brookhaven, USA). The Smoluchowski model was used to process the experimental data. For each sample, average of three measurements was taken as the final result. Besides, a small drop of the middle phase was loaded to a DM3000B Microscope (Leica, Germany) and analyzed by the Image Pro Plus V6.0 software to attain the droplet morphology and size distribution.2.6. Thermogravimetric analysis (TGA)
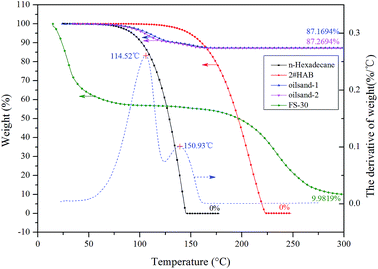
TGA has unique advantages in identifying the displacement sequence of each component of oil during the entire imbibition process.18,28 A Q5000IR Thermal Gravimetric Analyzer (TA, USA) and platinum crucibles were used in this work. The accuracy of TGA was 1 × 10⁻⁵ mg which was exceptional compared with the conventional volumetric method for imbibition recovery. High purity nitrogen (99.999%) was applied throughout the experiments to avoid the contact with external oxygen. Only physical changes were involved in the liquid–gas transition during the heating process due to protective effect of nitrogen gas. As stated before, the two components in the synthetic oil possess different boiling points, thereby they escaped at varying times when the synthetic oil was heated, leading to the continuous mass change that can be monitored and recorded by TGA. The temperature rose from room temperature to 300 °C with a heating rate of 3 °C min−1 to ensure sufficient and effective heating. Independent TGA measurements of materials involved in the experiment are presented in Fig. 4.Upon heating, the n-hexadecane and HAB could vanish completely (residual weight was 0%), so the residual of oil sands was mostly quartz sands. The proportional mass change of each component could be obtained through integrating the peak areas under the derivative curves (the endothermic peak of the two components was 114.52 °C and 150.93 °C, respectively). The measurement error was around 2.9 × 10⁻³ mg. Because the mass fraction of surfactant in solution is only 0.01%–0.30%, the highest value of residual surfactant is only 0.030% (less than 8.7 × 10⁻⁴ mg). It was noted that the residual weight of the applied surfactant was omitted in TGA due to its fairly low amount.
3. Results and discussions
3.1. Adhesion force
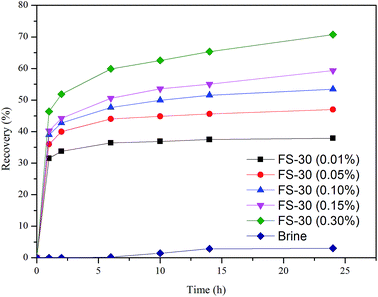
To identify the key controlling factors of surfactant-assisted imbibition, the oil sand imbibition experiment was carried out at 45 °C in an imbibition cell and the imbibition recovery was accurately measured by the TGA. As illustrated in Fig. 5, the addition of surfactant posed a significant impact on the imbibition recovery. It was well known that surfactants could change the oil/water interfacial tension (IFT) and alter the wettability (contact angle) of solid surfaces.29 For this reason, surfactants would affect the adhesion between oil and solids as shown in the Young equation.
 | (4) |
The γOA![[thin space (1/6-em)]](https://www.rsc.org/images/entities/char_2009.gif) cos
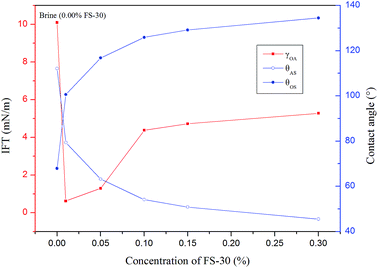
cos![[thin space (1/6-em)]](https://www.rsc.org/images/entities/char_2009.gif) θ is also known as the adhesion tension that indicated the adhesion capability between solids and liquids.31 The IFT and CA of FS-30 aqueous solutions with different concentrations are shown in Fig. 6. Using the CA and IFT value of the equilibrium time, the oil-solid adhesion tension (γOA
θ is also known as the adhesion tension that indicated the adhesion capability between solids and liquids.31 The IFT and CA of FS-30 aqueous solutions with different concentrations are shown in Fig. 6. Using the CA and IFT value of the equilibrium time, the oil-solid adhesion tension (γOA![[thin space (1/6-em)]](https://www.rsc.org/images/entities/char_2009.gif) cos
cos![[thin space (1/6-em)]](https://www.rsc.org/images/entities/char_2009.gif) θOS) and capillary force (PC) in pores were summarized in Table 2.
θOS) and capillary force (PC) in pores were summarized in Table 2.
| Aqueous phase | γOA![[thin space (1/6-em)]](https://www.rsc.org/images/entities/char_2009.gif) cos cos![[thin space (1/6-em)]](https://www.rsc.org/images/entities/char_2009.gif) θOS (mN m−1) θOS (mN m−1) |
PC(MPa) | Ultimate imbibition recovery (%) |
|---|---|---|---|
| Brine | 3.7995 | −5.0058 | 3.0 |
| 0.01% FS-30 | −0.1144 | 0.1507 | 37.9 |
| 0.05% FS-30 | −0.5796 | 0.7637 | 47.0 |
| 0.10% FS-30 | −2.5647 | 3.3791 | 53.4 |
| 0.15% FS-30 | −2.9809 | 3.9274 | 59.3 |
| 0.30% FS-30 | −3.7002 | 4.8751 | 70.8 |
As was seen in Table 2, the γOA![[thin space (1/6-em)]](https://www.rsc.org/images/entities/char_2009.gif) cos
cos![[thin space (1/6-em)]](https://www.rsc.org/images/entities/char_2009.gif) θOS was positive in the brine, suggesting the oil/solid adhesion was intense. Therefore, it was less likely for the oil to desorb from the rock surface. The alterations of adhesion-tension results the spontaneous desorbing of oil from the rock which are subsequently mobilized.32 Upon the addition of FS-30, the γOA
θOS was positive in the brine, suggesting the oil/solid adhesion was intense. Therefore, it was less likely for the oil to desorb from the rock surface. The alterations of adhesion-tension results the spontaneous desorbing of oil from the rock which are subsequently mobilized.32 Upon the addition of FS-30, the γOA![[thin space (1/6-em)]](https://www.rsc.org/images/entities/char_2009.gif) cos
cos![[thin space (1/6-em)]](https://www.rsc.org/images/entities/char_2009.gif) θOS became negative, such that the oil drop could be stripped more easily. Compared with low concentration FS-30 solution, the arrangement density of molecules on the solid surface is higher in high concentration solution, which results in stronger ability to change wettability. The 0.30 wt% FS-30 solution exhibited the greatest capability to alter the wettability and led to the highest capillary pressure and imbibition recovery owing to most adequate surfactants adsorbed onto the solid surface.
θOS became negative, such that the oil drop could be stripped more easily. Compared with low concentration FS-30 solution, the arrangement density of molecules on the solid surface is higher in high concentration solution, which results in stronger ability to change wettability. The 0.30 wt% FS-30 solution exhibited the greatest capability to alter the wettability and led to the highest capillary pressure and imbibition recovery owing to most adequate surfactants adsorbed onto the solid surface.
3.2. Capillary pressure
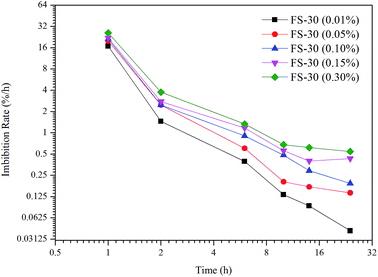
Numerous studies have concluded that the predominant driving force of spontaneous imbibition is the capillary pressure (PC),7–9 which was a function of IFT, CA, and capillary radius. As shown in Table 2, the PC was negative in the brine, which inhibited the imbibition process. When the surfactants were present, the PC became positive and thus could facilitate the imbibition. To further understand the correlation between the driving force and the recovery of spontaneous imbibition, the derivative of imbibition recovery over time was obtained. Fig. 7 demonstrates that the greater the driving force was, the higher the imbibition rate could achieve. As shown in Table 2, the PC value of 0.3% FS-30 is the highest of 4.8751 MPa, so its imbibition rate is the fastest at all times. In the case of anionic and nonionic surfactants, the oil/water IFT was negatively correlated with the surfactant concentration.33 However, the tendency was the opposite when it came to the FS-30 solution. As stated above, the FS-30 was a fluorocarbon surfactant, which indicating that almost all or part of the hydrogen atoms on the backbone of the surfactant were replaced by fluorine atoms. Since fluorine atoms have relatively high oxidation potential and ionization energy, the bond energy of fluorocarbon bond was so high that fluorocarbon chain tended to be extremely stable. In addition, it was hard to polarize the fluorine atoms, therefore the polarity of fluorocarbon chains was weak than that of hydrocarbon chains. Therefore, the high concentration of FS-30 has higher IFT, so that the PC is higher, which is favorable for imbibition. The surfactants in the bulk phase gradually migrated to the interface as time went on, resulting in the decrease of the bulk surfactant concentration and the decline in the imbibition rate. Although gravity might play a critical role in tall matrix blocks, it can probably be neglected in small matrix blocks.34,35 Consequently, increasing the capillary pressure was the key to obtain satisfactory imbibition recovery.3.3. Solubilization and emulsification
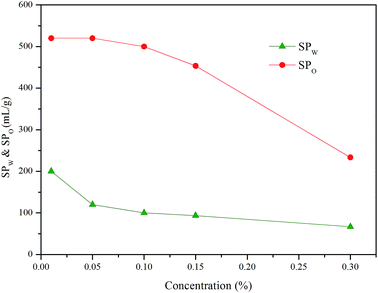
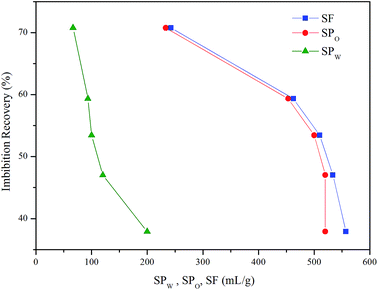
Some studies have shown that solubilization and emulsification occurs during chemical imbibition and has an effect on imbibition recovery.6,13,36 In order to study the effects on imbibition process, the solubilization ratios and emulsion stability were studied in this section.Fig. 9 illustrated the dependence of the solubilization ratios of oil/water on imbibition recovery. Clearly, the imbibition recovery decreased with the increasing water phase solubilization ratios. The correlation between SPW and imbibition recovery suggested that a higher water solubilization ratio was unfavorable to the imbibition process. Likewise, the imbibition recovery decreased with the increasing oil solubilization ratios (SPO). In order to establish the correlation between the ultimate imbibition recovery and the combined effect of SPW/SPO, SF is defined as the solubilization factor
 | (5) |
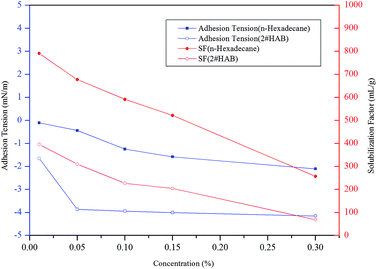
SF indicated the total capacity of the unit mass of surfactant to solubilize oil and water. As demonstrated in Fig. 8, the imbibition recovery was negatively correlated to the SF. When the imbibition recovery reached the highest value of 70.8%, the SF was the minimum (242.7 mL g−1). This implied that higher solubilization ratio was detrimental to the occurrence of imbibition. Previous studies have also revealed that the IFT was usually ultra-low (10−3 mN m−1) when the optimum solubilization ratio is obtained.37–39 However, IFT should be moderately low to cause water imbibe to the pore40 rather than to reach an ultra-low value that the PC (the main driving force of imbibition4) also reaches an ultra-low range and not conducive to the displacement of oil.33 For better imbibition recovery, the system should have small SF value.
| Aqueous phase | Zeta potential, |ζ| (mV) | Mean diameter(μm) |
|---|---|---|
| 0.01% FS-30 | 8.8 | 102.4 |
| 0.05% FS-30 | 9.7 | 91.9 |
| 0.10% FS-30 | 10.3 | 65.1 |
| 0.15% FS-30 | 12.3 | 60.1 |
| 0.30% FS-30 | 15.4 | 58.5 |
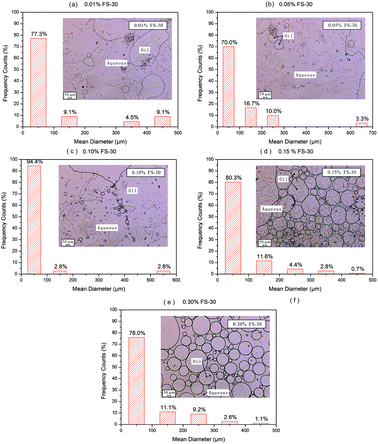
It is widely accepted that emulsions with smaller droplets greater homogeneity tend to be more stable.41 As for the O/W emulsion (Fig. 10 and Table 3), the increase in FS-30 concentration led to smaller mean droplet size. Meanwhile, the particle size distribution became more uniform. Due to the strong hydrophobicity of fluorocarbon bonds, surfactant molecules could be adsorbed rapidly at the oil-water interface to form a protective film.16 The stability of emulsion is closely related to the compressibility, interfacial pressure and interfacial viscosity of interfacial film. It has been approved that the more robust this film was, the more stable the emulsion would be.43,44 When the surfactant concentration is low, the molecules adsorbed on the interface are few, the strength of the interfacial film is poor, and the emulsion formed is unstable. When the concentration of surfactant increases to a certain extent, the interfacial film is made up of more tightly spaced orientated molecules, making the interfacial film strength high, thus improving the stability of the emulsion. Moreover, higher concentration of FS-30 displayed greater zeta potential, making it more difficult for droplets to coalesce due to the existence of the electrostatic double layer repulsion. Therefore, the emulsion with a FS-30 concentration of 0.3 wt% possessed the highest stability.
Through correlating the emulsion stability with the imbibition recovery, it was found that higher emulsion stability was beneficial to the enhancement of imbibition recovery. This might be explained by the fact that emulsifications with higher stability had smaller droplet diameters, thus a less resistance to the flow of dispersed oil droplets could be achieved. As a consequence, more oil was recovered from the oil sands.
3.4. The effect of surfactant and oil components on imbibition recovery
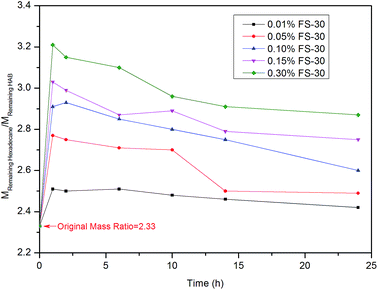
TGA as stated earlier can quantitatively characterize the change of oil composition in the imbibition process. The amount of a certain component in the oil is positively proportional to its peak area under the derivative curve of TG. Fig. 11 illustrates the mass ratio of the remaining light hydrocarbon (C16H34) and heavy hydrocarbon (2# HAB) in the oil sand over time. The synthetic oil was prepared based on a mass ratio of 7![[thin space (1/6-em)]](https://www.rsc.org/images/entities/char_2009.gif) :
:![[thin space (1/6-em)]](https://www.rsc.org/images/entities/char_2009.gif) 3 (or 2.33). However, the ratio of these two components (MC16H34
3 (or 2.33). However, the ratio of these two components (MC16H34![[thin space (1/6-em)]](https://www.rsc.org/images/entities/char_2009.gif) :
:![[thin space (1/6-em)]](https://www.rsc.org/images/entities/char_2009.gif) M2#HAB) was more than 2.33, as shown in Fig. 11. This suggested that the mass ratio of the light component in the remaining synthetic oil was higher than the original value, while the mass ratio of the heavy component was lower than the original value. In other words, the displacement velocity of heavy component was greater than the light one. The mass ratio of the two components in the 0.3% FS-30 solution was the highest, revealing that the heavy component was more prone to be displaced by the 0.3% FS-30 solution. This was because the heavy components had a longer carbon chain, and their dipole moments were larger than those of the shorter carbon chains.45 This reflected that the adhesion tension of n-hexadecane to FS-30 at any concentration was greater than that of 2# HAB, as shown in Fig. 12. Consequently, the interaction between heavy hydrocarbon and surfactants was more intense and the heavy hydrocarbon desorbed from the rock surface more easily. As mentioned earlier, lower SF was more favorable for the imbibition, so heavy hydrocarbon with lower SF was more likely to be displaced during the imbibition process.
M2#HAB) was more than 2.33, as shown in Fig. 11. This suggested that the mass ratio of the light component in the remaining synthetic oil was higher than the original value, while the mass ratio of the heavy component was lower than the original value. In other words, the displacement velocity of heavy component was greater than the light one. The mass ratio of the two components in the 0.3% FS-30 solution was the highest, revealing that the heavy component was more prone to be displaced by the 0.3% FS-30 solution. This was because the heavy components had a longer carbon chain, and their dipole moments were larger than those of the shorter carbon chains.45 This reflected that the adhesion tension of n-hexadecane to FS-30 at any concentration was greater than that of 2# HAB, as shown in Fig. 12. Consequently, the interaction between heavy hydrocarbon and surfactants was more intense and the heavy hydrocarbon desorbed from the rock surface more easily. As mentioned earlier, lower SF was more favorable for the imbibition, so heavy hydrocarbon with lower SF was more likely to be displaced during the imbibition process.
4. Conclusion
In this work, we used surfactant FS-30 as an example to investigate the effect of fluorocarbon surfactants on the spontaneous imbibition. It was speculated that fluorocarbon surfactants could facilitate the imbibition process via reducing the adhesive tension and promoting the PC, so that the crude oil would easily be displaced from the rock surface. Both solubilization and emulsification took place in the imbibition and they had evident effect on the imbibition recovery. It was also found that lower SF and higher emulsion stability were desirable to achieve a reasonable imbibition recovery. Moreover, the varying interactions between oil components (light and heavy fraction) and the FS-30 result in the different displacement order of the oil components, which provides a method for specifying the distribution of the residual oil after imbibition using TGA. Although 0.3% FS-30 can achieve the highest percolation recovery, the cost should be considered. Overall, this work may provide helpful insights to comprehensively perceive the spontaneous imbibition in real oil reservoirs.Conflicts of interest
There are no conflicts to declare.Acknowledgements
The financial support from the National Natural Science Foundation of China (Grant 51774318) and Advanced Research Project of RIPED of CNPC (Grant 2015yj-03) is acknowledged.References
- B. Liang, H. Jiang, J. Li, C. Gong, R. Jiang, S. Qu, Y. Pei and H. Yang, Energy Fuels, 2017, 473–481 CrossRef CAS.
- Q. Meng, H. Liu, J. Wang and H. Zhang, Energy Fuels, 2016, 30, 835–843 CAS.
- S. Strand, S. Dag C and T. Austad, Energy Fuels, 2003, 17, 1133–1144 CrossRef CAS.
- J. O. Alvarez and D. S. Schechter, SPE Reservoir Eval. Eng., 2017, 20, 107–117 CrossRef CAS.
- R. Gupta and K. K. Mohanty, Transp. Porous Media, 2011, 87, 635–652 CrossRef CAS.
- J. Zhang, Q. Nguyen, A. Flaaten and G. Pope, SPE Reservoir Eval. Eng., 2009, 12, 912–920 CrossRef CAS.
- Q. You, H. Wang, Y. Zhang, Y. Liu, J. Fang and C. Dai, J. Pet. Sci. Eng., 2018, 166, 375–380 CrossRef CAS.
- S. K. Masalmeh, X. D. Jing, W. V. Vark, S. Christiansen, H. V. D. Weerd and J. V. Dorp, Petrophysics, 2004, 45, 403–413 Search PubMed.
- N. Loahardjo, W. Winoto and N. R. Morrow, Petrophysics, 2013, 54, 547–553 Search PubMed.
- G. Hirasaki and D. L. Zhang, SPE J., 2004, 9, 151–162 CrossRef CAS.
- D. Wang, R. S. Seright and J. Zhang, SPE Reservoir Eval. Eng., 2012, 15, 695–705 CrossRef CAS.
- B. Adibhatla and K. Mohanty, SPE Reservoir Eval. Eng., 2008, 11, 119–130 CrossRef.
- O. Shtyka, Ł. Przybysz, M. Błaszczyk and J. Sęk, Plos One, 2017, 12, e0188376 CrossRef PubMed.
- J. Chai, H. Zhang, N. Liu, N. Liu, H. Chai and Z. Liu, J. Dispersion Sci. Technol., 2015, 36, 129–135 CrossRef CAS.
- M. Yi, S. Hong, J. R. Kim, H. Kang, J. Lee, K. Yu, S. Kee, W. Lee and K. Lee, Sol. Energy Mater. Sol. Cells, 2016, 153, 117–123 CrossRef CAS.
- Z. Wang, J. Surfactants Deterg., 2010, 13, 97 CrossRef CAS.
- Q. Dai and K. H. Chung, Fuel, 1996, 75, 220–226 CrossRef CAS.
- A. Hazra, K. Alexander, D. Dollimore and A. Riga, J. Therm. Anal. Calorim., 2004, 75, 317–330 CrossRef CAS.
- A. Hazra, K. Alexander, D. Dollimore and A. Riga, J. Therm. Anal. Calorim., 2003, 75, 317–330 CrossRef.
- T. V. Sorokina, D. Dollimore and K. S. Alexander, Thermochim. Acta, 2002, 392, 315–321 CrossRef.
- W. E. Rudzinski, T. M. Aminabhavi, A. Steve Sassman and L. M. Watkins, Energy Fuels, 2000, 14, 839–844 CrossRef CAS.
- B. Liang, H. Jiang, J. Li, C. Gong, R. Jiang, S. Qu, Y. Pei and H. Yang, Energy Fuels, 2017, 31, 473–481 CrossRef CAS.
- C. Duc, A. Vlandas, G. G. Malliaras and V. Senez, J. Phys. Chem. B, 2017, 121 Search PubMed.
- C. Huh, J. Colloid Interface Sci., 1979, 71, 408–426 CrossRef CAS.
- M. Roshanfekr and R. T. Johns, Fluid Phase Equilib., 2011, 304, 52–60 CrossRef CAS.
- J. Wang, A. Shi, D. Agyei and Q. Wang, RSC Adv., 2017, 7, 35917–35927 RSC.
- A. Wiącek and E. Chibowski, Colloids Surf., A, 1999, 159, 253–261 CrossRef.
- A. Chem, Anal. Chem., 1987, 31, 323–328 Search PubMed.
- S. G. Ravi, S. R. Shadizadeh and J. Moghaddasi, Pet. Sci. Technol., 2015, 33, 257–264 CrossRef CAS.
- J. M. Santiago, D. J. Keffer and R. M. Counce, Langmuir, 2006, 22, 5358–5365 CrossRef CAS PubMed.
- Z. H. Zhou, Q. Zhang, H. Z. Wang, Z. C. Xu, L. Zhang, D. D. Liu and L. Zhang, Colloids Surf., A, 2016, 489, 370–377 CrossRef CAS.
- A. S. Michaels and M. C. Porter, AIChE J., 965, 11, 617–624 CrossRef.
- J. O. Alvarez and D. S. Schechter, SPE Reservoir Eval. Eng., 2017, 20, 107–117 CrossRef CAS.
- A. Mirzaeipaiaman, M. Masihi and D. C. Standnes, Energy Fuels, 2013, 27, 7360–7368 CrossRef CAS.
- A. Mirzaeipaiaman and M. Masihi, Energy Fuels, 2013, 27, 4662–4676 CrossRef CAS.
- C. Feng, Y. Kong, J. Yang, Y. Zhang and Y. Li, Transp. Porous Media, 2012, 92, 619–631 CrossRef CAS.
- P. J. Liyanage, J. Lu, G. W. P. Arachchilage, U. P. Weerasooriya and G. A. Pope, J. Pet. Sci. Eng., 2015, 128, 73–85 CrossRef CAS.
- J. Lu, P. J. Liyanage, S. Solairaj, S. Adkins, G. P. Arachchilage, D. H. Kim, C. Britton, U. Weerasooriya and G. A. Pope, J. Pet. Sci. Eng., 2014, 120, 94–101 CrossRef CAS.
- Z. Chen, X. Han, I. Kurnia, J. Yu, G. Zhang and L. Li, Fuel, 2018, 232, 71–80 CrossRef CAS.
- H. Sharma, S. Dufour, U. Weerasooriya, G. A. Pope and K. Mohanty, Fuel, 2015, 140, 407–420 CrossRef CAS.
- K. C. Powell, R. Damitz and A. Chauhan, Int. J. Pharm., 2017, 521, 8–18 CrossRef CAS PubMed.
- I. Roland, G. Piel, L. Delattre and B. Evrard, Int. J. Pharm., 2003, 263, 85–94 CrossRef CAS PubMed.
- D. J. Burgess and J. K. Yoon, Colloids Surf., B, 1993, 1, 283–293 CrossRef CAS.
- J. Jiao and D. J. Burgess, J. Colloid Interface Sci., 2002, 250, 444–450 CrossRef CAS PubMed.
- I. M. Ikram and M. K. Rabinal, Appl. Surf. Sci., 2015, 332, 181–185 CrossRef CAS.
| This journal is © The Royal Society of Chemistry 2018 |


