 Open Access Article
Dropwise condensation on bioinspired hydrophilic-slippery surface
L. Guo and
G. H. Tang *
*
MOE Key Laboratory of Thermo-Fluid Science and Engineering, School of Energy and Power Engineering, Xi'an Jiaotong University, Xi'an 710049, P. R. China. E-mail: ghtang@mail.xjtu.edu.cn; Fax: +86-29-82665445; Tel: +86-29-82665319
First published on 26th November 2018
Abstract
To promote the water vapor condensation efficiency in the presence of a non-condensable gas, both high nucleation rate and efficient droplet departure are desired on the condensing surface. Superhydrophobic surfaces with large water contact angles ensure the dropwise condensation mode and efficient droplet departure ability. Alternatively, efficient nucleation requires the surface to be hydrophilic. To combine these two seemingly contradictory factors on a single surface, we presented a copper-based hydrophilic-slippery surface in this study by depositing a lubricant (trimethoxysilane) on the microstructured copper substrate. The water droplet had both low contact angles and sliding angles on the surface, and stable dropwise condensation could be realized with and without non-condensable gas. The present hydrophilic-slippery surface demonstrated promising potential to enhance condensation heat transfer, particularly for cases with non-condensable gas. Improved droplet mobility was observed as compared to a superhydrophobic surface, hydrophobic surface, and hydrophobic-slippery surface. The most attractive feature lies in the enhanced nucleation process due to hydrophilicity, which is more favorable as it requires small subcooling degree and large non-condensable gas content. By revealing that a sliding angle could be accompanied by a small contact angle, this hydrophilic-slippery surface could improve our understanding in designing new functional surfaces for phase change, anti-icing, self-cleaning, and anti-fouling applications.
1. Introduction
The vapor condensation heat transfer process in the presence of non-condensable gas (NCG) is widely observed in several industrial fields, such as seawater desalination, fog collection, energy utilization, chemical industry, energy saving, water saving, nuclear industry, etc.1,2 The mechanism of condensation involving NCG is obviously different from that observed in pure water vapor condensation.3 When the dew point evaporation technology is used for desalination, air is used as the carrier gas, and pre-heated seawater or brackish water is used to humidify and dehumidify, yielding fresh water: the NCG in the condensation process has a mass content of 50–90%.1 In the process of flue gas latent heat recovery in gas boilers, NCG accounts for about 80% of the total volume, and the volume of water vapor accounts for about 20%.2 These industrial processes inevitably face the problem of water vapor condensation in the presence of NCG, whose presence complicates the condensation heat transfer process, increases power consumption, and deteriorates performance. Therefore, it is of significant importance to determine methods to enhance the heat transfer performance of vapor condensation in the presence of NCG.In 1929, Othmer4 firstly conducted experimental research of steam condensation in the presence of NCG. His experimental results showed that the surface heat transfer coefficient of a copper tube could decrease to 50% when the air volume fraction in the boiler rose from 0 to 0.5%. Thereafter, several experimental studies5–7 have been conducted to investigate the effect of NCG during condensation on the horizontal or vertical surfaces and a variety of NCG types have been employed, namely, air, nitrogen, argon, neon, hydrogen, etc. The results of these studies have shown that every type of NCG can inhibit condensation heat transfer. It has been reported that vapor condensation includes filmwise condensation (FWC) and dropwise condensation (DWC). DWC is the preferred condensation mode due to its better thermal performance. However, there have been a large number of studies on FWC with NCG involving experimental8,9 and numerical simulation methods;10,11 however, studies related to DWC with NCG are limited. In the 1960s, Tanner et al.12 firstly conducted an experimental study to compare pure-steam DWC with NCG DWC on a vertical wall under low-pressure conditions. The results revealed that the heat transfer coefficient was independent of NCG at lower concentrations, but the inhibition of condensation increased with the NCG concentrations. Since then, studies on DWC with NCG have not been conducted for a long time until the recent successful fabrication of several functioned surfaces with specific wettability, which has highlighted this topic once again.13,14 It is widely observed and believed that DWC forms on a hydrophobic surface, while FWC occurs on a hydrophilic surface. According to this idea, various hydrophobic surfaces (HPOs) or superhydrophobic surfaces (SHPOs) have been fabricated based on the lotus effect.15 Here, water droplets are suspended on a composite solid–air interface caused by the air trapped in the micro/nanostructures and high surface free energy, because of which the droplets can roll away easily. The improved mobility of droplets is demonstrated to successfully enhance the heat transfer characteristics of DWC, particularly when coalescence-induced droplet jumping occurs.16 However, it is found that a SHPO could impede the nucleation process because according to the nucleation theory, the presence of a large contact angle (CA) elevates the formation energy barrier of a liquid cluster.17 This problem is particularly serious when the condensation suffers from small subcooling degree and the existence of NCG. Moreover, the coalescence-induced jumping effect on SHPOs does not only requires extremely small surface adhesion and weak wettability, but it is also prone to losing the jumping ability under a large sub-cooling degree (common occurrence in condensation with NCGs).18
Water collection ability of living things has enabled various inspirational ways of promoting condensation. For example, a superhydrophilic surface with a honeycomb structure on the skin of several lizards facilitates water absorption from the air and the condensed water is transported into their mouth by a capillary network on the skin.19 Spider silk is composed of humidity-sensitive hydrophilic flabelliform proteins and can form periodic spindle-shaped knots after wetting.20 Directional water collection can begin owing to the capillary propulsion stimulated by the conical geometry of the spindle knots. Certain cacti possess conical spines and trichomes with a hydrophilic surface and hierarchical grooves such that water droplets can be efficiently transported by the Laplace pressure and wettability gradient.21,22 All the abovementioned examples have one thing in common: a hydrophilic surface. It has been reported that a hydrophilic surface ensures a higher nucleation process than the hydrophobic surface. These living prototypes demonstrate that the nucleation ability is also a critical factor contributing toward efficient water harvesting apart from the high droplet mobility, particularly for the cases with NCG in which the nucleation process is impeded by the air layer.
Motivated by these living prototypes, various biomimetic artificial surfaces have been developed that can combine hydrophilicity with high droplet mobility. The existing methods to combine these two factors are summarized in three ways according to different driving forces. (i) Fabricate a hydrophilic surface and arrange conical geometries inspired by spider silk. Droplets can condensate easily on the hydrophilic surface and spontaneously move due to the Laplace pressure gradient.23,24 (ii) Fabricate a surface with a wettability gradient starting from the hydrophilic patterns. Without external forces, droplets can move directionally from the hydrophobic region to the hydrophilic region due to the wettability gradient.25–28 The first two ways can be combined by fabricating a conical fiber surface with a wettability gradient,29 mimicking a cactus spine21 with a gradient in both curvature and wettability. (iii) Fabricate a surface with mixed wettability patterns of hydrophilicity and hydrophobicity, mimicking a desert beetle's back. For the first and second ways, in spite of the effective water collection on the roughness-gradient conical fiber, it is difficult to apply conical geometry in the case of large-scale flat surfaces extensively existing in industries. It seems to be acceptable that the hydrophobicity for efficient water transport essentially contradicts the hydrophilicity for condensation enhancement. Therefore, the third way provides an attractive solution to this contradiction based on a spatial combination of hydrophobicity and hydrophilicity. Various methods have been reported in the literature to fabricate hydrophilic–hydrophobic surfaces, and the nucleation density and condensate removal efficiency are successfully improved.30–33 However, an undesired pinning effect can be observed on the border of different wettability under certain conditions.34,35
Although hydrophobicity is essentially incompatible with hydrophilicity, there is no evidence that high nucleation ability and efficient droplet shedding are naturally contradictory. An alternative inspiration to improve droplet mobility, different from the lotus effect, is observed in the Nepenthes pitcher plant,36,37 where an intermediary liquid is locked within the surface microtextures, resulting in a liquid film on its surface. Inspired by this, a slippery liquid-infused porous surface or an oil-infused hydrophobic surface38 have been recently proposed, recommending a lubricating liquid coating on the microstructured surface. This surface exhibits excellent omniphobic, anti-icing, antifrosting, and antifouling characteristics.39–43 The high droplet mobility of an oil-infused hydrophobic surface could be attributed to the low friction of the composite water–liquid/solid interface instead of the traditional water–solid interface. It is promising to fabricate a hydrophilic surface with a small sliding angle (SA) to combine high nucleation ability and efficient droplet shedding.
As mentioned above, a condensing surface is required to have both high nucleation ability and efficient droplet mobility to enhance the heat transfer performance of vapor condensation. The nucleation ability is an important, but often neglected, factor, which is highlighted in the cases with NCG where the nucleation process is impeded by the air layer. Superhydrophobicity—favorable for high droplet mobility—is incompatible with superhydrophilicity that favors efficient nucleation. In this work, we proposed a copper-based hydrophilic-slippery surface (HPI-SLIPS) motivated by the Nepenthes pitcher plant, having both small CA and small SA. This design provides a promising approach for enhancing both water nucleation and droplet departure, which successfully reconciles the two seemingly conflicting requirements and exhibits an enhanced heat and mass transfer performance.
2. Surface design and fabrication
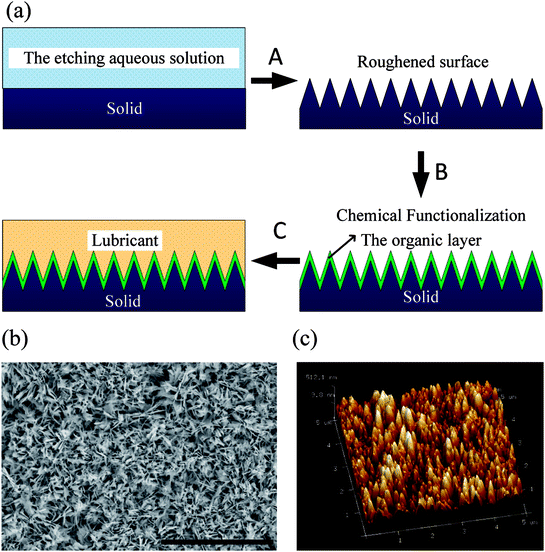
The manufacturing of HPI-SLIPS on a copper substrate is schematically illustrated in Fig. 1. Prior to surface treatment, copper test specimens were immersed in a hydrochloric acid solution (2 mol L−1) at room temperature for 10 min and rinsed with deionized water to remove the native oxide film on their surface. Then, they were immersed into an acetone bath at room temperature for 30 min, followed by ethanol and deionized water rinsing to remove organic residues on the specimens. After the pre-deposition treatment, the specimens were immersed into an etching aqueous solution consisting of 0.065 mol L−1 K2S2O8 and 2.5 mol L−1 KOH, sealed in a heatproof container, and maintained at a temperature of 70 °C for 1 h to facilitate the deposition of the generated Cu(OH)2 on the surface. Specimens were then placed in a vacuum desiccator (DZ-3AII, Taisite, China) at a temperature of 180 °C for 2 h until a layer of CuO was formed with microscale roughness. Thereafter, a rough surface with microstructures was formed (step A, Fig. 1). Then, the specimens were immersed in 0.0025 mol L−1 solution of n-octadecyl mercaptan in ethanol at a temperature of 70 °C for 1 h. This process was the chemical functionalization to deposit an organic layer on the rough surface (step B, Fig. 1). Step C involved the coating of the selected lubricant on the rough substrate. To ensure an energetically stable lubricant film within the solid nanotextures, the lubricant properties and surface roughness should meet the following two requirements:39
R(γOV![[thin space (1/6-em)]](https://www.rsc.org/images/entities/char_2009.gif) cos cos![[thin space (1/6-em)]](https://www.rsc.org/images/entities/char_2009.gif) θOV − γLV θOV − γLV![[thin space (1/6-em)]](https://www.rsc.org/images/entities/char_2009.gif) cos cos![[thin space (1/6-em)]](https://www.rsc.org/images/entities/char_2009.gif) θLV) − γLO > 0, θLV) − γLO > 0,
| (1) |
R(γOV![[thin space (1/6-em)]](https://www.rsc.org/images/entities/char_2009.gif) cos cos![[thin space (1/6-em)]](https://www.rsc.org/images/entities/char_2009.gif) θOV − γLV θOV − γLV![[thin space (1/6-em)]](https://www.rsc.org/images/entities/char_2009.gif) cos cos![[thin space (1/6-em)]](https://www.rsc.org/images/entities/char_2009.gif) θLV) + γLV − γOV > 0, θLV) + γLV − γOV > 0,
| (2) |
| R | 2.37 ± 0.03 |
| γOV [10−3 N m−1] | 26.9 ± 0.33 |
| θOV [°] | 1 ± 0 |
| γLV [10−3 N m−1] | 72.6 ± 0.89 |
| θLV [°] | 72 ± 1 |
| γLO [10−3 N m−1] | 12.1 ± 0.15 |
| ρO [g mL−1] | 1.09 |
Hydrophobic surfaces are reported to have good heat transfer performance under pure vapor condensation, while superhydrophobic surfaces perform better with NCGs. Besides, the oil-infused surface can also exhibit hydrophobicity as well as a low SA. Therefore, SHPO, HPO, and hydrophobic-slippery surface (HPO-SLIPS) were also fabricated to compare with the proposed HPI-SLIPS. The SHPO and HPO were fabricated by the coatings of the self-assembled monolayer (n-octadecyl mercaptan with oxidation) on a copper substrate and with etching treatment.2 To manufacture the HPO-SLIPS, Krytox GPL 100 (Dupont) was employed as the lubricant.42
The CA and SA were measured by an optical CA measurement apparatus (Powereach, JC2000D5, China). A water droplet was generated and controlled at 3 μL by a microsyringe and then placed on the test surface. A photograph of the droplet on the test surface was captured and the CA was measured from this picture by the Powereach software. Thereafter, the test bench was rotated slowly and the droplet behavior was simultaneously observed. As soon as the droplet started to move, the rotating test bench was stopped and the rotation angle was read and noted as the droplet SA.
3. Experiment method
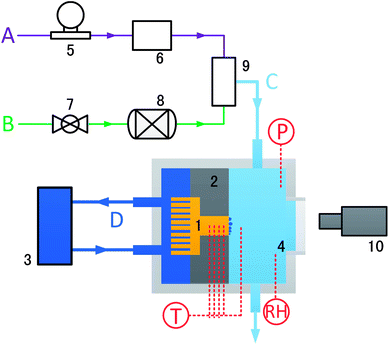
The experimental facility has four flow channels (Fig. 2). Nitrogen was used as the NCG during the condensation. Channel A refers to the water vapor flow generated by a water vapor reservoir at a controlled mass flow rate. Channel B refers to the nitrogen flow, whose flow rate was controlled by a valve and measured by a vas vortex flowmeter (LUGB-150, China). Channel C refers to the air mixed with vapor and nitrogen, which flows through the entire condensation chamber. Channel D consists of a thermostatic bath (ThermoFlex 2500) that recirculates cooling water through the cooling chamber. Different extents of surface subcooling can be obtained by changing the temperature of the cooling water. The copper test specimen (3 cm × 3 cm) was inserted into the Teflon insulator to obtain a one-dimensional steady heat conduction model. The testing surface was oriented vertically. Four equidistant (3 mm spacing) holes (Φ0.6 mm), perpendicular to the axis, were drilled into the sidewall of the copper test specimen for inserting thermocouples (TCJ36, Omega). The relative humidity of the chamber was monitored by relative humidity/temperature transmitter (HX15, Omega). The temperatures and pressures of the condensate chamber and the water vapor reservoir were monitored by T-type thermocouples (TCV-TG-0300-10-M12, Omega) and pressure sensors (Tecsis P3276, Germany), respectively. All the thermocouple measurements were referenced to the mixture of ice and water and were calibrated before conducting the measurements. All the signals were acquired by a data acquisition system (Keithley 3706A).The heat transfer coefficient (h) of the copper specimen can be obtained by
| h = k∇T/ΔT, | (3) |
| ΔT = Tv − Ts, | (4) |
The relative humidity of the vapor in the chamber was maintained at 100% by monitoring the relative humidity/temperature transmitter to make sure that the vapor was saturated. Combined with the temperature of the mixed gas (Tv), we can obtain the partial pressure of the vapor, pv. Then, the partial pressure of nitrogen (pn) was determined as the difference between the pressure of the mixed gas and pv. Finally, we can determine the nitrogen volume fraction, φv, by the Gibbs–Dalton equation. We can obtain different nitrogen volume fractions by adjusting the temperature of the mixed gas.
Each condensation experiment was performed at a specified nitrogen content and surface subcooling temperature under ambient conditions for 30 min. The basic test procedure is as follows. Firstly, the sample was attached to a Teflon block; then, the chamber was sealed and purged with nitrogen gas for 20 min to drive out the existing air in the chamber. When the chamber temperature was stabilized (implying only nitrogen flowed in it), electromagnetic flowmeter 5 was turned on to guide the water vapor into the chamber. After the chamber temperature reached a steady value (within ±5% error) by adjusting valve 5, the thermostatic bath was turned on to guide the cooling water into the system. When the four equidistant thermocouples in the sample holes reached a constant value (within ±2% error), data were then captured and averaged for 60 min. Each experiment was performed three times and using a fresh and dried sample to ensure consistent substrate characteristics between the experiments.
FWC occurs on the untreated vertical copper specimen in the presence of pure vapor. Hence, experimental results of the untreated copper surface are compared with the predictions of the Nusselt theory and the deviations between them are within 15% (Fig. 3), indicating the reliability of our experimental setup.
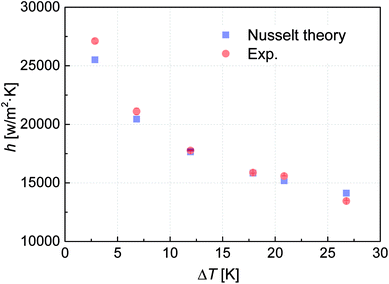 | ||
| Fig. 3 Verification of the experimental setup. Error bars represent the standard deviation of the measured data. | ||
4. Results and discussion
4.1 Effect of lubricant thickness on surface wettability
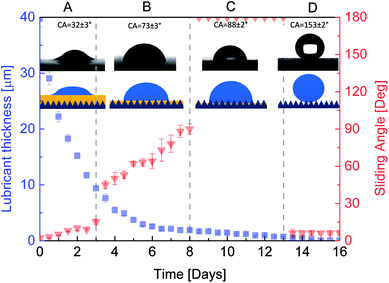
It is well known that surface wettability is sensitive to the thickness of the lubricant oil. To determine what lubricant thickness needs to be used in the experiments, firstly, we investigated the effect of lubricant thickness on surface wettability. Considering that the volume of the lubricant droplet is difficult to control and a large measurement error is involved in such small volumes, we take advantage of lubricant evaporation to make the lubricant thinner. There were a total of 60 samples placed in a large clean box under ambient conditions. Every sample was deposited with 12 lubricant droplets with around 3 μL of each droplet on the copper surface (3 cm × 3 cm) with microstructures. We took 5 samples in an electronic balance (AL204, METTLER TOLEDO) and recorded their masses every 12 h. At the same time, three samples were taken out to measure their CA and SA. The averaged values were recorded and plotted (Fig. 4). Corresponding schematic diagrams were also plotted. The lubricant thickness was calculated as follows:| th = mO/(ρOs), | (5) |
From Fig. 4, it is evident that four different wetting states were found as the lubricant got thinner. The lubricant decreased quickly in the first three days, but the CA and SA were still very low. The lubricant was able to completely cover the microtextures, so the droplet was still in a hydrophilic slippery state, marked as A. As the lubricant thickness continued to decrease, the CA and SA increased abruptly on the third day, reaching 55° and 10°, respectively. Thereafter, the CA was nearly unchanged and the SA increased slowly as the lubricant thickness decreased. This can be attributed to the fact that the microtextures were exposed and wetted by the droplet, forming a Wenzel state. However, the droplet still had high mobility on the surface due to sufficient lubricant retained in the microtextures, which can be attributed to the so-called slippery Wenzel state,44 marked as B. With further evaporation, the decreased lubricant occupied only parts of the gaps between the microtextures. The remaining lubricant was not sufficient to maintain the slippery Wenzel state, while the exposed spaces were not able to form air pockets, so the droplet completely wets the textures and pins onto the surface, forming a traditional sticky Wenzel state, marked as C. On the 13th day, there was almost no lubricant left on the surface and the air pockets between the microtextures were able to form induced by the microtextures and low free energy self-assembled monolayer, resulting in the superhydrophobic Cassie state with a large CA and small SA, marked as D. Therefore, to obtain the hydrophilic slippery state, we deposited 12 droplets with around 3 μL of each droplet when fabricating the HPI-SLIPS.
4.2 Surface wettability
The measured CA and SA of the water droplet on the five surfaces are shown in Fig. 5 with corresponding schematic diagrams for each surface. The untreated copper surface is hydrophilic (CA = 72 ± 1°), which is favorable for nucleation, but the droplet strongly pins on the surface (SA = ∞), which is difficult to move. The hydrophobicity on HPO (CA = 128 ± 1°; SA = 41 ± 2°) is induced by the low free energy self-assembled monolayer without any microtextures. The water droplet on the SHPO could form the Cassie–Baxter state due to the air trapped within the microtextures and the low free energy self-assembled monolayer, resulting in large CA (153 ± 2°) and small SA (41 ± 2°). Both the SAs on HPO-SLIPS and HPI-SLIPS are extremely low (2 ± 1°), which is attributed to the composite water–liquid/solid interface, whose friction is much lower when compared with the traditional water–solid interface. HPO-SLIPS exhibits hydrophobicity (CA = 118 ± 3°), while HPI-SLIPS (CA = 32 ± 3°) exhibits hydrophilicity, which is caused by different interface tensions between the water and lubricant oil.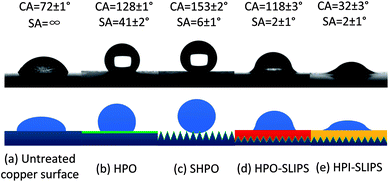 | ||
| Fig. 5 Surface wettability and corresponding illustrative diagrams of (a) untreated copper surface, (b) HPO, (c) SHPO, (d) HPO-SLIPS, and (e) HPI-SLIPS. Not to scale. | ||
4.3 Droplets behavior on condensing surface
To investigate the dynamics of the condensed droplets, the condensation processes with and without nitrogen on the five tested surfaces were observed and captured with a high-speed camera (Phantom Miro M110, USA) and a microscopic lens (QM100, QUESTAR). Example transient images of the condensed droplets on the five surfaces under stable condensation are shown in Fig. 6. From this figure, it is evident that condensates on the untreated copper surface flooded and formed a film. In contrast, condensates formed discrete droplets on SHPO, HPO, and HPO-SLIPS with large CAs independent of the presence of nitrogen. It should be noted that a sustainable DWC was also observed on HPI-SLIPS, whose CA is only 32°, which is even smaller than the untreated copper surface.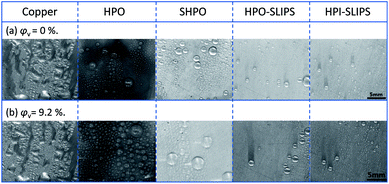 | ||
| Fig. 6 Example transient images of condensed droplets on the five surfaces under (a) pure vapor condition and (b) with NCG when the condensation becomes steady. Scale bar: 5 mm. | ||
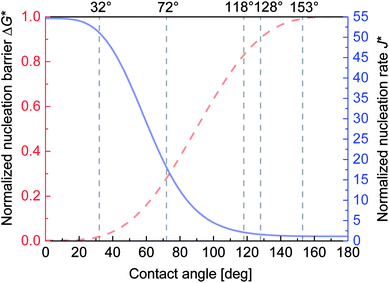
According to the classical nucleation theory,45 the minimal formation work for a liquid cluster with a diameter of r is equal to the change in the Gibbs free energy, which is known as the Gibbs free energy of the formed cluster. With increasing r, the Gibbs free energy initially increases to the maximum ΔG and then decreases. ΔG is called the Gibbs free energy barrier, which describes the formation resistance of a liquid nucleus on a flat surface and strongly depends on the CA θLV of the surface:
ΔG = πγLVr*2(2 − 3![[thin space (1/6-em)]](https://www.rsc.org/images/entities/char_2009.gif) cos cos![[thin space (1/6-em)]](https://www.rsc.org/images/entities/char_2009.gif) θLV + cos3 θLV + cos3![[thin space (1/6-em)]](https://www.rsc.org/images/entities/char_2009.gif) θLV)/3, θLV)/3,
| (6) |
J = Jo![[thin space (1/6-em)]](https://www.rsc.org/images/entities/char_2009.gif) exp(−ΔG/kT), exp(−ΔG/kT),
| (7) |
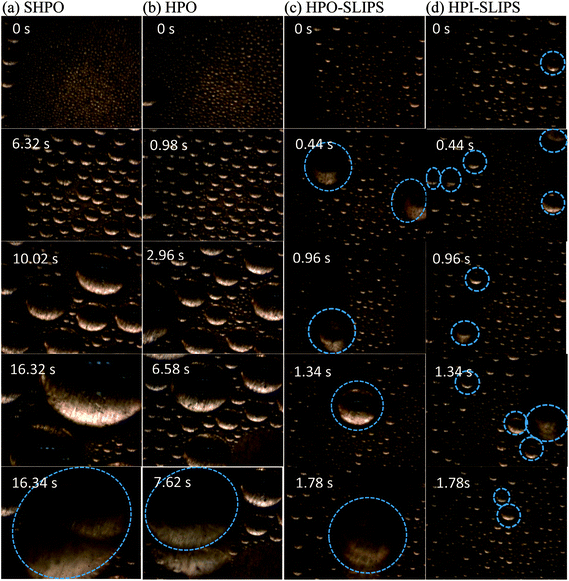
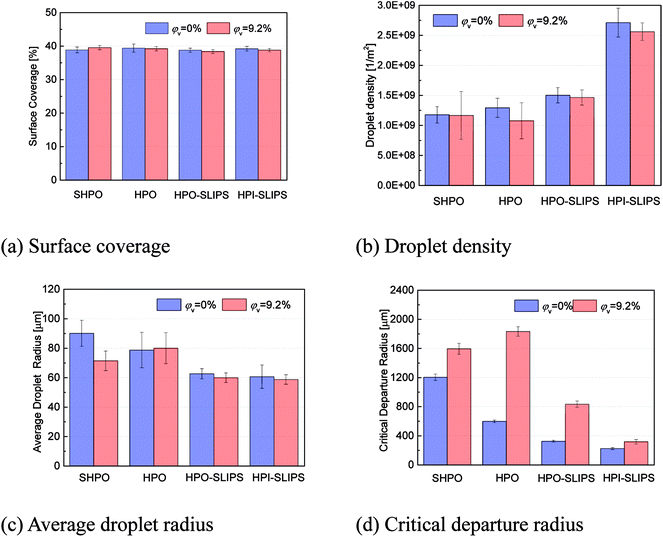
To enable a detailed comparison of the four surfaces with DWC, randomly timed images with higher magnification when the condensation became stable were captured, as shown in Fig. 8 (under pure vapor conditions) and Fig. 9 (under nitrogen). The moment when the capture process is started was defined as 0 s. Droplets observed moving are marked with dashed circles. Moreover, to formulate a quantitative analysis of the condensates, an automated image post-processing script was developed in MATLAB to recognize and characterize the size of the droplets on the surface. The surface coverage, droplet density, average droplet radius, and critical departure radius on the four surfaces were calculated every 30 s and averaged for 30 min. The results are shown in Fig. 10.
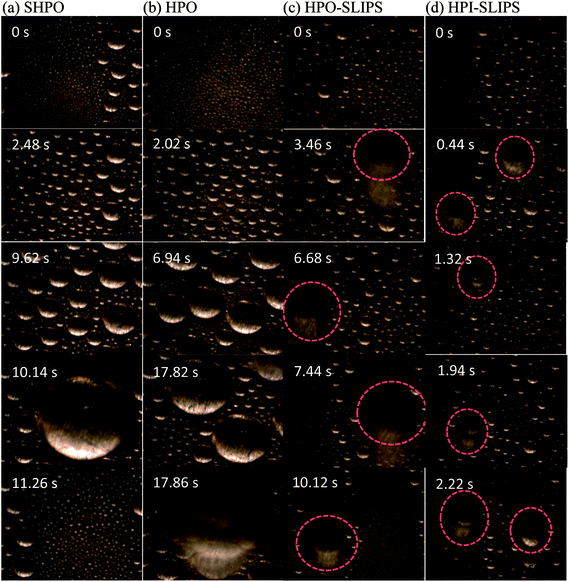 | ||
| Fig. 9 Example transient images of condensed droplets on the surfaces. φv = 9.2%; Scale bar: 500 μm. | ||
The droplet dynamics were fairly the same with and without NCG. In the early stages, all the condensates were uniformly formed on the surfaces. Droplets began to merge with their neighbors after increasing in size, and the areas were then refreshed with new small condensates beginning to nucleate and grow. When reaching the critical departure radius, condensates began falling and sweeping droplets on their way. The surface was then refreshed, allowing more sites for heat transfer and nucleation. The falling droplets increased in size by falling and coalescing with other droplets on their way, whose velocity increased due to gravity and the surface-to-kinetic energy transfer during droplet coalescences.
From Fig. 8, it is evident that under pure vapor condensation, one droplet was observed to be moving in the field of view on SHPO and HPO until 16.34 s and 7.62 s, respectively. In contrast, both HPO-SLIPS and HPI-SLIPS exhibit efficient nucleation, taking less than 0.44 s for droplets to nucleate and increase up to sufficient size to be visible. In the case with NCG, the droplet growth rate on SHPO was higher than HPO, but all of them were slower than SLIPS. It took 3.46 s to observe the droplet to move on HPO-SLIPS. However, it is surprisingly quick for droplets to move on HPI-SLIPS, which was as short as 0.44 s—the same as that in the case of pure vapor condensation, exhibiting efficient nucleation even with NCG. There were obviously more droplets observed moving on the HPI-SLIPS than the other three surfaces under pure vapor conditions. When NCG was present, a nitrogen layer was formed beneath the condensing surface. The nucleation was impeded and droplets found moving were, therefore, decreased. HPI-SLIPS still had the largest number of moving droplets observed despite being remarkably less than that under pure vapor condition. The critical departure radii on SHPO and HPO were larger than the field of view, so there were no moving droplets marked in Fig. 9(a) and (b).
The calculated critical departure radius on the HPI-SLIPS was about 220 μm (Fig. 10(a)), which was the smallest among these four surfaces. Moreover, the number of condensed droplets on the HPI-SLIPS was far more than those on the other three surfaces with smaller average droplet radii (Fig. 10(b) and (c)). Hence, the condensates were able to actively merge with each other from the earliest stage and were removed with small departure radii under gravity during condensation. It should be noted that the critical departure radius of the HPI-SLIPS was smaller than that of HPO-SLIPS despite the same small SA (Fig. 10(d)). According to ref. 46, the critical departure radius should be the same if the SA is maintained to the same value. However, in our cases, condensates on HPI-SLIPS cannot only be driven by gravity, but also be driven by droplet coalescence. Considering that there were many more condensed droplets on HPI-SLIPS, droplets coalesced more frequently, thereby generating more kinetic energy and resulting in a smaller critical departure radius and larger droplet velocity than those in HPO-SLIPS. It should be noted that the droplet falling velocities on SHPO and HPO were higher, which should be attributed to the much larger droplet weight and dominating effect of gravity. However, the large critical departure radius made the high falling velocity meaningless. With regard to condensation with nitrogen, the critical departure radius was increased, droplet density and average droplet radius decreased, and droplets moved slower on the condensing surface, which was caused by the nitrogen layer beneath the condensing surface.
4.4 Heat transfer performance on HPI-SLIPS with and without NCG
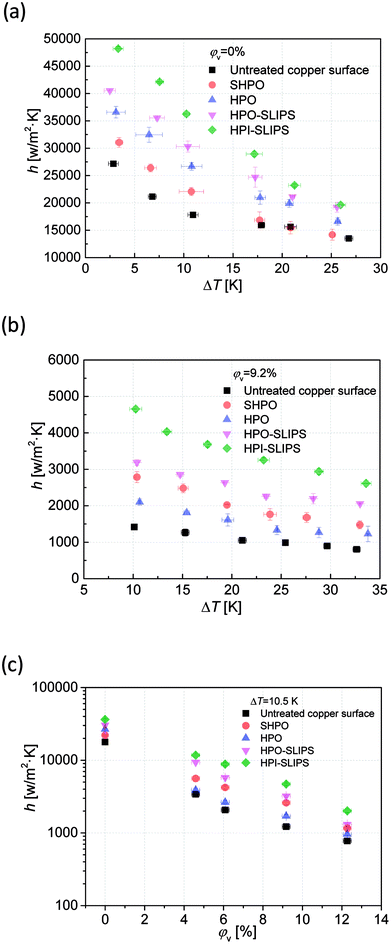
The heat transfer coefficients of pure vapor condensation on the untreated copper surface, SHPO, HPO, HPO-SLIPS, and HPI-SLIPS under different subcooling degrees were measured and shown in Fig. 11(a). The untreated copper surface had the lowest heat transfer coefficient because of the large thermal resistance caused by the flooded liquid film. All the other four surfaces maintained steady DWC mode but differed in heat transfer performance. The heat transfer coefficients of SHPO, HPO, HPO-SLIPS, and HPI-SLIPS increased sequentially, regardless of the subcooling degree. The condensation heat transfer coefficient on HPI-SLIPS was enhanced by 38.7–55.4% and 2.2–18.9% when compared to the typical SHPO and HPO-SLIPS within the subcooling degree ranging from 24 K to 2 K, respectively. This improvement was higher when the subcooling degree was lower.The effects of the NCG on the heat transfer performance along with the subcooling degree and nitrogen content are shown in Fig. 11(b) and (c). The untreated copper surface still had the worst heat transfer performance, but the SHPO performed better than the HPO. This is because SHPO had smaller CA hysteresis when there was nitrogen beneath the surface. Air pockets were able to form in the microtextures and Cassie–Baxter state condensates were able to form, leading to higher droplet mobility than that observed in the HPO. However, in pure vapor condensation, droplets condensed within the microstructures and formed the undesired sticky Wenzel state. The pinning contact line made the droplet hard to move. It should be noted that the HPI-SLIPS still had the highest heat transfer coefficient with nitrogen. The condensation heat transfer coefficient on HPI-SLIPS was enhanced by 113.8–120.3% and 27.4–44.8% as compared to those of HPO and HPO-SLIPS within the subcooling degree from 33.6 K to 10 K when the nitrogen volumetric content was 9.2% (see Fig. 11(b)). Moreover, this enhancement improved when the nitrogen content increased (see Fig. 11(c)). The measured droplet density on the HPI-SLIPS reached 2.71 × 10⁹/m2 (φv = 0%) and 2.56 × 10⁹/m2 (φv = 9.2%), which was almost twice as the other surfaces. Combined with a smaller average droplet radius and a smaller droplet departure radius, there were an increased number of smaller droplets existing on HPI-SLIPS. Droplets with small radii and small CAs were more efficient for heat transfer than large droplets. On the other hand, a large NCG amount leads to an increase in the thickness of the NCG layer above the condensates and further results in larger thermal resistance. Therefore, the actual temperature of the saturated vapor above the solid surface is reduced, which means that the effective subcooling degree is reduced. A decreased subcooling degree leads to an increase in the energy barrier of the condensation formation. Therefore, the enhancement of the HPI-SLIPS on the nucleation ability is highlighted, particularly when the NCG content is very high when compared with the HPO-SLIPS surface. Further, these frequently sliding droplets cause disturbance to the NCG layer, which also reduces the thermal resistance and facilitates heat transfer. In addition, considering that the evaporation rate of the lubricant decreases as the circumstance temperature decreases, the HPI-SLIPS will have higher sustainability with an increase in NCG content.
The promising potential of HPI-SLIPS, with efficient nucleation and high droplet mobility, to enhance condensation heat transfer was shown, particularly for cases with NCG. However, there are still certain issues that need to be resolved for engineering applications. Lubricant drainage faced by the lubricant-impregnated surface is an inevitable problem. For the application of condensation, the temperature of the condensing surface could be higher than the ambient conditions, which might expedite the lubricant evaporation process. Methods to retain the lubricant on the surface and achieve longer sustainability should be explored in future works.
5. Conclusions
In this work, a copper-based HPI-SLIPS with both low water contact angle and small SA was fabricated. Stable DWC was observed and enhanced heat transfer coefficient was tested for the first time on HPI-SLIPS with NCG. When the nitrogen volumetric content was 9.2%, the heat transfer coefficient for HPI-SLIPS was enhanced by 113.8–120.3% and 27.4–44.8% as compared to those of HPO and HPO-SLIPS, respectively, within the subcooling degree ranging from 33.6 K to 10 K. The present HPI-SLIPS demonstrated an effective enhancement of heat transfer, which can be attributed to the efficient nucleation ability and high droplet mobility, particularly highlighted for a small subcooling degree or large NCG content. The present HPI-SLIPS reveals that the SA can be accompanied by a small CA, which could improve our understanding in designing new functional surfaces for phase change, anti-icing, self-cleaning, and anti-fouling applications.Conflicts of interest
There are no conflicts to declare.Acknowledgements
We gratefully acknowledge the fundings from the National Key Research and Development Program of China under Grant No. 2018YFB0604303, the National Natural Science Foundation of China under Grant No. 51576156 and No. 51825604.References
- A. D. Khawaji, I. K. Kutubkhanah and J. M. Wie, Desalination, 2008, 221, 47–69 CrossRef CAS.
- H. W. Hu, G. H. Tang and D. Niu, Int. J. Heat Mass Transfer, 2015, 85, 513–523 CrossRef CAS.
- J. Huang, J. X. Zhang and L. Wang, Appl. Therm. Eng., 2015, 89, 469–484 CrossRef CAS.
- D. F. Othmer, Ind. Eng. Chem., 1929, 21, 577–583 Search PubMed.
- J. Meisenburg, R. M. Boarts and W. L. Badger, Trans. Am. Inst. Chem. Eng., 1935, 31, 622–637 Search PubMed.
- H. K. Al-Diwany and J. W. Rose, Int. J. Heat Mass Transfer, 1973, 16, 1359–1369 CrossRef CAS.
- D. G. Kroger and W. M. Rohsenow, Int. J. Heat Mass Transfer, 1968, 11, 15–26 CrossRef CAS.
- J. Q. Su, Z. N. Sun and D. Y. Zhang, Ann. Nucl. Energy, 2014, 72, 268–276 CrossRef CAS.
- X. M. Wu, T. Li, Q. Y. Li and F. Q. Chu, Int. Commun. Heat Mass Transfer, 2017, 85, 124–130 CrossRef.
- G. Zschaeck, T. Frank and A. D. Burns, Nucl. Eng. Des., 2014, 279, 137–146 CrossRef CAS.
- Z. Liang and P. Keblinski, J. Chem. Phys., 2018, 148, 064708 CrossRef PubMed.
- D. W. Tanner, C. J. Potter, D. Pope and D. West, Int. J. Heat Mass Transfer, 1965, 3, 419–426 CrossRef.
- H. W. Hu and G. H. Tang, Appl. Therm. Eng., 2016, 100, 699–707 CrossRef.
- Q. Guo and P. Cheng, Int. J. Heat Mass Transfer, 2019, 128, 185–198 CrossRef CAS.
- T. Maitra, C. Antonini, M. A. Mauer, C. Stamatopoulos, M. K. Tiwari and D. Poulikakos, Nanoscale, 2014, 6, 8710 RSC.
- S. L. Wang, J. Zhang, X. Q. Yu and Y. F. Zhang, RSC Adv., 2017, 7, 27574 RSC.
- Q. Sheng, J. Sun, Q. Wang, W. Wang and H. S. Wang, Sci. Rep., 2016, 6, 30764 CrossRef CAS PubMed.
- R. F. Wen, Z. Lan, B. L. Peng, W. Xu, R. G. Yang and X. H. Ma, ACS Appl. Mater. Interfaces, 2017, 9, 13770–13777 CrossRef CAS PubMed.
- P. Comanns, C. Effertz, F. Hischen, K. Staudt, W. Bohme and W. Baumgartner, Beilstein J. Nanotechnol., 2011, 2, 204–214 CrossRef CAS PubMed.
- Y. Zheng, H. Bai, Z. Huang, X. Tian, F. Q. Nie, Y. Zhao, J. Zhai and L. Jiang, Nature, 2010, 463, 640–643 CrossRef CAS PubMed.
- J. Ju, H. Bai, Y. Zheng, T. Zhao, R. Fang and L. Jiang, Nat. Commun., 2012, 3, 1247 CrossRef PubMed.
- L. Guo and G. H. Tang, Int. J. Heat Mass Transfer, 2015, 84, 198–202 CrossRef.
- H. Bai, R. Z. Sun, J. Ju, X. Yao, Y. M. Zheng and L. Jiang, Small, 2011, 24, 3429–3433 CrossRef PubMed.
- Y. Peng, Y. X. He, S. Yang, S. Ben, M. Cao, K. Li, K. Liu and L. Jiang, Adv. Funct. Mater., 2015, 25, 5967–5971 CrossRef CAS.
- D. Hong, W. K. Cho, B. K. Kong and I. S. Choi, Langmuir, 2010, 26, 15080–15083 CrossRef CAS PubMed.
- D. J. Huang and T. S. Leu, Appl. Surf. Sci., 2013, 280, 25–32 CrossRef CAS.
- H. P. Wu, K. Zhu, B. B. Cao, Z. Zhang, B. B. Wu, L. H. Liang, G. Z. Chai and A. P. Liu, Soft Matter, 2017, 13, 2995–3002 RSC.
- Y. M. Hou, M. Yu, X. M. Chen, Z. K. Wang and S. H. Yao, ACS Nano, 2015, 9, 71–81 CrossRef CAS PubMed.
- T. Xu, Y. Lin, M. X. Zhang, W. W. Shi and Y. M. Zheng, ACS Nano, 2016, 10, 10681–10688 CrossRef CAS PubMed.
- R. P. Garrod, L. G. Harris, W. C. E. Schofield, J. McGettrick, L. J. Ward, D. O. H. Teare and J. P. S. Badyal, Langmuir, 2007, 23, 689–693 CrossRef CAS PubMed.
- D. Ishii, H. Yabu and M. Shimomura, Chem. Mater., 2009, 21, 1799–1801 CrossRef CAS.
- B. Mondal, M. M. G. Eain, Q. F. Xu, V. M. Egan, J. Punch and A. M. Lyons, ACS Appl. Mater. Interfaces, 2015, 7, 23575–23588 CrossRef CAS PubMed.
- A. Lee, M. W. Moon, H. Lim, W. D. Kim and H. Y. Kim, Langmuir, 2012, 28, 10183–10191 CrossRef CAS PubMed.
- B. White, A. Sarkar and A. M. Kietzig, Appl. Surf. Sci., 2013, 284, 826–836 CrossRef CAS.
- D. Preston, D. L. Mafra, N. Miljkovic, J. Kong and E. N. Wang, Nano Lett., 2015, 15, 2902–2909 CrossRef CAS PubMed.
- M. Riedel, A. Eichner and R. Jetter, Planta, 2003, 218, 87–97 CrossRef CAS PubMed.
- H. W. Chen, P. F. Zhang, L. W. Zhang, H. L. Liu, Y. Jiang, D. Y. Zhang, Z. W. Han and L. Jiang, Nature, 2016, 532, 85–89 CrossRef CAS PubMed.
- T. S. Wong, S. H. Kang, S. K. Y. Tang, E. J. Smythe, B. D. Hatton, A. Grinthal and J. Aizenberg, Nature, 2011, 477, 443–447 CrossRef CAS PubMed.
- S. Anand, A. T. Paxson, R. Dhiman, J. D. Smith and K. K. Varanasi, ACS Nano, 2012, 6, 10122–10129 CrossRef CAS PubMed.
- F. Song, C. Q. Wu, H. L. Chen, Q. Liu, J. Y. Liu, R. R. Chen, R. M. Li and J. Wang, RSC Adv., 2017, 7, 44239 RSC.
- T. Hang, H. J. Chen, C. D. Yang, S. Xiao, G. S. Liu, D. Lin, J. Tao, J. M. Wu, B. Yang and X. Xie, RSC Adv., 2017, 7, 55812 RSC.
- C. Lee, H. Kim and Y. Nam, Langmuir, 2014, 30, 8400–8407 CrossRef CAS PubMed.
- R. Xiao, N. Miljkovic, R. Enright and E. N. Wang, Sci. Rep., 2013, 3, 1988 CrossRef PubMed.
- X. M. Dai, B. B. Stogin, S. K. Yang and T. S. Wong, ACS Nano, 2015, 9, 9260–9267 CrossRef CAS PubMed.
- K. K. Varanasi, M. Hsu, N. Bhate, W. S. Yang and T. Deng, Appl. Phys. Lett., 2009, 95, 094101 CrossRef.
- S. Kim and K. J. Kim, J. Heat Transfer, 2011, 133, 081502 CrossRef.
| This journal is © The Royal Society of Chemistry 2018 |

