 Open Access Article
Aza-BODIPY based polymeric nanoparticles for cancer cell imaging†
Kantapat Chansaenpaka,
Similan Tanjindaprateepb,
Nipha Chaicharoenaudomrungc,
Oratai Weeranantanapand,
Parinya Noisa c and
Anyanee Kamkaew
 *be
*be
aNational Nanotechnology Center, National Science and Technology Development Agency, Thailand Science Park, Pathum Thani 12120, Thailand
bSchool of Chemistry, Institute of Science, Suranaree University of Technology, Nakhon Ratchasima 30000, Thailand. E-mail: anyanee@sut.ac.th
cLaboratory of Cell-Based Assays and Innovations, School of Biotechnology, Institute of Agricultural Technology, Suranaree University of Technology, Nakhon Ratchasima 30000, Thailand
dSchool of Preclinical Sciences, Institute of Science, Suranaree University of Technology, Nakhon Ratchasima 30000, Thailand
eCenter of Excellent in Advanced Functional Materials, Suranaree University of Technology, Nakhon Ratchasima 30000, Thailand
First published on 23rd November 2018
Abstract
Near infrared (NIR) fluorescent dyes that are widely used for cancer imaging usually suffer from their hydrophobicity. To overcome this problem, a water-suspendable and biodegradable NIR-light-activating aza-BODIPY (AZB-NO2) encapsulated in polymeric nanoparticles was prepared as a new class of deep-tissue imaging agent. AZB-NO2 possesses an intense, broad NIR absorption band (600–800 nm) with a remarkably high fluorescent quantum yield. After being encapsulated with a biodegradable polycaprolactone (PCL) and a Kolliphor P188 surfactant by emulsification-solvent evaporation method, the AZB-NO2 formed a spherical shape as observed in scanning electron micrographs (SEM) with a hydrodynamic average size of 201 nm (average PDI = 0.185). The results from transmission electron micrographs (TEM) and energy dispersive X-ray spectroscopy (EDS) elemental mapping indicated that the AZB-NO2 homogeneously distributed in the polymeric shell. UV-visible-NIR and fluorescence spectra of the obtained nanoparticles, AZB-NO2@PCL, revealed that the nanoparticles prepared by using 0.8 mg dye loading exhibited the highest fluorescence quantum yield. These nanoparticles were then applied for fluorescence imaging in human glioblastoma cell line (U-251). After the cells were exposed to AZB-NO2@PCL, the materials appeared to be localized inside U-251 cells within 3 h and the fluorescence signal enhanced along with the increased incubation times. Moreover, 3D cell culture was used in this study to mimic in vivo tumor environments. The AZB-NO2@PCL exhibited bright fluorescence from U-251 cells inside 3D Ca-alginate scaffolds after 24 h incubation. Our study successfully demonstrated that the encapsulation of hydrophobic aza-BODIPY dye could enhance the water-suspendability of the dye yielding biocompatible nanoparticles efficiently used in cancer cell imaging applications.
Introduction
The development of near infrared (NIR) dyes has gained much interest in recent years owing to their potential applications in molecular imaging and therapy.1–4 NIR dyes allow for optical imaging with minimal autofluorescence from biological samples, reduced light scattering and high tissue penetration.1BF2-chelated tetraphenylazadipyrromethene known as aza-BODIPYs are fluorescent compounds that possess strong light absorption and emission with high fluorescent quantum yields as well as high stability in physiological conditions.5,6 Moreover, aza-BODIPYs can be activated by NIR light, which is suitable for deep tissue visualization. However, hydrophobicity of aza-BODIPY core limits the use in biological applications. In the past decades, many researchers focused on modifying aza-BODIPY structures to improve their hydrophilicity such as introducing hydrophilic groups onto the structure.7–12 Furthermore, nanoencapsulation of aza-BODIPY derivatives with polymeric materials can increase the ability to suspend these dyes in aqueous solutions.13–21
Polymeric nanoencapsulations are the most fashionable technique for the drug carrier due to the enhanced drug stability and suitable size for intracellular uptake.22,23 This method can also be employed for the preparation of fluorescent polymer nanoparticles (NPs) holding good water suspendability, biodegradability, and biocompatibility that are suitable for bioimaging applications.24,25 In general, there are three common methods for the nanoencapsulation of organic molecules, including, emulsification solvent-evaporation, nanoprecipitation, and self-assembly.24 The emulsification solvent-evaporation method requires a water-immiscible, volatile solvent (e.g. dichloromethane or ethyl acetate) while the nanoprecipitation method needs a water-miscible solvent (e.g. acetone or methanol). In addition, both methods generally require a surfactant and work well with homopolymer systems which are considerably different from the self-assembly method. The latter approach does not need any surfactants but only amphiphilic block-copolymers. In term of particle sizes, the NPs of around 180–210 nm were typically obtained by emulsification solvent-evaporation method26–28 while the smaller NPs with the sizes less than 100 nm were usually acquired by nanoprecipitation or self-assembly methods.24
The development of organic NIR activated dyes that are biocompatible, biodegradable with high fluorescent quantum yield in the NIR region is highly desirable for deep-tissue tumor imaging. Here, we report a facile way to prepare water-suspendable, biodegradable, and biocompatible aza-BODIPY based polymeric NPs by using emulsification solvent-evaporation method. Biodegradable polycaprolactone (PCL) and stabilizing agent Kolliphor P188 were use in the process since they were reported to be safe in drug delivery systems.29–33 Optical properties and applications of the organic NPs in cancer cell imaging were also investigated.
Results and discussion
The AZB-NO2 was synthesized according to the previous report.10 The photophysical properties of this compound were carefully investigated by UV-VIS-NIR and fluorescence spectrophotometer (Fig. 1). AZB-NO2 features broad absorption bands with absorption maximal ranging from 693 to 707 nm and emission bands centred at 731–735 nm in various solvent systems (Table 1). The quantum yields of AZB-NO2 are typical of other aza-BODIPY dyes34 and depends systematically on both polarity and proticity of solvents. As shown in Table 1, AZB-NO2 demonstrated a comparatively high fluorescent quantum yield in apolar solvent (toluene) and small polar solvent (CH2Cl2), while quantum efficiencies slightly decreased in high polar solvents, including, acetone, MeCN, and MeOH, respectively.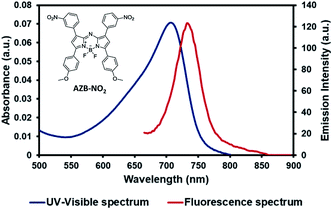 | ||
| Fig. 1 The structure of AZB-NO2 (inset), UV-visible (blue line) and fluorescence (red line, excited at 650 nm) spectra of AZB-NO2 in toluene. | ||
| Solventb | λmax (nm) | ε (M−1 cm−1) | λemissc (nm) | Δλ (nm) | Φfd (n = 3) |
|---|---|---|---|---|---|
| a 10 μM of AZB-NO2 was prepared.b Solvents were arranged according to increasing polarity from top to bottom.c Samples were excited at 650 nm.d Relative to Zn-phthalocyanine in pyridine (Φf = 0.30). | |||||
| Toluene | 707 | 4.6 × 10⁴ | 733 | 26 | 9.92 × 10⁻² (±0.28 × 10⁻²) |
| CH2Cl2 | 701 | 5.7 × 10⁴ | 735 | 34 | 8.46 × 10⁻² (±0.22 × 10⁻²) |
| Acetone | 699 | 4.2 × 10⁴ | 732 | 33 | 6.82 × 10⁻² (±0.30 × 10⁻²) |
| MeCN | 693 | 4.4 × 10⁴ | 733 | 40 | 6.46 × 10⁻² (±0.24 × 10⁻²) |
| MeOH | 696 | 4.3 × 10⁴ | 731 | 35 | 5.11 × 10⁻² (±0.33 × 10⁻²) |
Next, the octanol–water partition coefficient (P) of AZB-NO2 was determined. The log![[thin space (1/6-em)]](https://www.rsc.org/images/entities/char_2009.gif) P value of 2.48 ± 0.09 indicated the hydrophobic nature of this aza-BODIPY. The resulting lipophilic property could yield an unsatisfied biodistribution in vivo as the hydrophobic molecules often end up accumulating in liver.4,35,36 Therefore, this dye was then encapsulated into NPs by biodegradable polycaprolactone (PCL) to enhance water suspendability of the compound.
P value of 2.48 ± 0.09 indicated the hydrophobic nature of this aza-BODIPY. The resulting lipophilic property could yield an unsatisfied biodistribution in vivo as the hydrophobic molecules often end up accumulating in liver.4,35,36 Therefore, this dye was then encapsulated into NPs by biodegradable polycaprolactone (PCL) to enhance water suspendability of the compound.
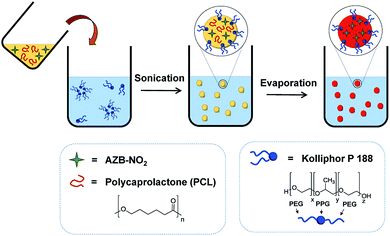
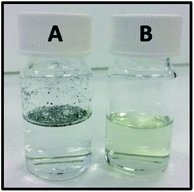
AZB-NO2 loaded PCL NPs (AZB-NO2@PCL) were prepared by oil-in-water emulsion and solvent evaporation method using the strategy shown in Scheme 1. A dichloromethane solution of AZB-NO2 (0.2, 0.4, 0.6, 0.8, 1.0, or 1.2 mg) and PCL (10 mg) were poured into an aqueous solution of Kolliphor P 188 (5% w/v), a biocompatible surfactant widely used in pharmaceutical formulations. The mixture was then stirred for 30 min prior to sonication using ultrasonic probe for 5 min. Subsequently, the organic solvent was removed under reduced pressure by rotary evaporator. After centrifugation and washing thoroughly with water, AZB-NO2@PCL were obtained. The resulting NPs can be homogeneously suspended in water (vial B), which is considerably different from the free aza-BODIPY dye, AZB-NO2, (vial A) as shown in Fig. 2. These results confirmed that the AZB-NO2 was successfully encapsulated with PCL by emulsification solvent-evaporation.
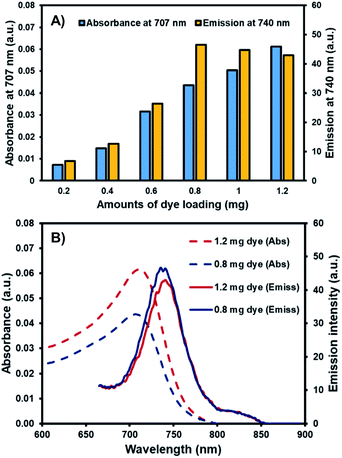
Due to its flat aromatic structure and strong intermolecular interactions, AZB-NO2 demonstrates aggregated caused quenching (ACQ) properties, which could lead to low quantum efficiencies of NPs at high dye-loading.37 To obtain an optimum brightness, AZB-NO2@PCL was prepared using different amounts of the dye feed. As shown in Table 2, the quantum yields increased with the increasing amounts of AZB-NO2 at feed changes from 0.2 to 0.8 mg (entry 1–4) and slightly decreased with the increasing amount of AZB-NO2 at feed changes from 0.8 to 1.2 mg (entry 4–6) which could be the outcomes from ACQ effects. These phenomena are consistent with results demonstrated in Fig. 3, indicating that the absorbances of the AZB-NO2@PCL increased with the increasing amount of dye feeds and dye-loading percentages whereas the emissions of these NPs displayed the maximum intensity at 0.8 mg of dye feed. The highest quantum yield value of 4.19 × 10⁻² obtained at 0.774 (±0.035)% dye loading in this work (entry 4) is comparable to the one of another aza-BODIPY nanoparticle system prepared by nanoprecipitation method (QY = 4.11 × 10⁻² acquired at 0.730 (±0.032)% dye loading).18 Apart from quantum yields, the other characteristics of the prepared NPs, including, encapsulation efficiencies (EEs), dynamic light scattering (DLS) sizes, polydispersity indices (PDIs) and zeta-potentials were also studied (Table 2). Based on these data, the EEs of the of AZB-NO2@PCL tended to decrease with the increasing of dye feed ratios, while the DLS sizes slightly increased with the increasing amount of dye feed as seen with other fluorogenic NPs.26 The PDIs of all entries were close to 0.185, suggesting small degree of polydispersity of these NPs. In addition, the zeta-potentials of all samples displayed negative values in the range from −7.03 to −6.39 mV, which could be the effects of a non-ionic surfactant, Kolliphor P 188.38
| Entrya | Amount of dye feed (mg) | Φfb (n = 3) | % Dye loadingc (n = 3) | % EEd (n = 3) | DLS size (nm) (n = 3) | PDI (n = 3) | Zeta (ζ)-potential (mV) (n = 3) |
|---|---|---|---|---|---|---|---|
| a Characteristics in each entry were derived from three different batches of nanoparticle preparation (n = 3).b Relative to Zn-phthalocyanine in pyridine (Φf = 0.30).c Dye-loading percentages were obtained from (mass of AZB-NO2 found in dried nanoparticles/total mass of dried nanoparticles) × 100.d Encapsulation efficiencies (EE) were calculated from (amount of dye encapsulated in nanoparticle/amount of dye feed) × 100. | |||||||
| 1 | 0.2 | 2.60 × 10⁻² (±0.15 × 10⁻²) | 0.263 (±0.028) | 41.4 (±2.2) | 190.9 (±7.3) | 0.175 (±0.009) | −6.39 (±0.48) |
| 2 | 0.4 | 2.72 × 10⁻² (±0.12 × 10⁻²) | 0.429 (±0.036) | 42.4 (±1.9) | 190.1 (±5.6) | 0.183 (±0.012) | −6.87 (±0.44) |
| 3 | 0.6 | 2.98 × 10⁻² (±0.17 × 10⁻²) | 0.575 (±0.031) | 30.3 (±2.4) | 194.4 (±6.0) | 0.183 (±0.007) | −6.62 (±0.55) |
| 4 | 0.8 | 4.19 × 10⁻² (±0.16 × 10⁻²) | 0.774 (±0.035) | 31.1 (±2.4) | 202.2 (±6.1) | 0.185 (±0.006) | −6.89 (±0.50) |
| 5 | 1.0 | 3.58 × 10⁻² (±0.13 × 10⁻²) | 0.913 (±0.024) | 31.2 (±1.9) | 208.9 (±4.1) | 0.184 (±0.010) | −6.97 (±0.40) |
| 6 | 1.2 | 3.14 × 10⁻² (±0.12 × 10⁻²) | 1.018 (±0.029) | 25.6 (±3.1) | 222.8 (±7.3) | 0.204 (±0.010) | −7.03 (±0.65) |
Next, other conditions on NP preparation using different amounts of Kolliphor P 188 (1, 3, 7% w/v) and sonication times (2.5, 10 min) were attempted to obtain NPs with smaller sizes and lower PDI values. The characteristics of NPs prepared by the condition in entry 4, Table 2 (dye 0.8 mg, Kolliphor P 188 5% w/v, PCL 10 mg, 5 min sonication time), were used as a reference because they held the highest quantum yield among the series. As demonstrated in Table S1,† the uses of small amount of Kolliphor P 188 leaded to the NPs with larger DLS sizes and PDI values. In addition, the NPs with larger DLS sizes but smaller PDI values were obtained when a short sonication time (2.5 min) was applied. Although a longer sonication time (10 min) caused smaller DLS sizes compared with the sizes of the reference, larger PDI values were observed indicating high degree of polydispersity of the NPs. Bases on these results, the condition in entry 4, Table 2, is still the most suitable condition for the preparation of AZB-NO2@PCL.
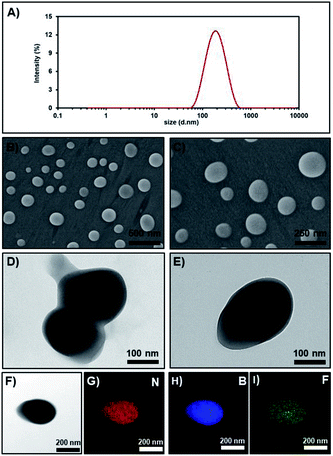
Then, the PCL NPs prepared by the condition in entry 4 were further characterized by electron microscopic techniques. The scanning electron microscope (SEM) images (Fig. 4B and C) and the transmission electron microscope (TEM) images (Fig. 4D and E) of the NPs showed a spherical shape with diameters ranging from 70–220 nm, which similar to the DLS size distribution demonstrated in Fig. 4A. Energy Dispersive X-ray Spectroscopy (EDS) elemental (boron, nitrogen and fluoride) mapping (Fig. 4F–I) confirmed the homogeneous distribution of AZB-NO2 in polymeric shells.
To ensure the stability of NPs under physiological condition, AZB-NO2@PCL were incubated in phosphate buffer solution (PBS, 0.1 M, pH 7.4) at 37 °C up to 7 days and no significant changes on DLS sizes, PDI values, and zeta potentials were observed (Table S2†), suggesting an excellent stability under this condition. Additionally, in vitro dye releasing experiment of AZB-NO2@PCL was carried out in PBS (0.1 M, pH 7.4, contain 1% (w/v) tween 80 and 5% (v/v) dimethyl sulfoxide (DMSO)) through dialysis bag method at 37 °C compared with that of free AZB-NO2 dye as shown in Fig. 5. Similar to other hydrophobic dyes,39,40 the releasing profiles indicated that the leaching of AZB-NO2 dye from the lipophilic core of the PCL NPs was negligible which is suitable for cell imaging applications.
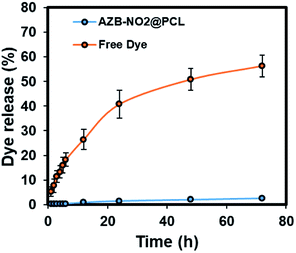 | ||
| Fig. 5 In vitro AZB-NO2 release profile from PCL NPs. Free AZB-NO2 release was used as control. Error bars represents mean ± standard deviation (n = 3). | ||
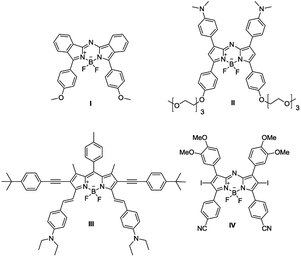
As demonstrated in the comparison table with other BODIPY-based NPs (Table 3), only AZB-NO2 was encapsulated by homopolymeric PCL with the need of surfactant (emulsion/solvent evaporation method), while the others (Fig. 6) were encapsulated by either amphiphilic polymers (PLA–PEG, DSPE–PEG) or functionalized polymer (PEG–DOX) without surfactant stabilizers (nanoprecipitation and self-assembly methods). Although the method in this work provide comparatively large particle size, it is an economy method to prepare aza-BODIPY based NPs with great stability and trivial dye release.
| Aza-BODIPY | Polymer | Surfactant | Average DLS size (nm) | Reference |
|---|---|---|---|---|
| a PLA = Polylactic acid, PEG = Polyethylene glycol, DSPE = 1,2-distearoyl-sn-glycero-3-phosphoethanolamine, DOX = doxorubicin. | ||||
| I | PLA–PEG | No | 60 | 18 |
| II | DSPE–PEG | No | 60.1 | 19 |
| III | DSPE–PEG | No | 35.3 | 20 |
| IV | PEG–DOX | No | 81.7 ± 7.5 | 21 |
| AZB-NO2 | PCL | Yes | 202.2 ± 6.1 | This work |
To ensure the biocompatibility in living cells, cytotoxicity of AZB-NO2@PCL was then studied in a human glioblastoma cell line (U-251). Two culturing systems were used in this study; one was the traditional cell culture (2D cell culture) and another one was 3D cell culture to mimic microenvironment of tumor cells inside the body. Resazurin was used to determine cytotoxicity of U-251 cells in both 2D and 3D cultures. The results (Fig. 7) showed that the cells from both culturing systems maintained full viability when exposed to AZB-NO2@PCL for 24 h and the highest concentration of the NPs was up to 100 μg mL−1 (equivalent to 40 μM of dye). These results suggested that the NPs within this concentration range were suitable to use in bioimaging.
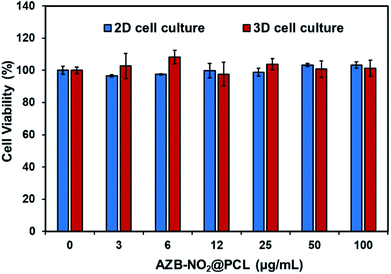 | ||
| Fig. 7 U-251 cells viability of different concentrations of AZB-NO2@PCL in 2D (blue bars) and 3D (red bars) cell culture systems incubated for 24 h. | ||
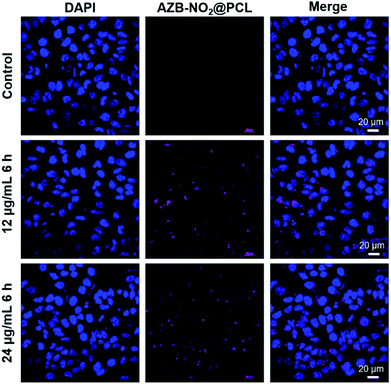
Subsequently, cellular uptake of AZB-NO2@PCL was monitored by confocal laser scanning microscopy (CLSM). U-251 cells were incubated with AZB-NO2@PCL for various times and concentrations. For 2D cell culture, the uptake of the NPs increased when the cells were incubated with greater amount of the NPs (Fig. 8). Moreover, NIR fluorescent signal was clearly observed after 3 h incubation and slightly enhanced when prolonged incubation time (Fig. S1†). The internalization of AZB-NO2@PCL inside the cancer cells was also confirmed by z-stacking images (Fig. S2†). Examination of the 3D confocal image (z-stacking) obtained for the 2D cell culture image revealed the absence of colocalization with respect to the nucleus of the cell. The top z-plane explicitly showed the presence of AZB-NO2@PCL evenly distributed in the cytosol but not colocalizing with the DAPI stained nucleus.
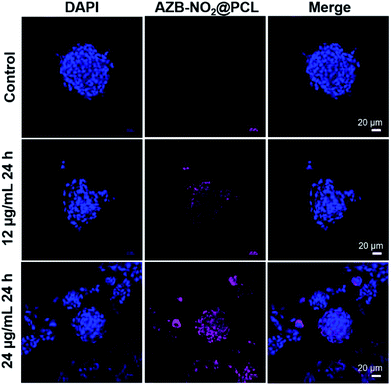
In addition, 3D cell culture was used to investigate the uptake of NPs by the cancer cells that were allowed to grow in all direction, which is similar to what happens in vivo. In this study, we created the tumour environment for U-251 cells by allowing the cells to grow inside 3D Ca-alginate scaffolds until the tumor could mimic in vivo.41 After incubating AZB-NO2@PCL with 3D cells inside Ca-alginate scaffolds for 24 h, the NIR fluorescent signal was observed with dose dependent manner (Fig. 9). The results suggested that our prepared NPs have great potential to be used as optical imaging agent in vivo.
Conclusions
Emulsification-solvent evaporation method was successfully used to encapsulate NIR-light-activating aza-BODIPY (AZB-NO2) to overcome its water solubility problem. After being encapsulated with PCL and Kolliphor P188, the resulting NPs appeared in a spherical shape as shown in SEM images with an average hydrodynamic size of 201 nm (average PDI = 0.185). TEM and EDS elemental mapping confirmed the homogeneous distribution of AZB-NO2 in the polymeric shell. Optical properties of AZB-NO2@PCL suggested that the NPs prepared by using 0.8 mg dye loading exhibited the highest fluorescence quantum yield which were then applied for fluorescence imaging in glioblastoma cell line (U-251). After the cells were exposed to AZB-NO2@PCL, the materials appeared to be localized inside U-251 cells within 3 h and the fluorescent signal enhanced along with the increased incubation times. Moreover, 3D cell culture was used in this study to mimic tumor environments. The AZB-NO2@PCL showed bright fluorescence from U-251 cells inside 3D Ca-alginate scaffolds after 24 h incubation. Our study successfully demonstrated that the encapsulation of hydrophobic aza-BODIPY dye could enhance water-suspendability and biocompatibility of the dye. The results in this study suggested that our prepared NPs have great potential to be applied in optical cancer imaging in vivo.Experimental section
Materials and instruments
AZB-NO2 was synthesized according to the previous report.10 Polycaprolactone (Mw ∼ 14![[thin space (1/6-em)]](https://www.rsc.org/images/entities/char_2009.gif) 000) and Kolliphor P 188 was purchased from Sigma Aldrich. All chemicals and solvents were used without further purifications. UV-VIS absorption and fluorescence spectra were acquired from a Cary Series UV-VIS-NIR spectrophotometer (Agilent Tech, Santa Clara, CA, USA) and a Perkin Elmer LS55 fluorescence spectrometer, respectively. The sonication processes were carried out through high intensity ultrasonic processor, VCX 500/750 (Sonics & Materials, Inc.). Dynamic light scattering (DLS) measurement was performed by Zetasizer Nano series (Malvern Panalytical). SEM images were obtained from SU-8030 Field-Emission Scanning Electron Microscope (Hitachi), TEM images and EDS elemental mappings were acquired from JEM-2100-Plus Transmission Electron Microscope (JEOL).
000) and Kolliphor P 188 was purchased from Sigma Aldrich. All chemicals and solvents were used without further purifications. UV-VIS absorption and fluorescence spectra were acquired from a Cary Series UV-VIS-NIR spectrophotometer (Agilent Tech, Santa Clara, CA, USA) and a Perkin Elmer LS55 fluorescence spectrometer, respectively. The sonication processes were carried out through high intensity ultrasonic processor, VCX 500/750 (Sonics & Materials, Inc.). Dynamic light scattering (DLS) measurement was performed by Zetasizer Nano series (Malvern Panalytical). SEM images were obtained from SU-8030 Field-Emission Scanning Electron Microscope (Hitachi), TEM images and EDS elemental mappings were acquired from JEM-2100-Plus Transmission Electron Microscope (JEOL).
Encapsulation of AZB-NO2
Dichloromethane (CH2Cl2) solution (3 mL) containing PCL (10 mg) and various amounts of AZB-NO2 (0.2, 0.4, 0.6, 0.8, 1.0, or 1.2 mg) was poured into an aqueous solution (50 mL) containing Kolliphor P 188 (2.5 g, 5% w/v) as an emulsifier. The mixture was vigorously stirred for 30 min. The resulting mixture was then sonicated for 5 min at 90% amplitude using ultrasonic probe equipped with high intensity ultrasonic processor (Sonics and Materials Inc.). The organic solvent was removed under reduced pressure using rotary evaporator. The obtained PCL nanoparticle suspension was centrifuged for 30 min at 12![[thin space (1/6-em)]](https://www.rsc.org/images/entities/char_2009.gif) 000 rpm, 4 °C and washed three times with de-ionized (DI) water to remove the excess emulsifier. During the washing process, the PCL NPs were re-dispersed into DI water by sonication. Finally, the resulting NPs were freeze-dried yielding light green powder as a final product (AZB-NO2@PCL).
000 rpm, 4 °C and washed three times with de-ionized (DI) water to remove the excess emulsifier. During the washing process, the PCL NPs were re-dispersed into DI water by sonication. Finally, the resulting NPs were freeze-dried yielding light green powder as a final product (AZB-NO2@PCL).
Octanol–water partition coefficient determination
To determine the lipophilicity of the compound, the sample of AZB-NO2 (1 mg) was dissolved in 0.5 mL of octanol and 0.5 mL of de-ionized water. After vigorous shaking for 10 min, the mixture was separated by 5 min centrifuge (5000 rpm). Then, aliquots (n = 3) of the octanol and water layers were collected and measured the UV absorbance at 700 nm. The log![[thin space (1/6-em)]](https://www.rsc.org/images/entities/char_2009.gif) P values were calculated and reported as an average of three independent measurements plus the standard deviation (S.D.).
P values were calculated and reported as an average of three independent measurements plus the standard deviation (S.D.).
Encapsulation efficiency
Encapsulation efficiency is defined as a ratio of one component (e.g. AZB-NO2) that has been successfully encapsulated into the NPs to the total amount of the component loading. To determine the encapsulation efficiency of AZB-NO2, a calibration curve was first constructed by plotting the absorbance of a series of CH2Cl2 solutions at different concentrations of AZB-NO2. The freeze-dried aza-BODIPY-encapsulated PCL NPs were then dissolved in CH2Cl2, and the absorbance at 701 nm was obtained by UV-VIS-NIR spectrophotometer. The amount of AZB-NO2 encapsulated in PCL NPs was determined from the standard calibration curve to calculate the encapsulation efficiency of AZB-NO2.Dye-loading percentage determination
Dye-loading percentages were determined from the ratio of mass of the encapsulated dye to the total mass of NPs. To obtain the dye-loading percentages of AZB-NO2@PCL, the freeze-dried aza-BODIPY-encapsulated PCL NPs were weighted to get the total mass of NPs prior to dissolving in CH2Cl2. Then, the mass of AZB-NO2 in NPs was determined from the standard calibration curve.In vitro dye-releasing experiment
The in vitro dye release was determined for AZB-NO2@PCL and free AZB-NO2 in triplicate in phosphate buffer solution (PBS) (pH 7.4) with 1% (w/v) tween 80 and 5% (v/v) DMSO. Briefly, 0.5 mg of free AZB-NO2 or 20 mg of AZB-NO2@PCL were diluted with 1 mL of PBS buffer pH 7.4 (contain 1% (w/v) tween 80 and 5% (v/v) DMSO) and sealed in dialysis bag with a molecular weight cut-off (MWCO) 12 kDa. The dialysis bag was incubated in 20 mL of pH 7.4 PBS (contain 1% (w/v) tween 80 and 5% (v/v) DMSO) at 37 °C with continuous magnetic stirring. At selected time intervals, 100 μL of release medium was taken and the AZB-NO2 content was determined by fluorescence spectrophotometer.Cell cultures
The U-251 cells were grown in plastic tissue flasks (2D) and maintained with complete medium. The complete medium contained Dulbecco's modified eagle's medium (DMEM, Hyclone), 10.0% (v/v) heat-inactivated fetal bovine serum (FBS, Hyclone), 1% (v/v) non-essential amino acids (MEM NEAA, Gibco), 1% (v/v) L-glutamine (Gibco, 1% (v/v)) penicillin–streptomycin (Pen-Strep, Gibco). For 3D cells culture systems, 3D Ca-Alginate scaffolds were generated based on a previously reported method.41 The U-251 cells were seeded onto the scaffolds in 24-well plates at 5 × 10⁵ cells per scaffold in 50 μL completed media. Cells were allowed to infiltrate the scaffold for 1 h before 1 mL complete medium was added to each well. All cells were incubated at 37 °C in a humidified incubator keeping atmospheric carbon dioxide at 5%. Fresh complete medium was changed every 2 days.Cytotoxicity of AZB-NO2@PCL
To test AZB-NO2@PCL toxicity, U-251 (5 × 10⁵ cells/well) were seeded into 12-well plates (2D) and 3D Ca-Alginate scaffolds for 7 days. The cells were treated with varying concentrations of AZB-NO2@PCL (0–100 μg mL−1) at 37 °C for 24 h. The cells were washed with PBS before adding 1 mL of resazurin solution (25 μg resazurin per 1 mL fully supplemented medium) to each well. After 40 min, the resazurin solution was transferred into a black 96-well plate to obtain fluorescence values on a microplate reader (Thermo Scientific Varioskan, USA). The fluorescence intensity of resazurin was measured by a microplate-reader at an excitation wavelength of 530 nm and an emission wavelength of 590 nm. Results were expressed as percentage of cell viability to controls.Confocal microscope
U-251 (5 × 10⁵ cells per well) were seeded on coverslips in 24-well plates (2D) and 3D Ca-Alginate scaffolds in complete medium. After 2 days of cultivation, cells from the 2D system were treated with 12, 24 μg mL−1 AZB-NO2@PCL for 6 h. For 3D system, cells were obtained after 7 days of culture and later treated with 12, 24 μg mL−1 AZB-NO2@PCL for 24 h. Cells were then washed twice in PBS, fixed with 4% paraformaldehyde in PBS at room temperature for 30 min, washed 3 times with PBS for 5 min each. Nuclei were counterstained using DAPI (Life Technologies), and the stained cells were observed under a laser scanning confocal microscope Nikon A1+ (Nikon, Tokyo, Japan) and 60× Oil Objective Lens.Conflicts of interest
There are no conflicts to declare.Acknowledgements
This project is supported by Suranaree University of Technology research grant, the 2017 TTSF Science & Technology Research Grant, Thailand Development and Promotion of Science and Technology Talents Project (DPST Research Grant 007/2559) granted to K. C., National Nanotechnology Center, and the Young Scientist and Technologist Program (YSTP) administered by National Science and Technology Development Agency granted to S. T.References
- J. O. Escobedo, O. Rusin, S. Lim and R. M. Strongin, Curr. Opin. Chem. Biol., 2010, 14, 64–70 CrossRef PubMed.
- S. Luo, E. Zhang, Y. Su, T. Cheng and C. Shi, Biomaterials, 2011, 32, 7127–7138 CrossRef PubMed.
- H. Xiang, J. Cheng, X. Ma, X. Zhou and J. J. Chruma, Chem. Soc. Rev., 2013, 42, 6128–6185 RSC.
- K. Chansaenpak, B. Vabre and F. P. Gabbaï, Chem. Soc. Rev., 2016, 45, 954–971 RSC.
- H. C. Daly, G. Sampedro, C. Bon, D. Wu, G. Ismail, R. A. Cahill and D. F. O'Shea, Eur. J. Med. Chem., 2017, 135, 392–400 CrossRef PubMed.
- Y. Ge and D. F. O'Shea, Chem. Soc. Rev., 2016, 45, 3846–3864 RSC.
- A. Meares, A. Satraitis, J. Akhigbe, N. Santhanam, S. Swaminathan, M. Ehudin and M. Ptaszek, J. Org. Chem., 2017, 82, 6054–6070 CrossRef PubMed.
- S. Zhu, J. Zhang, G. Vegesna, F. T. Luo, S. A. Green and H. Liu, Org. Lett., 2011, 13, 438–441 CrossRef PubMed.
- G. Fan, L. Yang and Z. J. Chen, Front. Chem. Sci. Eng., 2014, 8, 405–417 CrossRef.
- A. Kamkaew and K. Burgess, Chem. Commun., 2015, 51, 10664–10667 RSC.
- G. K. Vegesna, S. R. Sripathi, J. Zhang, S. Zhu, W. He, F. T. Luo, W. J. Jahng, M. Frost and H. Liu, ACS Appl. Mater. Interfaces, 2013, 5, 4107–4112 CrossRef PubMed.
- D. Collado, Y. Vida, F. Najera and E. Perez-Inestrosa, RSC Adv., 2014, 4, 2306–2309 RSC.
- P. Ramesh, J. Karabline-Kuks, M. Weiss-Shtofman and M. Portnoy, ChemistrySelect, 2017, 2, 3093–3098 CrossRef.
- J. F. Yin, Y. Hu, H. Wang, Z. Jin, Y. Zhang and G. C. Kuang, Chem.–Asian J., 2017, 12, 3088–3095 CrossRef PubMed.
- S. Cherumukkil, B. Vedhanarayanan, G. Das, V. K. Praveen and A. Ajayaghosh, Bull. Chem. Soc. Jpn., 2018, 91, 100–120 CrossRef.
- J. X. Zhang, L. Wang and Z. G. Xie, ACS Biomater. Sci. Eng., 2018, 4, 1969–1975 CrossRef.
- L. Quan, S. Liu, T. Sun, X. Guan, W. Lin, Z. Xie, Y. Huang, Y. Wang and X. Jing, ACS Appl. Mater. Interfaces, 2014, 6, 16166–16173 CrossRef PubMed.
- C. L. Hamon, C. L. Dorsey, T. Özel, E. M. Barnes, T. W. Hudnall and T. Betancourt, J. Nanopart. Res., 2016, 18, 207 CrossRef.
- Y. Xu, T. Feng, T. Yang, H. Wei, H. Yang, G. Li, M. Zhao, S. Liu, W. Huang and Q. Zhao, ACS Appl. Mater. Interfaces, 2018, 10, 16299–16307 CrossRef PubMed.
- W. Hu, H. Ma, B. Hou, H. Zhao, Y. Ji, R. Jiang, X. Hu, X. Lu, L. Zhang, Y. Tang, Q. Fan and W. Huang, ACS Appl. Mater. Interfaces, 2016, 8, 12039–12047 CrossRef PubMed.
- D. Chen, Q. Tang, J. Zou, X. Yang, W. Huang, Q. Zhang, J. Shao and X. Dong, Adv. Healthcare Mater., 2018, 7, 1701272 CrossRef PubMed.
- C. E. Mora-Huertas, H. Fessi and A. Elaissari, Int. J. Pharm., 2010, 385, 113–142 CrossRef PubMed.
- N. Kamaly, Z. Xiao, P. M. Valencia, A. F. Radovic-Moreno and O. C. Farokhzad, Chem. Soc. Rev., 2012, 41, 2971–3010 RSC.
- A. Reisch and A. S. Klymchenko, Small, 2016, 12, 1968–1992 CrossRef PubMed.
- L. Yan, Y. Zhang, B. Xu and W. Tian, Nanoscale, 2016, 8, 2471–2487 RSC.
- J. Geng, K. Li, W. Qin, L. Ma, G. G. Gurzadyan, B. Z. Tang and B. Liu, Small, 2013, 9, 2012–2019 CrossRef PubMed.
- J. Geng, K. Li, K.-Y. Pu, D. Ding and B. Liu, Small, 2012, 8, 2421–2429 CrossRef PubMed.
- G. Eliza, L. Alf, U. Nathalie, M. Philippe, L. Janina, C. Joël and L. Pierre, Nanotechnology, 2006, 17, 2546 CrossRef PubMed.
- P. Grossen, D. Witzigmann, S. Sieber and J. Huwyler, J. Controlled Release, 2017, 260, 46–60 CrossRef PubMed.
- A. R. Pohlmann, F. N. Fonseca, K. Paese, C. B. Detoni, K. Coradini, R. C. Beck and S. S. Guterres, Expert Opin. Drug Delivery, 2013, 10, 623–638 CrossRef PubMed.
- G. L. Ma and C. X. Song, J. Appl. Polym. Sci., 2007, 104, 1895–1899 CrossRef.
- A. M. Bodratti and P. Alexandridis, J. Funct. Biomater., 2018, 9, 11 CrossRef PubMed.
- T. K. Dash and V. B. Konkimalla, Mol. Pharm., 2012, 9, 2365–2379 CrossRef CAS PubMed.
- A. Gut, L. Lapok, D. Jamroz, A. Gorski, J. Solarski and M. Nowakowska, New J. Chem., 2017, 41, 12110–12122 RSC.
- K. Chansaenpak, M. Wang, S. Liu, Z. Wu, H. Yuan, P. S. Conti, Z. Li and F. P. Gabbaï, RSC Adv., 2016, 6, 23126–23133 RSC.
- K. Chansaenpak, H. Wang, M. Wang, B. Giglio, X. Ma, H. Yuan, S. Hu, Z. Wu and Z. Li, Chem.–Eur. J., 2016, 22, 12122–12129 CrossRef CAS PubMed.
- R. Yoshii, H. Yamane, A. Nagai, K. Tanaka, H. Taka, H. Kita and Y. Chujo, Macromolecules, 2014, 47, 2316–2323 CrossRef CAS.
- C. E. Mora-Huertas, F. Couenne, H. Fessi and A. Elaissari, J. Nanopart. Res., 2012, 14, 876 CrossRef.
- A. S. Klymchenko, E. Roger, N. Anton, H. Anton, I. Shulov, J. Vermot, Y. Mely and T. F. Vandamme, RSC Adv., 2012, 2, 11876–11886 RSC.
- X. Li, C. Schumann, H. A. Albarqi, C. J. Lee, A. W. G. Alani, S. Bracha, M. Milovancev, O. Taratula and O. Taratula, Theranostics, 2018, 8, 767–784 CrossRef CAS PubMed.
- L. Shapiro and S. Cohen, Biomaterials, 1997, 18, 583–590 CrossRef CAS PubMed.
Footnote |
| † Electronic supplementary information (ESI) available: confocal laser scanning microscopy imaging of AZB-NO2@PCL in U251 cells at 3 and 6 h incubation and Z-stack images; characteristics of AZB-NO2@PCL prepared from different amounts of Kolliphor P 188 and sonication time; stability test of NPs under physiological condition. See DOI: 10.1039/c8ra08145j |
| This journal is © The Royal Society of Chemistry 2018 |

