
 Open Access Article
 This Open Access Article is licensed under a Creative Commons Attribution-Non Commercial 3.0 Unported Licence
Visible-light-induced photo-Fenton process for the facile degradation of metronidazole by Fe/Si codoped TiO2†
Wei Dua,
Qin Xu *a,
Dangqin Jinc,
Xiaoyu Wanga,
Yun Shua,
Liming Kong*a and
Xiaoya Huab
*a,
Dangqin Jinc,
Xiaoyu Wanga,
Yun Shua,
Liming Kong*a and
Xiaoya Huab
aSchool of Chemistry and Chemical Engineering, Yangzhou University, Yangzhou 225002, China. E-mail: xuqin@yzu.edu.cn; lmkong@yzu.edu.cn; Fax: +86 514 87975244; Tel: +86 514 87971818
bGuangling College, Yangzhou University, Yangzhou 225002, China
cDepartment of Chemical Engineering, Yangzhou Polytechnic Institute, Yangzhou 225127, China
First published on 30th November 2018
Abstract
This work investigated the feasibility and efficiency of a heterogeneous photo-Fenton catalyst, Fe/Si codoped TiO2, for the degradation of metronidazole (MNZ) under visible light irradiation. The Fe/Si codoped TiO2 was prepared via a facile and simple sol–gel solvothermal process followed by annealing at 480 °C for 4 hours. High resolution transmission electron microscopy (HRTEM) and X-ray photoelectron spectroscopy (XPS) measurements revealed that the photo-Fenton process did not change the structure, textural and surface morphologies of this catalyst. Elemental mapping results indicated the good dispersion of Fe and Si ions in TiO2. Nitrogen adsorption and desorption measurements indicated that Si doping increased the surface area of the catalysts. The Fe and Si doping narrowed the band gap of TiO2. They also facilitated the transfer of photo-generated electrons from TiO2 to Fe(III). Under visible light irradiation and the optimum operating conditions, MNZ could be completely degraded in 50 min by this catalyst within a wide pH range. Hydroxyl radicals and holes were verified to be responsible for degrading MNZ. The leaching of iron ions was less than 0.047 ppm even after illuminating the catalyst for 6 hours, indicating the good stability of the Fe/Si codoped TiO2. The as-prepared catalysts with excellent catalytic activity, and remarkable reusability and stability could provide a new insight into the preparation of photocatalysts and have wide applications for antibiotics removal.
1. Introduction
Pollution of water by antibiotics is becoming a serious social problem because of the illegal discharge of antibiotics from factories into lakes, rivers, and seas without any pretreatment. The large-scale production and use of antibiotics poses a daily threat to human health.1,2 There is an urgent need to reduce the pollution of aquatic environments by antibiotics to an acceptable level by a green, fast and sustainable technique. Over the past decades, several traditional methods have been used to treat wastewater, such as coagulation–flotation, ultrasound degradation, membrane bioreactors and enriched-adsorption.3–5 However, most of these processes are confronted with the difficulty of low degradation rate, high energy consumption and potential secondary pollution.6,7Advanced oxidation processes (AOPs) refer to a range of techniques which can generate oxidants with the assistance of catalysts, strong oxidants, light or thermal input. They are powerful methods for degrading antibiotics because of their strong oxidation abilities. The Fenton process has been regarded as one of the most efficient routes for degrading a wide variety of organic compounds at ambient temperature.8 This process involves the reaction between H2O2 and ferrous salts in acidic aqueous solution leading to the production of hydroxyl radicals (·OH).9 The reagents used in the Fenton process are cheap, relatively safe to handle and easy to store.10 However, there are some disadvantages of the homogeneous Fenton reaction such as the limited pH range (acidic pH) and the difficulty of regeneration of the catalyst. A high concentration of anions and large amounts of ferrous iron sludge are formed during the Fenton process. Furthermore, ferrous ions must be added into the reaction medium continuously to sustain the reaction.11
To conquer the limitation of the Fenton process and improve the pollutant degradation efficiency, light irradiation was introduced into the Fenton system to form the so-called photo-Fenton process. During the photo-Fenton process, only small amounts of H2O2 and iron salt are required.12 However, more ·OH is produced than by the standard Fenton process or non-Fenton photo-driven processes,13 which accelerates the degradation rates of a variety of pollutants. The limitation of the ordinary photo-Fenton reaction systems is that their optimal performance is still achieved at pH 3.0 because this pH is beneficial for the formation of more soluble and photoactive hydroxyl-Fe3+.14 In most cases, UV instead of sunlight is used, which also increases the cost. Therefore, some developments must be made to overcome these shortcomings.
Heterogeneous photocatalysts would be good candidates to harvest light and trigger the Fenton reaction within wider pH ranges.15 Numerous heterogeneous photocatalysts including copper nanoparticles,16 Fe2O3, CdS17–19 and graphene oxide20 have been developed and used but TiO2-based materials are the most well-known among these prospective photocatalytic materials because they are cheap, stable, efficient and noncorrosive. However, TiO2 without doping can only be irradiated by UV light because of its wide its energy gap (∼3.2 eV). This causes the inefficient exploitation of solar light and has impeded its commercialization and wide use, because UV light is only a small part (5%) of the Sun's energy. Furthermore, the electrons and holes (e−/h+) separated during the light irradiation process tend to recombine easily in TiO2.21 Therefore, it is highly desirable to improve the visible light utilization capacity and photocatalytic efficiency of TiO2.
Doping is a very effective means to break through the UV limitation and improve the photocatalytic efficiency of TiO2.22 When suitable transition metals or nonmetal elements are doped in TiO2, the band gap energy of TiO2 is decreased and the absorption of photons is red shifted. Meanwhile, the recombination of electrons and holes is inhibited because of the effective separation of the charge carriers caused by the incorporation of the dopant into the TiO2 crystal lattice.23–25 Iron-doping would be a good choice for the preparation of photo-Fenton catalysts.26 Firstly, iron plays an important role in the Fenton reaction and is environmentally benign. Secondly, the radius of Fe3+ (∼0.654 Å) is similar to Ti4+ (∼0.604 Å).27 Therefore, Fe ions can be incorporated into the crystal lattice of TiO2 easily. Furthermore, the separation of photo-generated e−/h+ pairs is favored and the e−/h+ pair recombination rate is reduced because Fe3+ ions can act as e−/h+ pair traps due to the close energy levels of Fe2+/Fe3+ and Ti3+/Ti4+.28 However, Fe doping has been criticized for causing thermal instability. In addition, expensive procedures (e.g. ion implantation) are needed for doping Fe into TiO2.29 Multi-element co-doping would be an effective alternative to improve the stability of the catalysts and reduce the preparation cost. Both experimental results30,31 and theoretical calculations32 have indicated that the photocatalytic properties and stability of TiO2 were improved when it was codoped with transition metal and nonmetal elements. Silicon, which is widely used in semiconductor manufacture, was reported to cause some aberrance in the crystalline structure of anatase TiO2 to decrease electron/hole recombination.33 Furthermore, silicon doping was reported to increase the surface area and thermal stability of TiO2.25,34,35 Si-doped TiO2 has been reported to be a good photocatalyst for decomposing acetaldehyde under visible-light irradiation.35 Several recent studies have reported that multi-element codoping into TiO2 could extend the optical absorption edge and improve the visible-light photocatalytic efficiency of TiO2.29–31,35 Table S1† lists the previous applications of modified/doped TiO2 for pollutant degradation by a photo-Fenton process. However, to the best of our knowledge, few works have studied the preparation and application of Fe/Si codoped TiO2 for the degradation of antibiotics and its properties before and after photocatalytic testing.
In the present work, we report the preparation of an Fe/Si codoped TiO2 by a simple solvothermal method. UV-vis spectroscopy, X-ray diffraction (XRD), the Brunauer, Emmett and Teller (BET) method, high-resolution transmission electron microscopy (HRTEM), elemental mapping and X-ray photoelectron spectroscopy (XPS) techniques were used to study the properties of the Fe/Si codoped TiO2. The performance of the Fe/Si codoped TiO2 composites was investigated by degrading metronidazole (MNZ), an antibiotic, under different experimental variables such as H2O2 concentration, pH value and the loaded amount of the photocatalysts. Trapping experiments of the reactive species were conducted to explore the active species responsible for the degradation of MNZ.
2. Experimental
2.1. Chemicals and apparatus
Analytical grade chemicals were used in this work without further purification. Titanium butoxide (TBOT, Ti(OBu)4, 98.0%), tetraethyl orthosilicate (TEOS, containing ≥28.4 wt% SiO2), FeCl3·6H2O (99.0%), ethanol (99.7%), hydrogen peroxide (H2O2, 30.0%), and metronidazole (MNZ, 99.0%) were all purchased from Aladdin. All the aqueous solutions were prepared by using deionized water (R = 18.6 MΩ) as the solvent.The optical absorption spectra of TiO2, Fe doped TiO2, and Fe/Si codoped TiO2 were obtained by using a Cary 5000 UV/VIS/NIR spectrophotometer (Varian, USA). The crystal structures of the photocatalysts in the 2θ range of 10–80° were obtained by using a D8 Advance Polycrystalline X-ray diffractometer (XRD, AXS, BRUKER) with a scan rate of 0.1° min−1. The Brunauer–Emmett–Teller (BET) surface areas of the photocatalysts were measured on an N2 ad/desorptometer by an Autosorb IQ3 (Quantachrome Instruments, USA). Field emission transmission electron microscopy (FETEM) images and diffraction patterns of Fe/Si codoped TiO2 were obtained on a Tecnai G2 F30 S-TWIN (FEI, USA) electron microscope by applying 200 keV accelerating voltage. The binding energy and the valence state of iron and silicon of the samples were analyzed by using an ESCALAB 250Xi X-ray Photoelectron Spectroscopy (XPS) instrument (Thermo Scientific, USA) with Al Kα X-ray radiation. Mass spectrometry was performed on a maXis Ultrahigh Resolution Time-of-flight Mass Spectrometer (Bruker Dalton, Germany).
2.2. Synthesis of Fe/Si codoped TiO2, Fe doped TiO2, and TiO2
Fe/Si codoped TiO2 nanoparticles, Fe doped TiO2 and TiO2 were prepared via the procedures described in Scheme 1. A typical sol–gel solvothermal procedure for the preparation of Fe/Si codoped TiO2 was as follows (Part A, Scheme 1). Firstly, 4.7 g of FeCl3·6H2O was dissolved in 18 mL of ethanol to form the solution A. Secondly, 20.43 mL of TBOT, 6.69 mL of TEOS and 5 mL of ethanol were mixed together and sonicated for 10 min to form a clear and homogeneous solution B. Solution A was added dropwise into solution B under vigorous stirring until the molar ratio of Fe/Ti increased to 0.28, and Fe/Si increased to 6.0. Then 18.5 mL of water was added slowly into the mixture to allow sufficient hydrolysis and reaction. The suspension was transferred into an autoclave and heated at 80 °C for 12 h by a solvothermal process. The resulting products were rinsed using ethanol and deionized water, successively, until no Cl− was found in the rinsing water. The products were finally calcinated at a heating rate of 1 °C min−1 and kept at 480 °C for 4 h. This process was used to improve the crystallinity of the photocatalysts and remove some impurities.36,37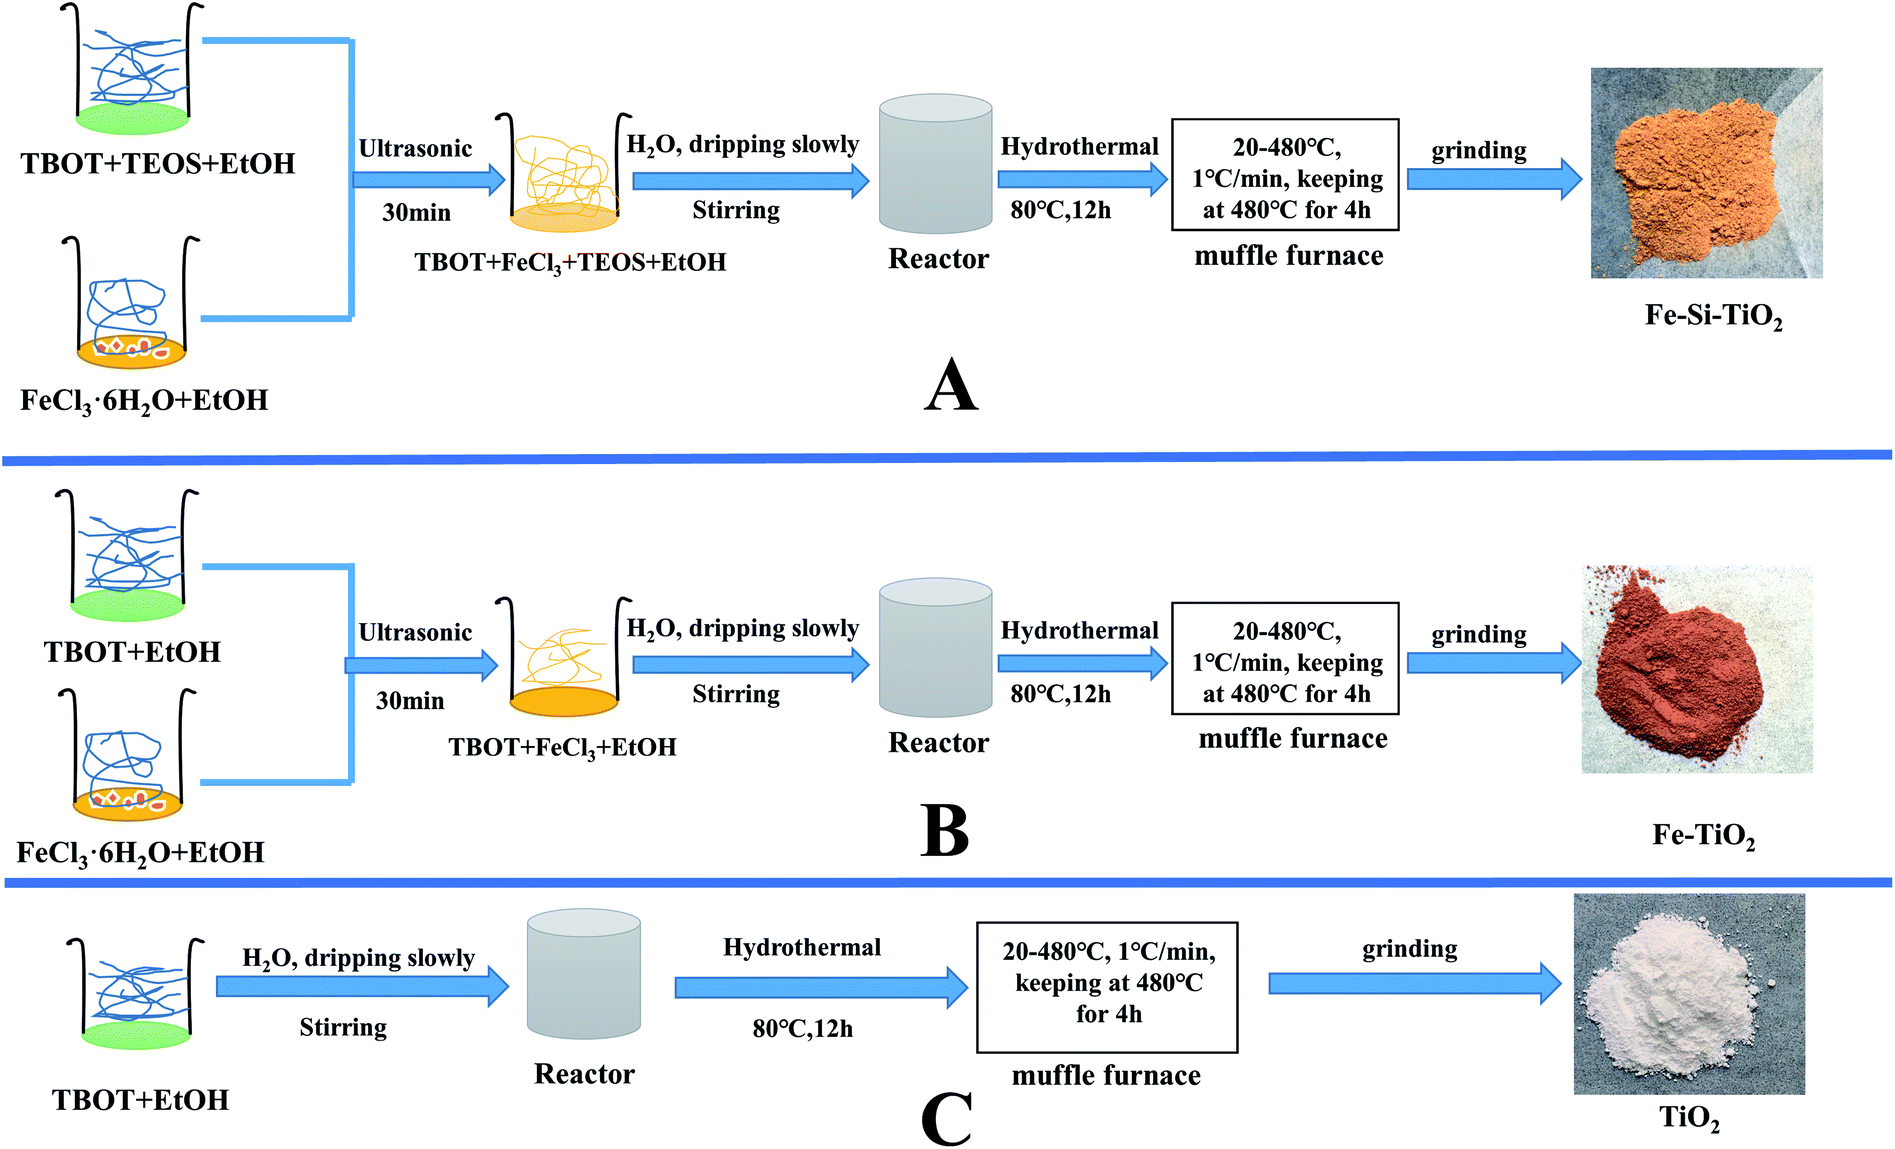 | ||
| Scheme 1 Schematic route for synthesizing Fe/Si codoped TiO2, Fe doped TiO2 and TiO2 ((A) Fe/Si codoped TiO2, (B) Fe doped TiO2 and (C) TiO2). | ||
For the preparation of Fe doped TiO2, solution A and B were prepared and used as above except that no TEOS was present in solution B (Part B, Scheme 1). For TiO2, only TBOT was used. TEOS or FeCl3 solutions were replaced by ethanol with the same volume (Part C, Scheme 1). The two samples were designated as Fe doped TiO2 and TiO2.
2.3. Photodegradation measurement
An aqueous solution containing MNZ was used to evaluate the photocatalytic activity of the Fe/Si codoped TiO2, Fe doped TiO2, Si doped TiO2, TiO2 and H2O2 itself. The photocatalytic reactor consisted of a glass beaker and a magnetic stirrer. The reaction temperature was kept at 25 °C by using a condensated water circulating device. A xenon lamp (220 W) with a 400 nm long-pass filter was used to provide visible light. For a typical procedure, 0.3 g catalysts and 0.3 mL H2O2 (10 M) were dispersed in 300 mL of 6 ppm MNZ aqueous solution in a 400 mL glass beaker and magnetically stirred. At a given interval (10 min) during the photodegradation process, 10 mL of the suspension was taken out and centrifuged for 10 min at 5000 rpm to remove the remaining particles. The UV-vis spectra of the supernatants were recorded and the maximum absorbance at λ = 320 nm was used for the quantification of MNZ in the solution.After the photodegradation process, the mixture was centrifuged to separate the catalysts. The separated catalysts were reused for the next photocatalytic reaction to evaluate the reusability of the photocatalysts.
The photocatalytic degradation products of MNZ were identified using high performance liquid chromatography-mass spectrometry (HPLC-MS) fitted with a maXis ultrahigh resolution time-of-flight mass spectrometer. A Waters ACQUITY BEH C18 column (particle size 1.7 μm, 2.1 × 50 mm) was used for the separation of the products at 30 °C with the mobile phase A (1% formic acid) and mobile phase B (methanol). Firstly, 97% of mobile phase A was passed through the column at a flow rate of 0.3 mL min−1 in 1.2 min. Then, the mobile phase A was decreased gradually to 30% within 2.4 min and was kept for 0.6 min. The mass spectrometry fragments were identified by electrospray ionization in positive ion mode (ESI+). The operational conditions were as follows: capillary voltage: 3.0 kV; desolvation temperature: 350 °C. The intermediates were analyzed in triplicate.
3. Results and discussions
3.1. Characterization of TiO2, Fe doped TiO2, and Fe/Si codoped TiO2 catalysts
Fig. 1 shows the UV-vis diffuse reflectance spectra of TiO2, Si doped TiO2, Fe doped TiO2 and Fe/Si codoped TiO2. The absorbance decreased sharply in the visible range for TiO2. A slight positive shift of the absorption edge was observed for the Si doped TiO2. However, a great improvement of the absorbance at wavelengths of 400–800 nm was observed for both Fe doped and Fe/Si codoped TiO2. Furthermore, red shifts of the absorption edge were also observed. The stronger UV-vis absorbance of Fe doped and Fe/Si codoped TiO2 indicated their high photocatalytic activity. Fig. 1B plots the relationship between (Ahν)1/2 vs. hν. The band gap energy (Eg) values of TiO2, Si doped TiO2, Fe doped TiO2 and Fe/Si codoped TiO2 were estimated to be 3.01 eV, 2.92 eV, 1.64 eV, and 1.31 eV, respectively, by using the Kubelka–Munk reflection plots (Fig. 1B). This indicated that Fe and Si doping narrowed the band gap of TiO2. The smaller band gap energy means a broader spectral response range. This would contribute to the enhanced photocatalytic activity of the doped TiO2. The following factors may have contributed to the differences in band gap. Ti 3d and O 2p made up the conduction band (CB) and valence band (VB) of TiO2, respectively. For the doped TiO2, Fe acted as a cationic dopant to replace Ti, and Si acted as an anionic dopant to replace lattice oxygen. These replacements would raise the potentials of the CB and VB and narrow the band gap of TiO2.38 The absorption enhancements of Fe/Si codoped TiO2 in the wavelength region of 500–800 nm indicated that the doping of Fe and Si into TiO2 promoted the utilization of solar light, which would improve the degradation efficiency of MNZ under visible light irradiation. These results are in accordance with the photocatalytic activity of the different catalysts, which will be shown later.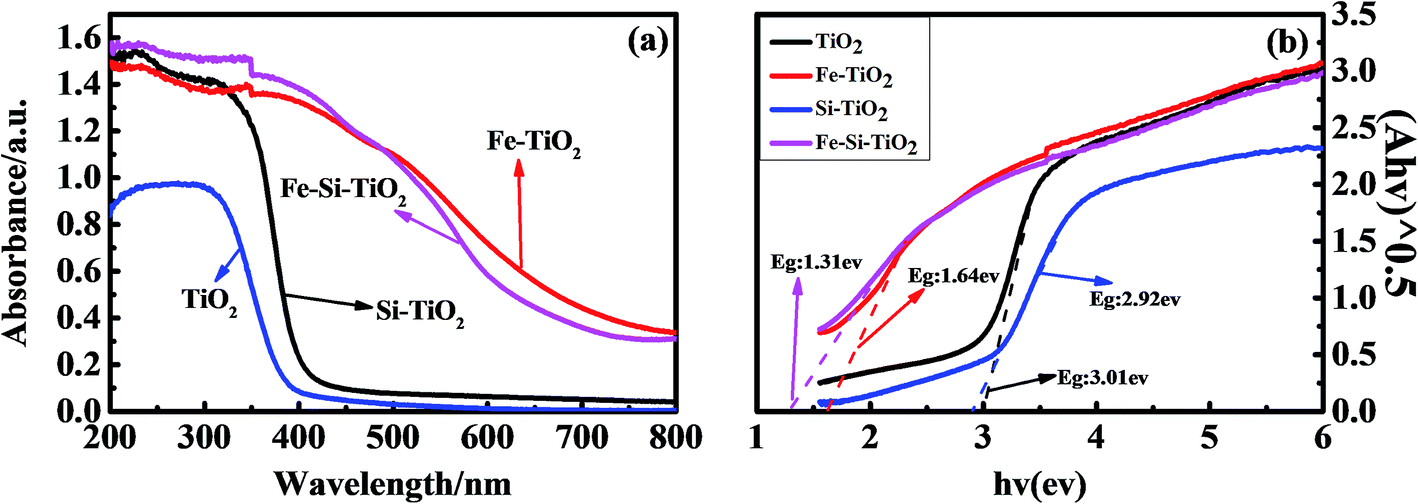 | ||
| Fig. 1 (a) UV-vis spectra of pure anatase TiO2, Si doped TiO2, Fe doped TiO2 and Fe/Si codoped TiO2 samples; (b) plot of (Ahν)1/2 versus energy hν for the band gap energy of pure anatase TiO2, Si doped TiO2, Fe doped TiO2 and Fe/Si codoped TiO2 samples. | ||
At the point of zero charge, the VB and CB position of the Fe/Si codoped TiO2 can be calculated by the following empirical formula:39
| EVB = X − Ee + 0.5Eg | (1) |
| ECB = EVB − Eg | (2) |
Fig. 2 shows the XRD patterns of the solvothermally synthesized TiO2, Fe doped TiO2 and Fe/Si codoped TiO2 nanoparticles. The diffraction peaks at 26.32°, 37.91°, 48.20°, 54.82° and 62.56° were observed for all the samples. These peaks corresponded to the 2θ values of the anatase TiO2 species,40 indicating the formation of the anatase phase during the preparation process. No iron and silicon containing compounds, rutile or brookite forms of TiO2 were detected for the three samples, indicating that the doping of TiO2 with Fe and Si did not change the crystal structure of TiO2. Fe3+ has a similar ionic radius to Ti4+, so it can occupy some of the titanium lattice sites or be inserted on the surface structures of TiO2 to form an iron–titanium solid solution without changing the phase of TiO2. The mean grain size of the Fe/Si doped TiO2 was estimated to be 12 nm as calculated by Scherrer's method. For comparison, the XRD pattern of Fe/Si codoped TiO2 without a calcination process is also displayed in Fig. 2. It indicates that the calcination process improved the crystallinity of the photocatalysts.
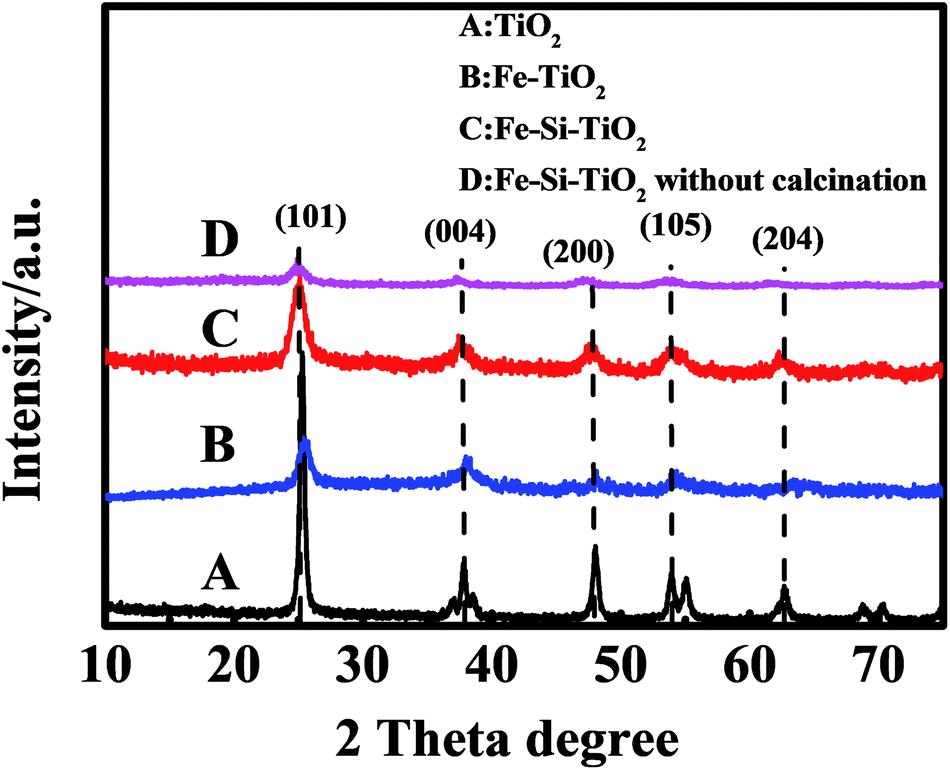 | ||
| Fig. 2 XRD patterns of pure TiO2 (A), Fe doped TiO2 (B), Fe/Si codoped TiO2 (C), and Fe/Si codoped TiO2 before calcination process (D). | ||
Fig. 3 shows the N2 adsorption/desorption isotherms of TiO2, Si doped TiO2, Fe doped TiO2 and Fe/Si codoped TiO2. The BET surface areas of TiO2, Fe doped TiO2, Si doped TiO2, and Fe/Si codoped TiO2 were 54.134, 72.900, 330.998, and 296.069 m2 g−1, respectively. This indicated that silicon doping could increase the surface area of TiO2. When Fe was doped, the surface area of the sample decreased slightly. This may be due to the presence of some Fe2O3 on the surface of TiO2. However, the surface area of the Fe/Si codoped TiO2 was still much larger than TiO2 or Fe doped TiO2. A high surface area can achieve facile adsorption/desorption equilibrium and mass diffusion of reactants and products and thus enhance the activity and stability of the Fe/Si codoped TiO2 in photocatalytic applications.
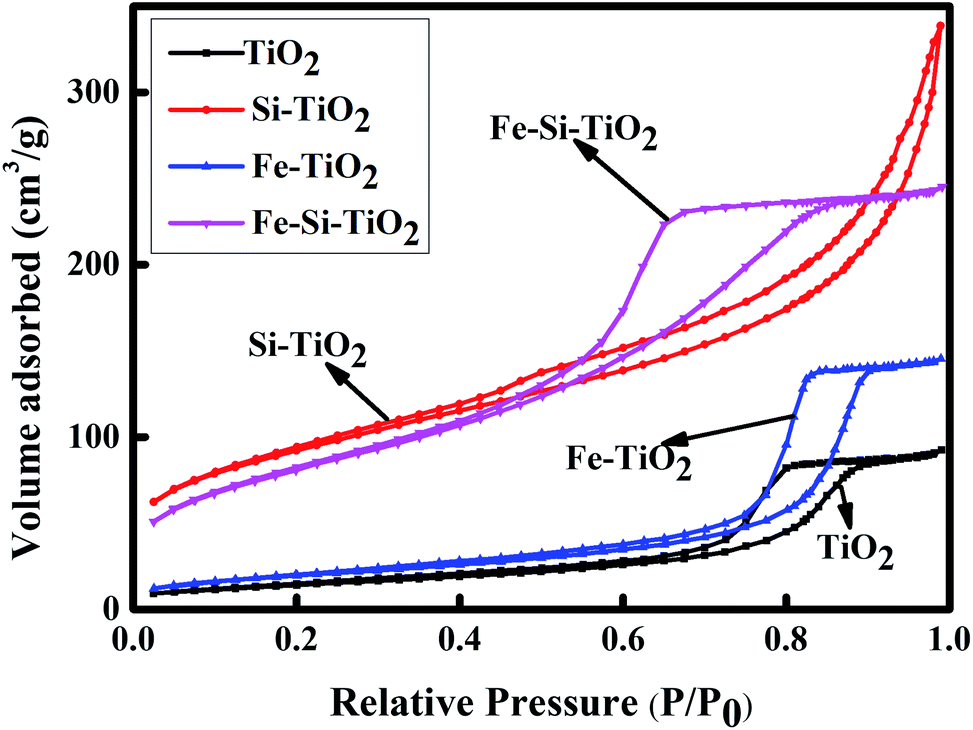 | ||
| Fig. 3 N2 adsorption–desorption isotherm of TiO2, Fe doped TiO2, Si doped TiO2 and Fe/Si codoped TiO2. | ||
FETEM and selected area electron diffraction (SAED) were used to examine the morphology and characterize the formation of the junction between TiO2, Fe and Si in Fe/Si codoped TiO2. Fig. 4a illustrates typical FETEM images of the Fe/Si codoped TiO2. Most of the particles were spherical and the grain size was approximately 12 nm, which was consistent with that obtained from XRD measurements. The interplanar spacing obtained from the particle lattice fringes of Fe/Si codoped TiO2 are 0.233 nm, 0.279 nm and 0.368 nm (Fig. 4b), which match well with the planes of the face-centered cubic (FCC) anatase TiO2 (112), SiO2 (062) and Fe2O3 hematite (012), respectively. The polycrystalline nature of the Fe/Si codoped TiO2 was also verified by the SAED pattern, which is displayed in the inset of Fig. 4b. The Fe/Si codoping presumably suppressed the recombination of electrons and holes, and the SAED pattern indicated that TiO2 was still in its anatase crystal phase. The corresponding element mapping analysis of Fe/Si codoped TiO2 is displayed in Fig. 4c. It indicated that iron, silicon, titanium and oxygen are evenly distributed in the sample.
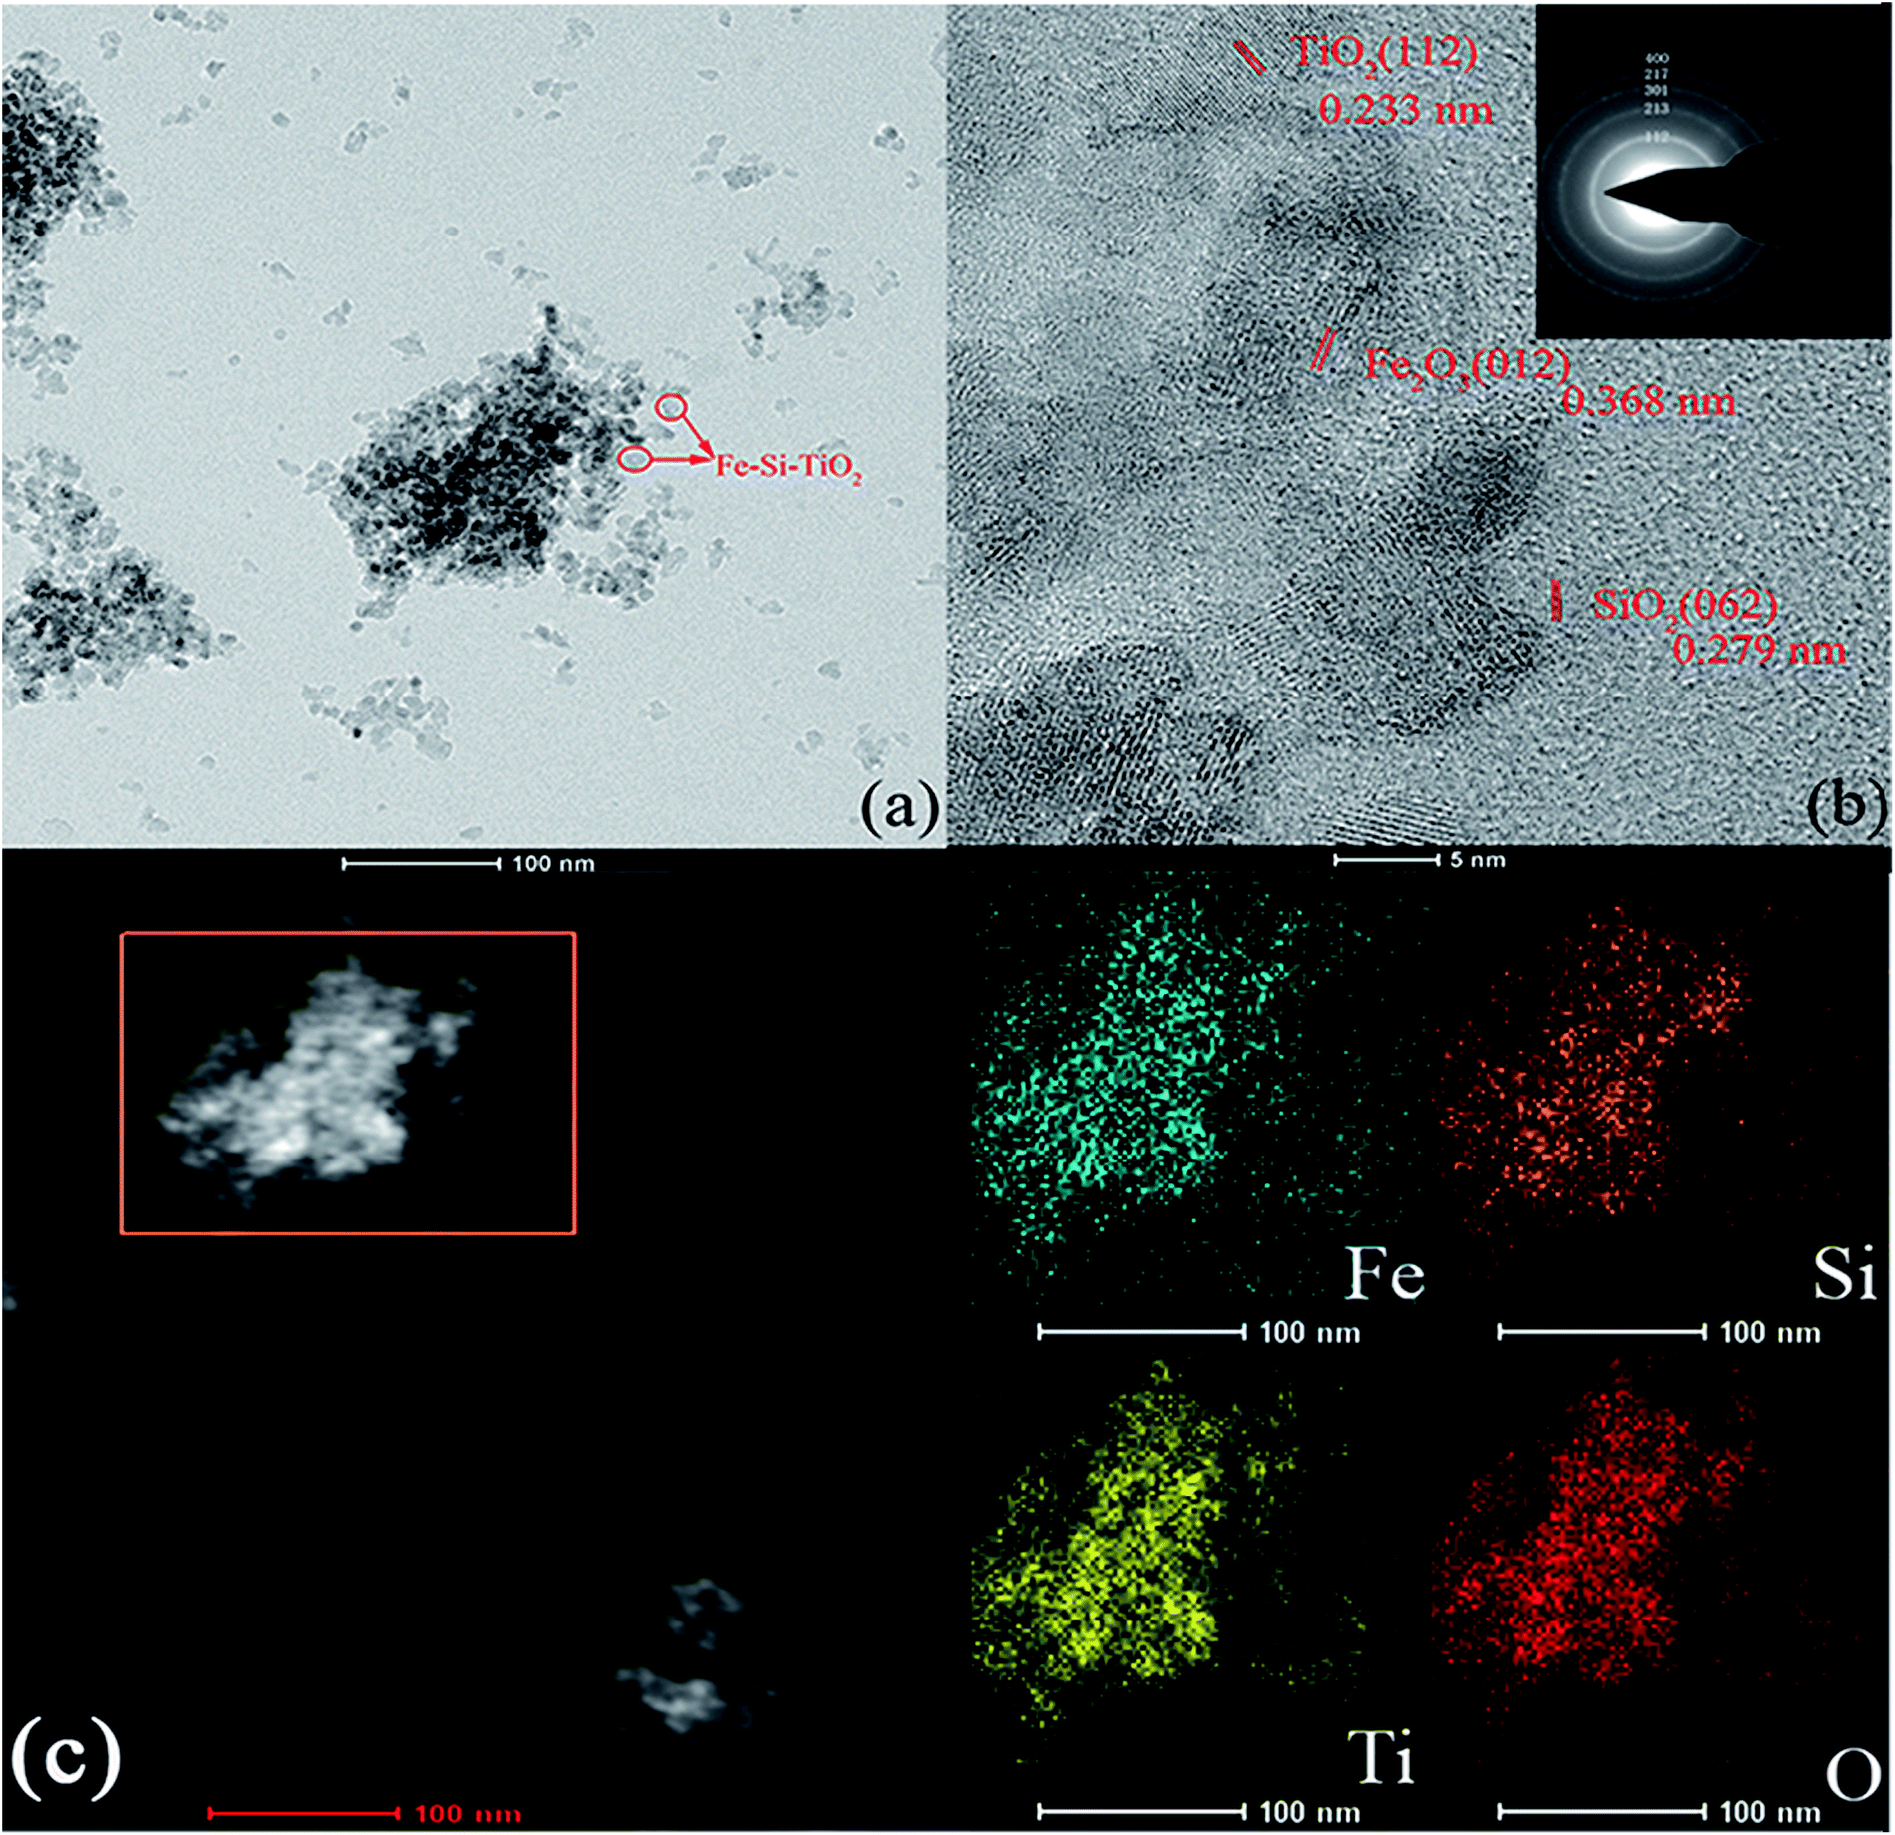 | ||
| Fig. 4 FETEM images of Fe/Si codoped TiO2 with low magnification (a) and high magnification (b). Inset of (b) is the selected area electron diffraction of the Fe/Si codoped TiO2. (c) Element mapping images of Fe/Si codoped TiO2. | ||
XPS was used to understand the surface composition and bonding environment of the prepared Fe/Si codoped TiO2. Fig. 5a shows the XPS survey spectra of Fe/Si codoped TiO2. It contains titanium, iron, silicon and oxygen components. The chemical states of the Ti and Fe species in Fe/Si codoped TiO2 and reference TiO2 and Fe2O3 were also examined by XPS. For TiO2, the Ti 2p3/2 and Ti 2p1/2 peaks were located at 458.94 eV and 464.64 eV, respectively. This indicated the presence of Ti4+ in the TiO2 lattices41 (Fig. 5b). An approximately 0.36 eV positive shift was observed for the binding energy of Ti 2p3/2 in the Fe/Si codoped TiO2 sample compared to pure TiO2.42 This indicated the doping of Si and the formation of the Si–O–Ti bond. Because the electronegativity of Si is bigger than that of Ti, the dopant Si presumably attracted electrons and thus decreased the electron density around Ti atoms. Hence, the binding energy of Ti shifts positively. Fig. 5c shows the high resolution XPS spectra of the Fe species. The two peaks at 711.22 eV and 724.78 eV correspond to Fe 2p3/2 and Fe 2p1/2 of Fe3+ oxide. A shake up satellite was observed at 719.6 eV. These characteristics were quite similar to the reference Fe2O3. In order to well characterize the doped iron species, the Ti 2p, Fe 2p, Si 2p and O 1s spectra for Fe/Si codoped TiO2 were fitted into multiple peaks, which have been labeled on the spectra. For the Fe 2p spectra, all of them were assigned to Fe(III) species. This further supported that Fe existed in the Fe3+ ionic state.43 Compared to the binding energies of Fe 2p3/2 and Fe 2p1/2 in pure Fe2O3 (710.9 eV for 2p3/2 and 724.6 eV for 2p1/2), slight positive shifts were observed in the Fe/Si codoped TiO2. This implies a change in the chemical bonding of Fe in the Fe/Si codoped TiO2. Electrons were presumably transferred from Fe3+ in the TiO2 lattice to Ti4+ species, making Fe3+ more positive and thus increasing the binding energy.44 These positively charged Fe3+ could trap some of the electrons to reduce the recombination rate between electron and hole pairs and thus increased the photodegradation efficiency. Fig. 5d shows the Si 2p XPS spectrum. The binding energy of Si 2p for Fe/Si codoped TiO2 appeared at 103.31 eV, which is lower than that of pure SiO2 (103.4 eV).38 In other words, in contrast to the Ti and Fe binding energies, the binding energy of Si 2p decreased in the co-doped TiO2. This implies that the effective positive charge around Si atoms decreased. Because the electronegativity of Si is higher than that of Ti, Si was negatively charged in the Fe/Si codoped TiO2. This caused the decrease of the Si binding energy. This result also indicated the interactions between silicon species and the TiO2 lattice, and the successful formation of Si–O–Ti bonds. Fig. 5e shows the XPS spectra of O 1s of Fe/Si codoped TiO2. The peak at 530.2 eV is the crystal lattice of TiO2 and Fe2O3.45 The peak located at 532.96 eV could be assigned to Si–O. These results were in accordance with the previous reported XPS results of Si-doped species.42
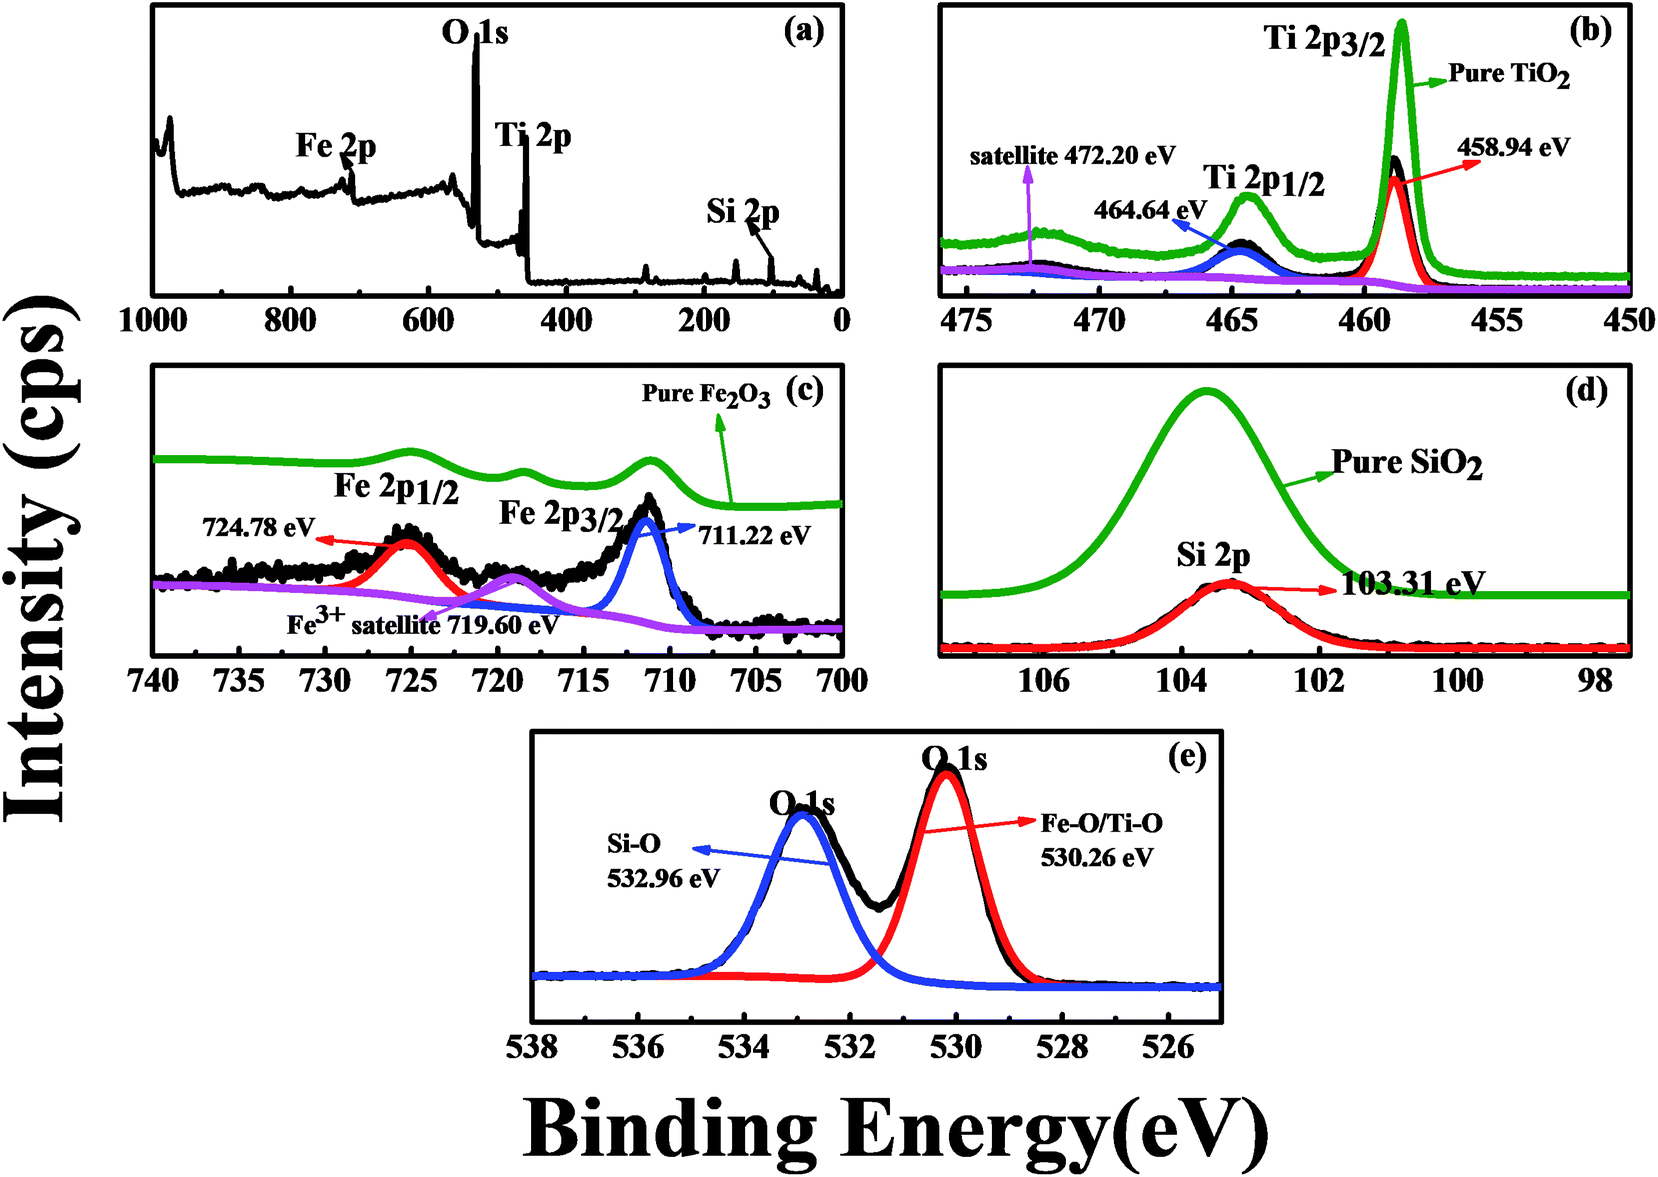 | ||
| Fig. 5 XPS spectra of Fe/Si codoped TiO2. (a) Survey; (b) Ti 2p peaks; (c) Fe 2p peaks; (d) Si 2p peak; (e) O 1s peaks. | ||
3.2. Photodegradation study of MNZ by different materials and processes
The photo-Fenton process has been reported to have an improved effect on pollutant degradation in comparison to the conventional Fenton and non-Fenton photo-driven processes.10,16,20 A series of experiments for the degradation of MNZ were performed and compared. Fig. 6A compares the degradation efficiency of TiO2, Fe doped TiO2 and Fe/Si codoped TiO2 against MNZ under different conditions. The results allowed us to conclude that photo-driven or Fenton treatment alone yielded low-level degradation efficiency while the photo-Fenton process is much more effective. Only ca. 1% MNZ was degraded after 50 min by TiO2, Fe doped TiO2 and Fe/Si codoped TiO2 in the presence of H2O2 but without light illumination, indicating that only a small quantity of ·OH was produced by the Fenton process in the absence of light at pH 7.0. This quantity of ·OH radicals generated had only a low ability to oxidize MNZ. The degradation efficiency was improved in the presence of light. This may be due to the formation of ·OH by photo-illumination. However, for TiO2, the degradation efficiency was almost the same even in the photo-Fenton process. This implies that no Fenton reaction occurred when using TiO2 as the catalyst. Furthermore, the TiO2-catalyzed system has the lowest degradation efficiency in comparison with the other two catalysts, Fe doped TiO2 and Fe/Si codoped TiO2. This supported the high energy efficiency of Fe doped TiO2 and Fe/Si codoped TiO2 in utilizing visible light. For Fe doped TiO2 and Fe/Si codoped TiO2 in the photo-driven and photo-Fenton processes, both of them had their highest degradation efficiency when the photo-Fenton process was applied but the lowest degradation efficiency when the Fenton process was utilized. Furthermore, the degradation efficiency achieved by the photo-Fenton process was higher than the sum of the efficiencies achieved with the photo-driven and Fenton processes. This demonstrated a synergetic effect of the photo-Fenton process for the degradation of MNZ. Fig. 6B and C show the kinetic plots of different photo-Fenton systems, including Fe doped TiO2 (curve a), Fe/Si codoped TiO2 (curve b), TiO2 (curve d), Si doped TiO2 (curve e), Fe3+ (curve f) with H2O2 and H2O2 itself (curve c) under light illumination. Their degradation efficiencies are also listed in Table S2.† All the results indicated that the Fe/Si codoped TiO2 shows the highest efficiency for MNZ degradation by the photo-Fenton process. Si and Fe codoping narrowed the band gap of TiO2, enhanced the optical absorption of visible and UV-light and improved the utilization efficiency of light. When Ti4+ was substituted by Fe3+, oxygen vacancies presumably appeared in the Fe/Si codoped TiO2. These oxygen vacancies can trap electron carriers and effectively reduce the h+/e− pair recombination. Consequently, these photo-induced holes and electrons presumably transferred through the photocatalyst surface to form active species for the degradation of MNZ. The superior performance of the photo-Fenton process may be due to the higher concentration of ·OH, owing to the generation of ·OH simultaneously by photo-driven and Fenton processes. We also tested the photocatalytic activity of Fe/Si codoped TiO2 without calcination in decomposing MNZ under visible light irradiation. The degradation efficiency was only 30%. This verified that the calcination treatment improved the crystallinity and photoactivity of the catalyst.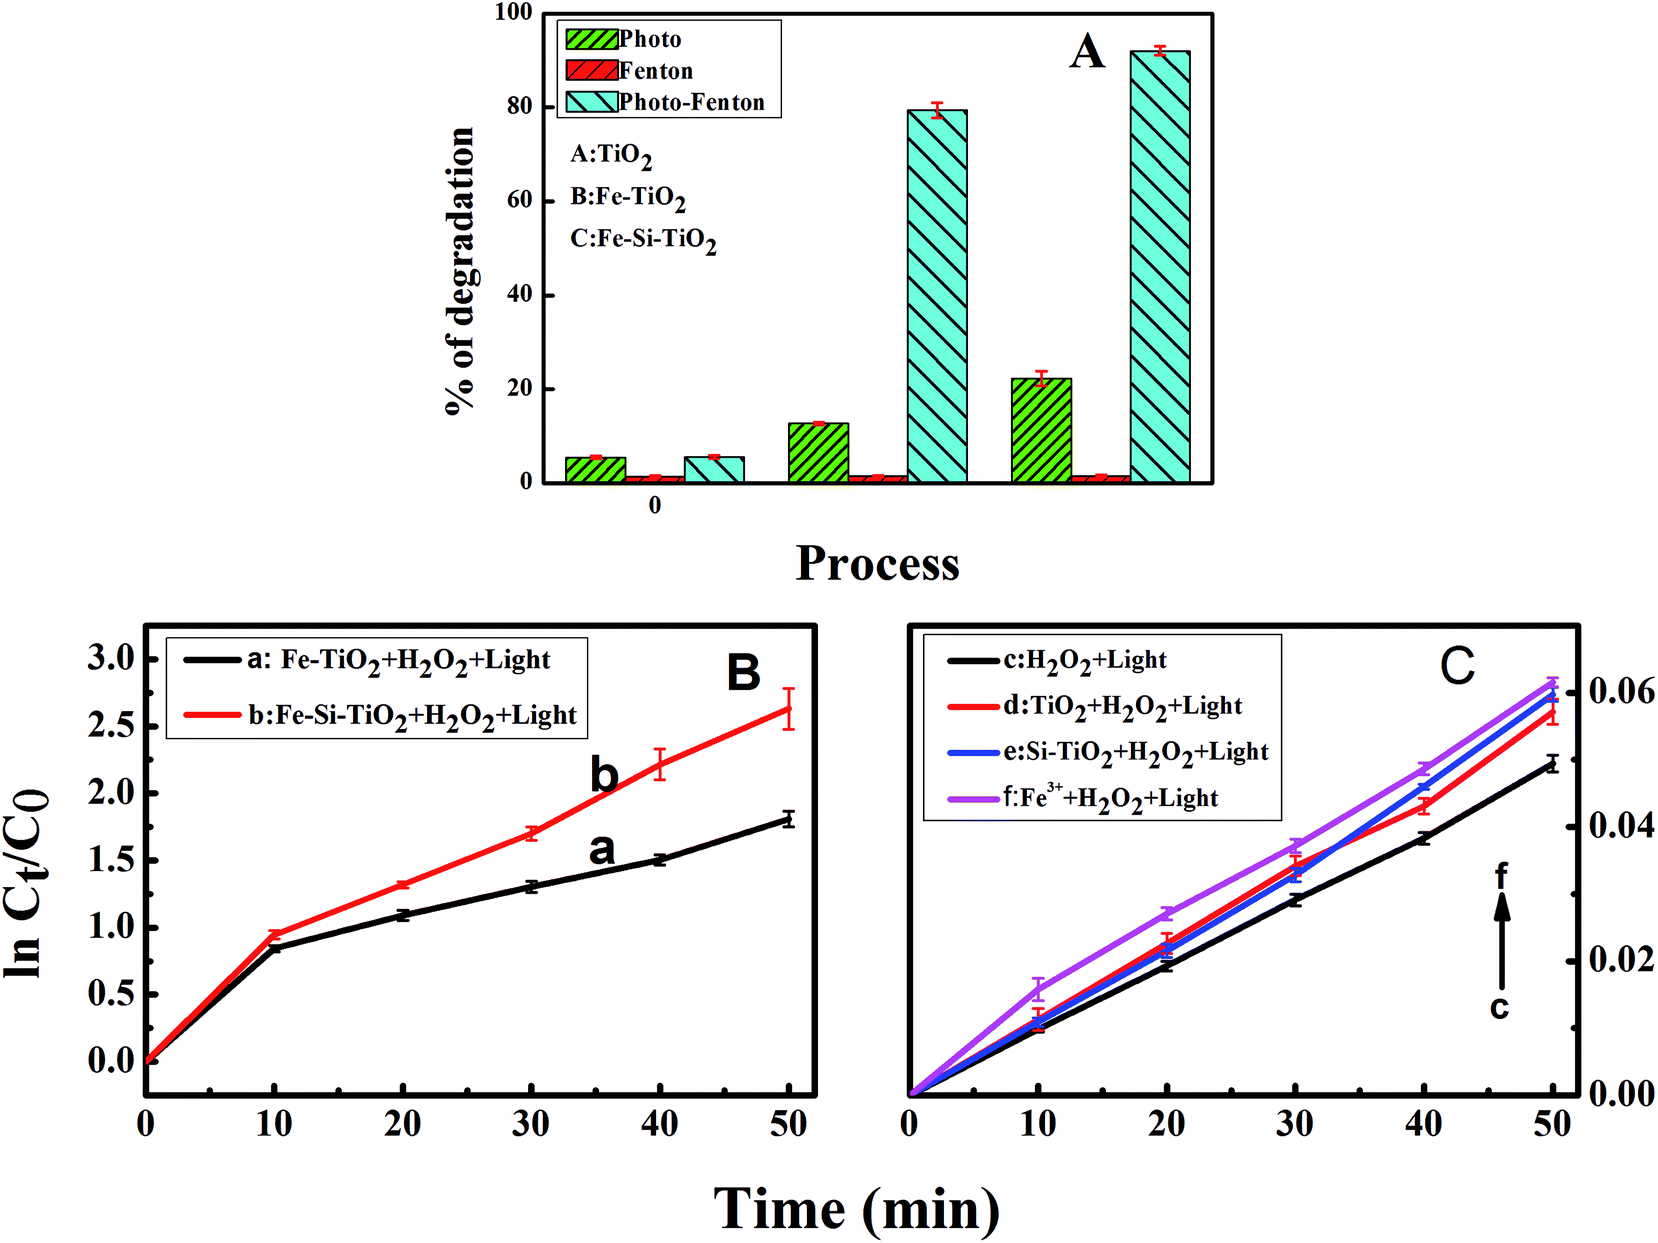 | ||
| Fig. 6 (A) The degradation efficiency against MNZ solution treated with TiO2, Fe doped TiO2, and Fe/Si codoped TiO2; (B) and (C) the kinetic degradation plots of Fe doped TiO2 with H2O2; Fe/Si codoped TiO2 with H2O2; H2O2 only; TiO2 with H2O2; Si doped TiO2 with H2O2; and Fe3+ with H2O2, under visible light irradiation. Experiment concentrations: MNZ: 6 ppm; pH: 7.0; irradiation time: 50 min; catalyst dosage: 0.3 g/300 mL; concentration of H2O2: 10 mM. | ||
A series of experiments were performed to optimize the conditions for the best degradation efficiency of MNZ, which included the molar ratio of Fe/Ti and Fe/Si, the concentration of MNZ, dosage of H2O2, reaction pH, dosage of Fe/Si codoped TiO2 and degradation time. The optimization procedure can be found in the ESI.† According to the optimization by RSM (response surface methodology),46 the most suitable conditions to obtain the best MNZ degradation efficiency were as follows: the molar ratio of Fe/Ti: 0.28; the molar ratio of Fe/Si: 6.0; the concentration of MNZ: 6 ppm; the dosage of H2O2: 10 mM; pH: 7.0; the dosage of catalysts: 0.3 g; the degradation time: 50 min.
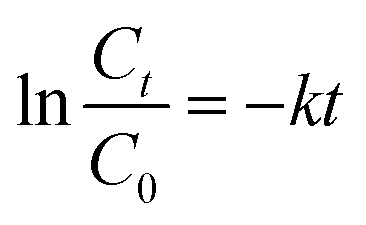
The applicability and degradation kinetics of the photo-Fenton process for the degradation of MNZ by Fe/Si codoped TiO2 were studied. Fig. 7a shows the degradation efficiency of the Fe/Si codoped TiO2 toward MNZ. About 93% of MNZ was degraded in 50 min. The degradation rate could be calculated using the following eqn (3):
 | (3) |
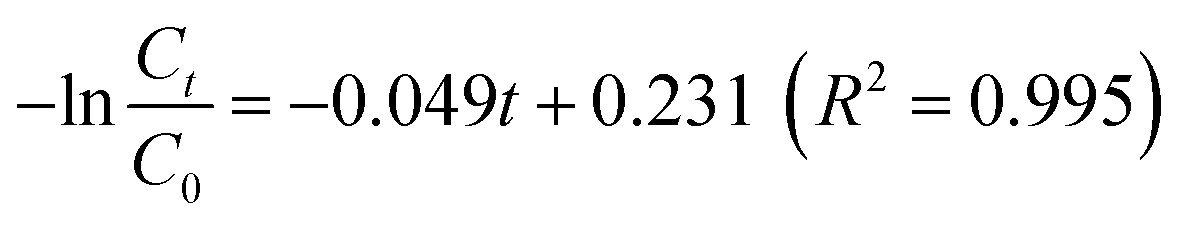 , indicating the pseudo-first-order-kinetic reaction character of MNZ degradation by the Fe/Si codoped TiO2.47
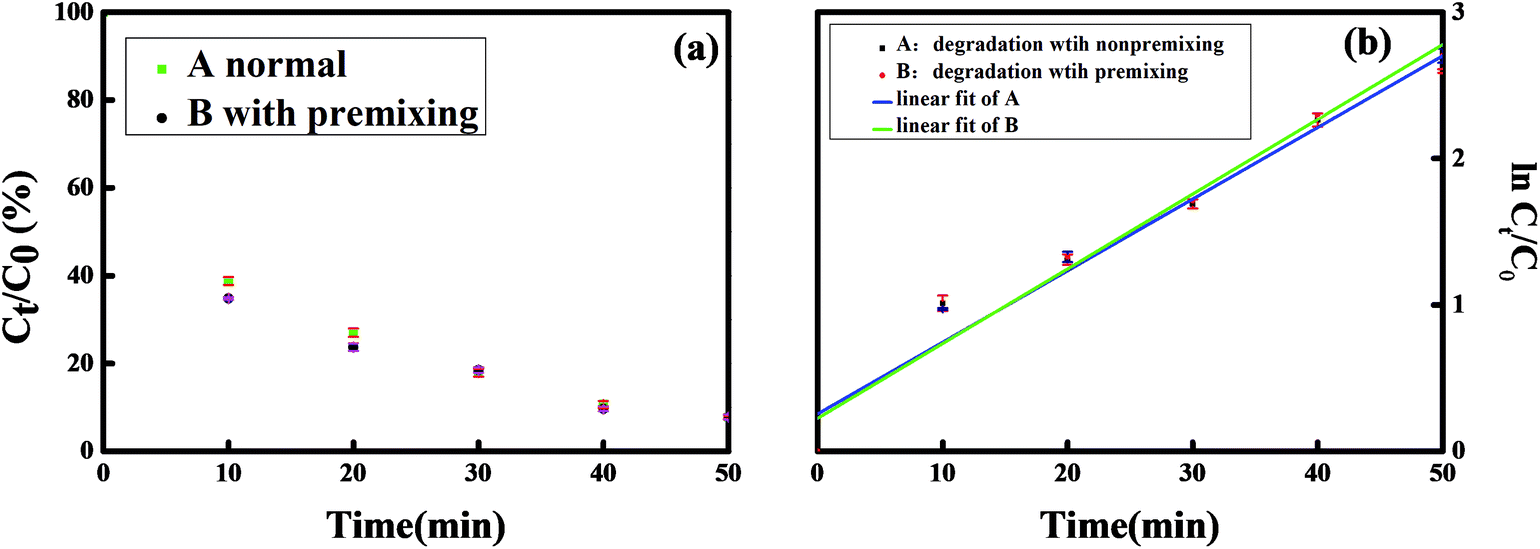 | ||
| Fig. 7 (a) Photocatalytic degradation of MNZ by Fe/Si codoped TiO2 with and without preadsorption for 30 min under visible light irradiation; (b) kinetic fit for the degradation of MNZ by Fe/Si codoped TiO2 with and without preadsorption for 30 min. | ||
The adsorption of MNZ on the Fe/Si codoped TiO2 nanoparticles in the dark was also investigated. The effect of the adsorption of MNZ on the Fe/Si codoped TiO2 was also studied. Before light irradiation, Fe/Si codoped TiO2 was mixed with MNZ for 30 min, and then the absorbance change of MNZ was detected. Fig. 7 indicates that little difference was observed between the MNZ concentration changes with and without the preadsorption process. This suggested the negligible effect of the preadsorption process. The kinetic reaction rate constant for the preadsorption process was 0.048 min−1, which is almost the same as that obtained without the adsorption process. This indicated that the MNZ degradation was achieved only by the photo-Fenton process but not by the adsorption process itself. Table S5† lists the degradation efficiencies of MNZ by different procedures and catalysts. Clearly, the method demonstrated in this work is more advantageous than some of the other reported methods.48–52 The photocatalytic performances of modified/doped TiO2 reported by others have also been summarized in Table S1.† To the best of our knowledge, the as obtained Fe/Si codoped TiO2 showed better activity than any of those under visible light irradiation in neutral solution. It can be used within a wide pH range and the degradation efficiency achieved was 93% within 50 min.
The active species may differ depending on the catalysts used and the nature of the contaminants undergoing degradation. To clarify the degradation mechanism, the influences of different scavengers on the degradation of MNZ were studied by using p-benzoquinone as an ·O2− scavenger,53 potassium nitrate as an e− scavenger,54 isopropanol and methanol as ·OH scavengers,55 and potassium iodide (KI) as both an H2O2 (ref. 56) and a h+ scavenger.53 Fig. 8a shows the results of the trapping experiments. For the ·O2− and e− scavengers, the addition of 600 ppm of p-benzoquinone and KNO3 to 6 ppm MNZ solution showed a limited effect on the photodegradation of MNZ. This implies that O2− and electrons have little effect on the degradation of MNZ. However, two stages can be distinguished in Fig. 8a for the study of the influence of KNO3. In the first 10 min, NO3− seems to delay the degradation process. For the following 40 min, the effect disappears, with a slight increase of the degradation efficiency. This can be explained as follows. In the early stage, NO3− competes with Fe(III) to consume electrons. This retards the formation of Fe(II). Later on, this effect is inhibited, probably due to the quick reaction rate between Fe(III) and electrons. Fe(III) can be reduced faster than NO3− because it can uptake electrons directly without a molecular rearrangement like that involved in the reduction of NO3−. Most of the electrons in Fe/Si codoped TiO2 are unable to recombine with the holes because of the quick reaction between the holes and the surface O2. Furthermore, the reaction between the electrons and Fe(III) also retards electron–hole recombination and thus enhances the degradation efficiency. Furthermore, the reaction of NO3− and electrons prolongs the lifetime of h+ and consequently produces more ·OH. All in all, Fe(III) plays such an important role in scavenging electrons that the scavenger character of NO3− is overshadowed.
 | ||
| Fig. 8 (a) Parallel experiments with various active-species scavengers (from left to right: KI, isopropanol, methanol, KNO3, p-benzoquinone and without scavengers) for the photodegradation of MNZ by the Fe/Si codoped TiO2 under visible light for different times. (b) The effects of H2O2 concentration on the photo-Fenton degradation efficiency of MNZ by the Fe/Si codoped TiO2. | ||
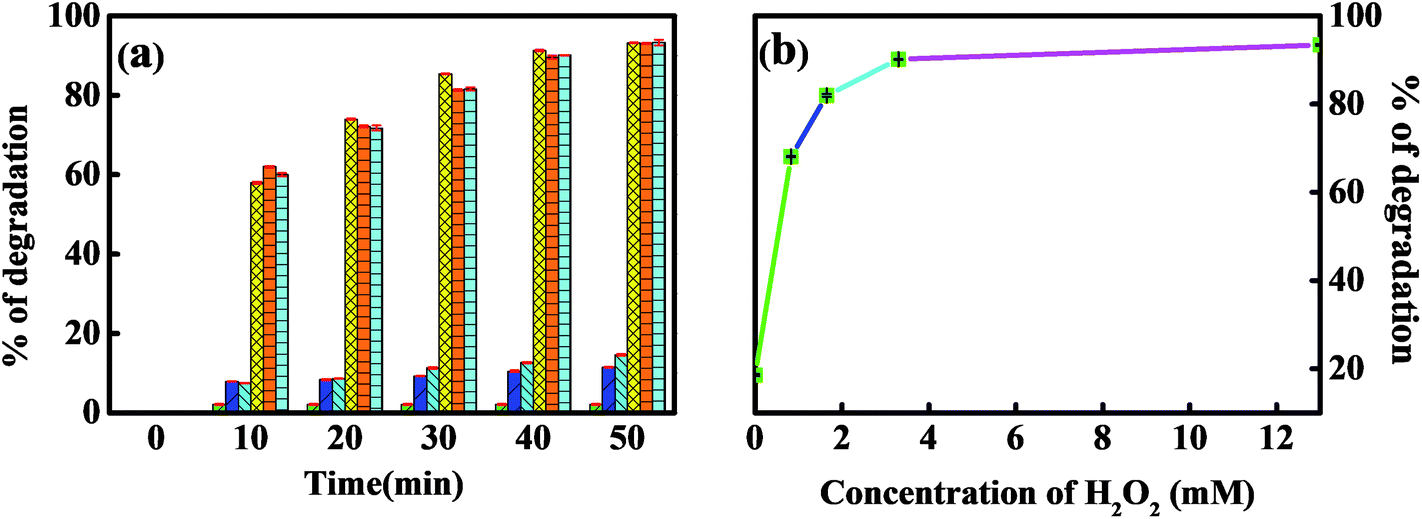
Fig. 8a also indicates that isopropanol and methanol inhibited MNZ degradation significantly. The photocatalytic efficiency decreased dramatically when KI was used as the scavenger. Less than 3% MNZ was degraded even after 50 min light irradiation in the presence of KI. This indicated that hydroxyl radicals and holes were reactive species in the system. When visible light was illuminated on the Fe/Si codoped TiO2, electrons would be excited from a filled valence band to an empty conduction band. Fe(III) would react with the electrons resulting in the effective separation of photo-generated electrons and holes and a low recombination rate. Electron holes (h+) with sufficient oxidation power in the VB, or in localized states within the band gap, can either be directly involved in the photocatalytic degradation reactions or, alternatively, produce ·OH by reacting with surface adsorbed hydroxyl groups and water.57–60 It is well known that the reaction product of trimesic acid with ·OH is intensely fluorescent whereas the target trimesic acid reactant is non-fluorescent.61 In this work, trimesic acid was used as a probe to detect ·OH. Fig. S2† shows that an obvious fluorescence signal with the peak at 450 nm was generated upon visible light irradiation of Fe/Si codoped TiO2 in the absence of H2O2. This means that the holes generated by the visible light irradiation possess sufficient oxidation power to react with surface adsorbed water and/or hydroxyl groups to generate ·OH. Fig. S2† also indicates that H2O2 itself can generate ·OH under light illumination, as reported previously.62 However, the Fe/Si codoped TiO2 showed about 5 times higher activity in generating ·OH in the presence of H2O2 than Fe/Si codoped TiO2 in the absence of H2O2. The obvious difference in generating ·OH of Fe/Si codoped TiO2 in the presence and absence of H2O2 could explain the degradation efficiencies of MNZ under different conditions. In the absence of H2O2, MNZ was degraded by ·OH produced from h+. Only ca. 21% MNZ was degraded. Interestingly, the degradation efficiency of MNZ increased to about 93% in the presence of H2O2 as shown in Fig. 6. Therefore, ·OH radicals produced from the Fenton process play the most important role for MNZ degradation. The well-known Fenton's reaction contributed to the production of large amounts of ·OH through the reaction of Fe(II) and H2O2.
Hydrogen peroxide is a vital component for degrading MNZ in the photo-Fenton systems. The effect of initial H2O2 concentration on MNZ removal has been examined and optimized (Fig. 8b). When the concentration of H2O2 was 1.65 mM, 67.85% degradation efficiency for MNZ was achieved. The degradation efficiency increased to 90.4% when the H2O2 concentration increased to 3.3 mM. The degradation efficiencies obtained at 3.3 and 13.0 mM H2O2 were almost the same. This may be due to the competitive reaction between H2O2 and MNZ for consuming ·OH63 when a large amount of H2O2 was used.
UV-vis spectra were used to test the MNZ removal by the proposed procedure (Fig. S3†). The characteristic absorption of MNZ around 320 nm gradually decreased with the increasing of the reaction time. At the same time, an increase of absorbance below 240 nm was observed. This may be due to the formation of an intermediate during the photo-Fenton process. To have a good understanding of the MNZ degradation pathway in the Fe/Si codoped TiO2 catalyzed photo-Fenton process, the HPLC-MS spectra were used to identify the by-products of MNZ degradation and the results are shown in Fig. 9.
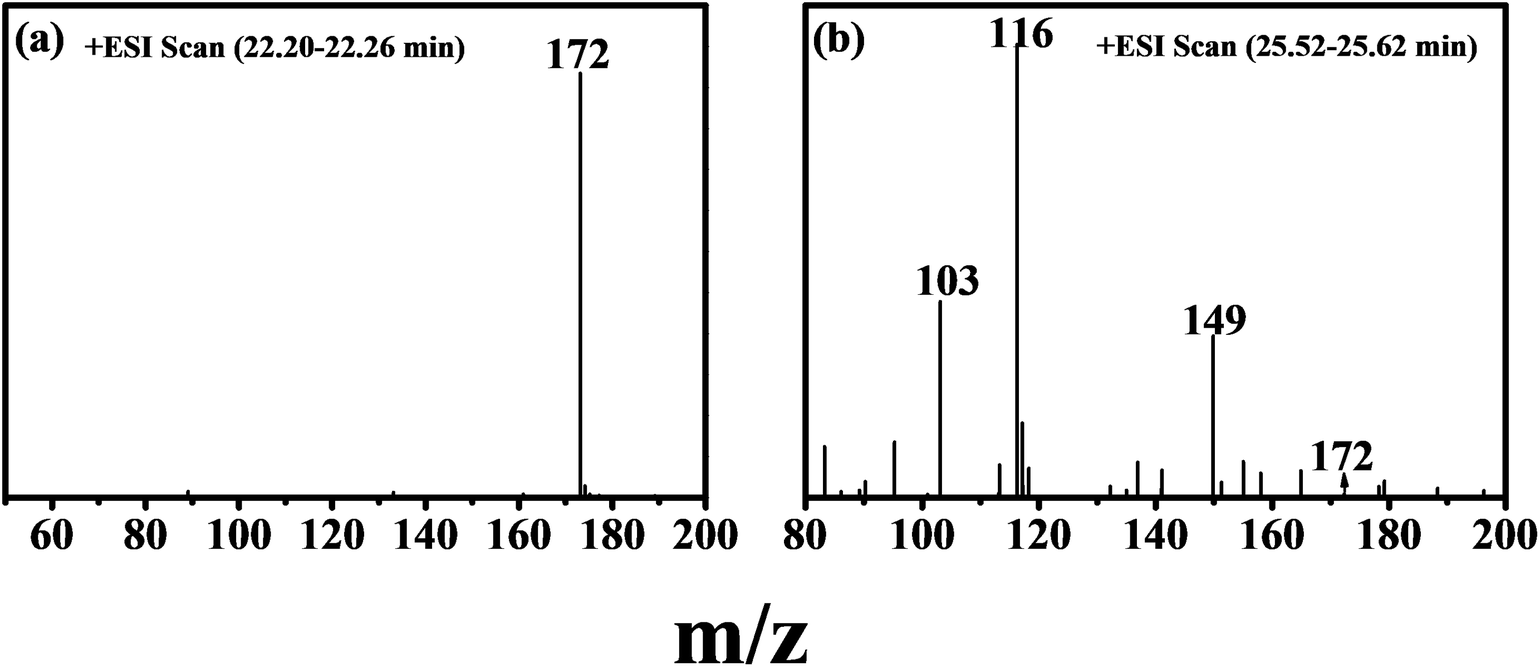 | ||
| Fig. 9 (a) HPLC-MS spectrum of MNZ, (b) and the degradation products of MNZ after the photo-Fenton treatment for 50 min. | ||
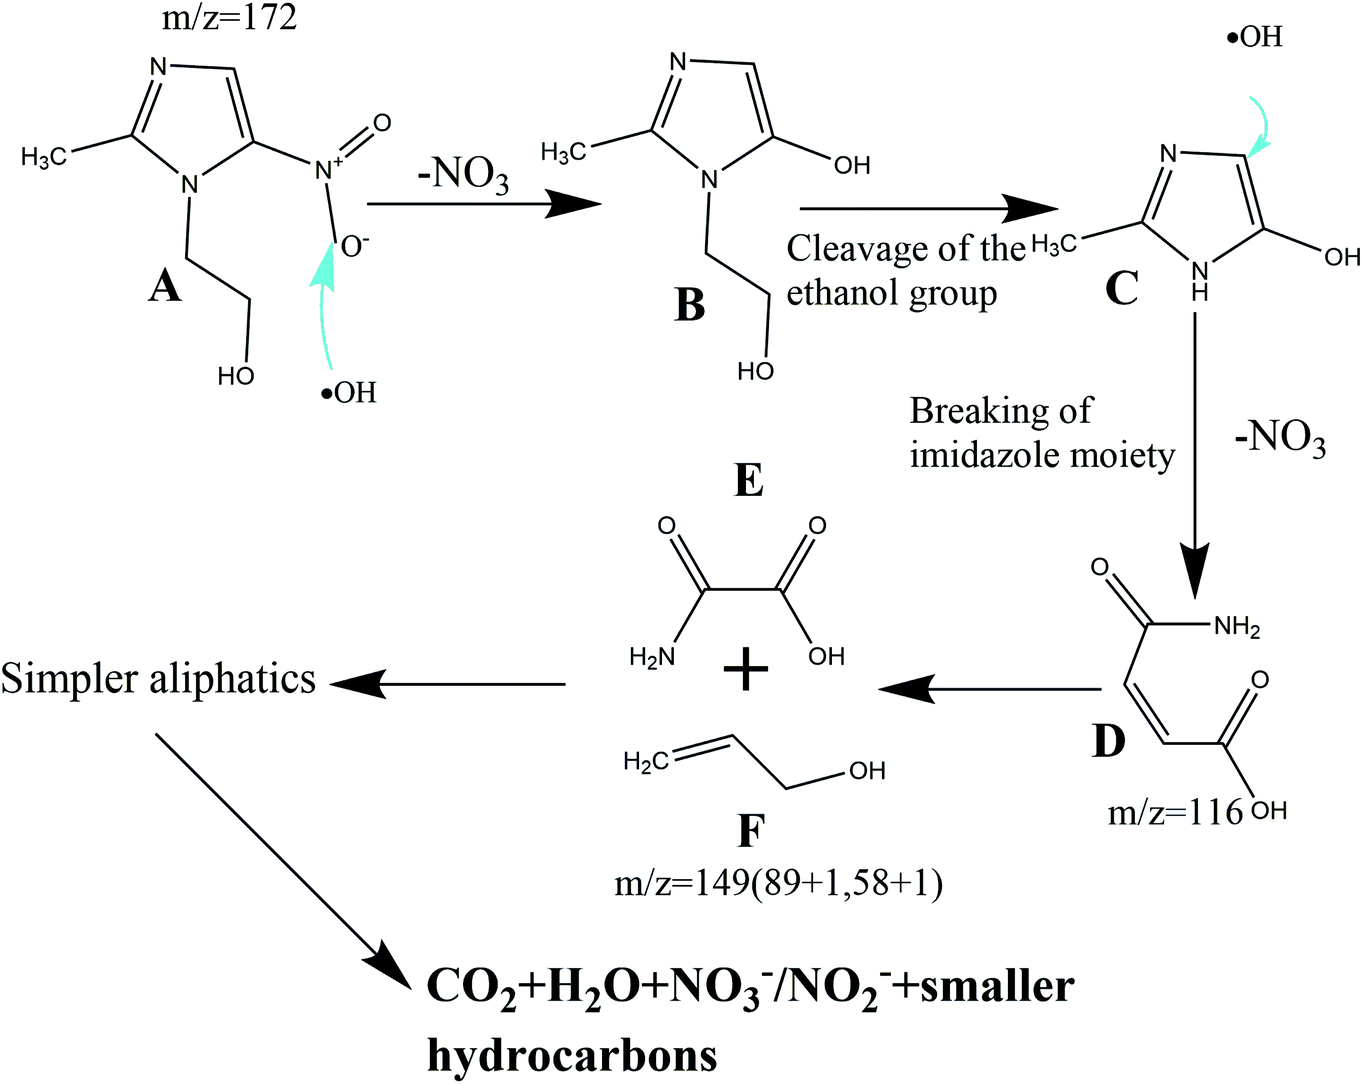
On the basis of the radical scavenging results and the analysis of the reaction intermediates by HPLC-MS, Scheme 2 illustrates the reaction process proposed for MNZ degradation and mineralization by Fe/Si codoped TiO2 photo-Fenton systems. The characteristic peak of MNZ (m/z = 171) disappeared after undergoing the degradation process for 50 min, indicating that MNZ was decomposed into various intermediates or partially mineralized. Two stable intermediates with m/z values 149 and 116 were observed in the HPLC-MS spectra. Scheme 2 elucidates their formation process. Firstly, compound B was formed when ·OH attacked MNZ and caused the release of nitrogen from MNZ in the photocatalytic system. Subsequently, compound C was formed by removing the lateral N-ethanol group from compound B. Further, the compound C was cleaved to compound D (3-carbamoyl prop-2-enoic acid, m/z 116) due to the opening of the imidazole moiety. The removal of lateral groups (i.e.–CH![[double bond, length as m-dash]](https://www.rsc.org/images/entities/char_e001.gif) CH–) from compound D led to the formation of compound E, which was a short-linear aliphatic carboxylic acid. The addition of compounds E and F (2-propen-1-ol) present in the system formed a compound with an m/z value of 149. These results correlated well with some previously reported work.64
CH–) from compound D led to the formation of compound E, which was a short-linear aliphatic carboxylic acid. The addition of compounds E and F (2-propen-1-ol) present in the system formed a compound with an m/z value of 149. These results correlated well with some previously reported work.64
 | ||
| Scheme 2 Proposed MNZ degradation and mineralization pathway by Fe/Si codoped TiO2. | ||
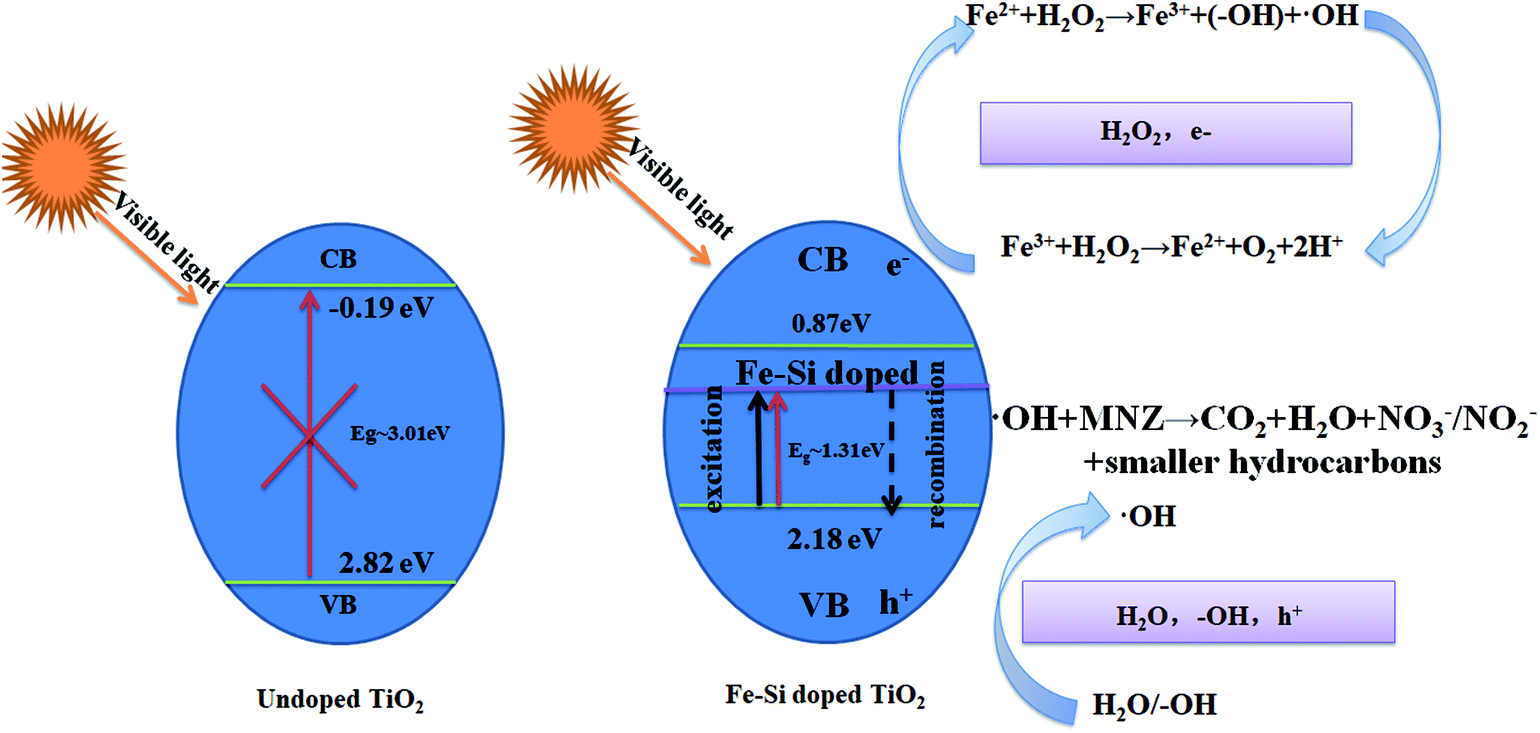
In the light of these above results, a possible reaction mechanism of the Fe/Si codoped TiO2 for MNZ degradation is suggested in eqn (4) and (5) and schematically illustrated in Scheme 3. The Fe and Si doping, light illumination, and hydrogen peroxide are all important factors that determine the operating efficiency. Under visible light irradiation, the Fe/Si codoped TiO2 generated electrons (e−) and holes (h+). Next, electrons reacted with Fe(III) to generate Fe(II) (eqn (4)), the crucial catalytic species in the Fenton reaction (eqn (3)). After Fe(II) reacted with H2O2, Fe(III) was generated again (eqn (5)). During the Fe(III)/Fe(II) circulation, most electrons were consumed rather than undergoing recombination with the holes. Therefore, a synergistic effect was achieved when the Fe/Si codoped TiO2, light irradiation and H2O2 coexisted in the system. MNZ molecules were attacked by ·OH to generate degradation products and the products were further mineralized into CO2 and H2O.
| Fe3+ + e− → Fe2+ | (4) |
| Fe2+ + H2O2 → Fe3+ + ·OH + OH− | (5) |
 | ||
| Scheme 3 Proposed mechanism for MNZ degradation with Fe/Si codoped TiO2 under visible light irradiation. | ||
H2O2 could also react with the photogenerated electrons to generate ·OH radicals (eqn (6)).
| H2O2 + e− → ·OH + OH− | (6) |
Because of the recycling of Fe(III) during the light irradiation and Fenton process, less ferrous ions were converted into Fe(III) sludge. Previous studies also indicated that Si was forced to enter the crystal lattice of TiO2 to establish a Si–O–Ti bond during the catalyst preparation process. This bond can facilitate the movement of photo-generated electrons from the surface to the doped Fe(III), which could improve the quantum yield and increase the photocatalytic activity of the catalysts. Besides, the Si doping increased the specific area of the catalysts. A high surface area can achieve facile adsorption/desorption equilibrium and mass diffusion of reactants and products and thus enhance the activity and stability of the photocatalytic materials in the photocatalytic application. Furthermore, a positively charge region was generated around the doped Si, which promoted the adsorption of hydroxyl groups to neutralize the charge. Therefore, more holes could react with the adsorbed hydroxyl groups to produce ·OH, the most important species for MNZ degradation. All in all, the synergistic effect of Fe and Si codoping is the main reason for the superior efficiency of the catalyst.
3.3. Reusability and stability of the Fe/Si codoped TiO2
Good reusability and stability are also important issues that should be considered for practical use besides the good catalytic performance of the photocatalysts. Fig. 10a shows the MNZ degradation efficiency by the Fe/Si codoped TiO2 with repeated recovery cycles. The degradation efficiency decreased slightly when using the recovered Fe/Si codoped TiO2. This may be due to the leaching of Fe3+ from the Fe/Si codoped TiO2. Metal leaching from the catalyst is an important factor to be considered when metal doped TiO2 is used. Metal leaching would decrease the photocatalytic activity of the catalyst and cause secondary contamination to the environment. In the present work, the concentrations of Fe in MNZ solution after being treated by the Fe/Si codoped TiO2 and Fe doped TiO2 were measured by inductively coupled plasma-atomic emission spectrometry (ICP-AES). These concentrations could reflect the extent of leaching of Fe from the catalyst during the photo-Fenton reaction period. Fig. 10b compares the amounts of Fe in the treated MNZ solutions that were irradiated by visible light for 6 h with the Fe/Si codoped TiO2 catalyst and with Fe doped TiO2 catalyst. The amount of leaching was 0.46 ppm for the Fe doped TiO2 but about 0.047 ppm for the Fe/Si codoped TiO2. This indicates the low level leaching of Fe/Si codoped TiO2, which makes it promising for industrial applications. The doping of Si in the lattice of TiO2 enhanced the photochemical stability of the Fe/Si codoped TiO2.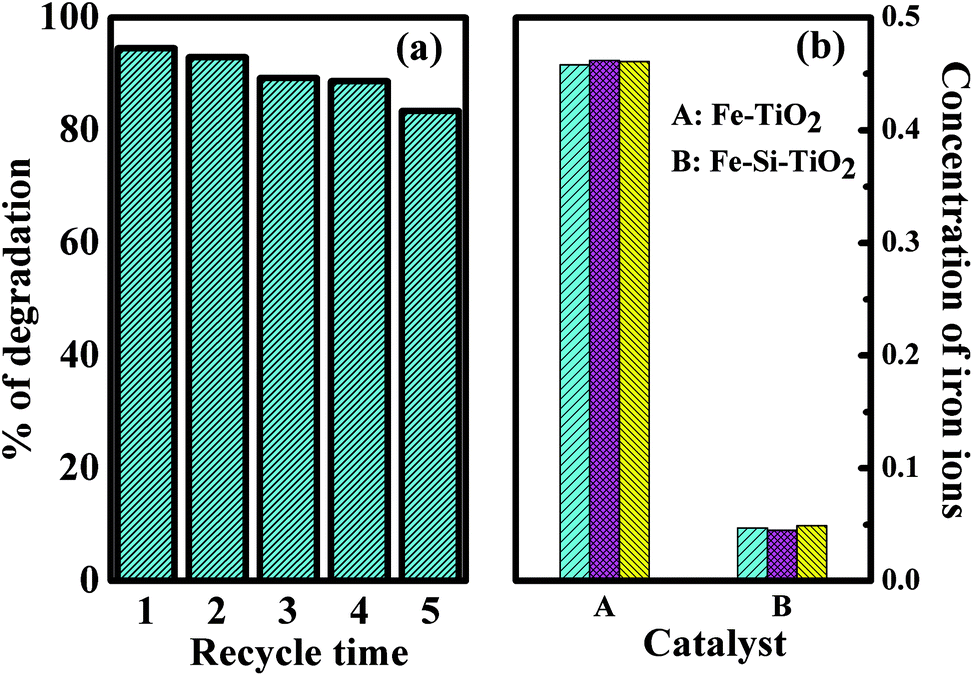 | ||
| Fig. 10 (a) Reusability of Fe/Si codoped TiO2 for degradation of MNZ. (b) The concentrations of iron ions in MNZ solution after degradation using Fe doped TiO2 and Fe/Si codoped TiO2. | ||
To further confirm the stability of the Fe/Si codoped TiO2, FETEM and XPS techniques were used to characterize the used Fe/Si codoped TiO2. The corresponding results are shown in the ESI (Fig. S4 and S5†). Compared with the fresh sample (Fig. 4), the recycled one (Fig. S4†) seemed to have a much better dispersity. This may be caused by the stirring process during the reaction. However, the morphology (Fig. S4†) and XPS pattern (Fig. S5†) did not change significantly after the photocatalysis. These results further supported the stability of the catalyst.
4. Conclusions
In this work, nano-sized Fe/Si codoped TiO2 was prepared by a simple solvothermal method. It was further used as an efficient catalyst for degrading MNZ by the photo-Fenton process. UV-vis, XRD, BET, FETEM and XPS results confirmed the successful doping of Fe and Si into TiO2. The obtained catalyst showed excellent activity throughout the course of the reaction, which mainly arose from the doping of Fe and Si. The doped Fe(III) reduced the band gap of TiO2, allowing it to receive photogenerated electrons to prevent e−/h+ pair recombination, and promoted MNZ degradation reactions. The doped silicon reduced the band gap of TiO2, improved the stability and increased the surface area of the photocatalyst. As a clean, efficient, reusable and stable catalyst with low energy consumption, Fe/Si codoped TiO2 will have a good application prospect in the treatment of water for antibiotic degradation.Conflicts of interest
There are no conflicts to declare.Acknowledgements
We gratefully thank NSFC (21675140, 21575124, 21275124, 21275125, and 21705141), the Natural Science Foundation of Jiangsu Province (BK20181219), the High-end Talent Project of Yangzhou University, the 14th Six Talent Peaks Project in Jiangsu Province (SWYY-085), Higher Education Outstanding Scientific and Technological Innovation Team of Jiangsu Province (2017-6), Young academic leaders of Jiangsu Province (2018), the project funded by the PAPD and TAPP. We also thank the Test Center of Yangzhou University for the XPS, BET, SEM, TEM and HPLC-MS characterizations.References
- Z. Fang, J. Chen, X. Qiu, X. Qiu, W. Cheng and L. Zhu, Desalination, 2011, 268, 60–67 CrossRef CAS.
- C. Willyard, Nature, 2017, 543, 15 CrossRef CAS PubMed.
- Y. Li, L. Liu and F. Yang, J. Membr. Sci., 2017, 525, 202–209 CrossRef CAS.
- F. Mohammad, H. A. Al-Lohedan and H. N. Al-Haque, Adv. Mater. Lett., 2016, 8, 89–100 CrossRef.
- T. Saitoh, K. Shibata, K. Fujimori and Y. Ohtani, Sep. Purif. Technol., 2017, 187, 76–83 CrossRef CAS.
- Y.-f. Su, G.-B. Wang, D. T. F. Kuo, M.-l. Chang and Y.-h. Shih, Appl. Catal., B, 2016, 186, 184–192 CrossRef CAS.
- E. Topkaya, M. Konyar, H. C. Yatmaz and K. Ozturk, J. Colloid Interface Sci., 2014, 430, 6–11 CrossRef CAS PubMed.
- A. Dhakshinamoorthy, S. Navalon, M. Alvaro and H. Garcia, ChemSusChem, 2012, 5, 46–64 CrossRef CAS PubMed.
- R. Andreozzi, V. Caprio, A. Insola and R. Marotta, Catal. Today, 1999, 53, 51–59 CrossRef CAS.
- J. C. Espinosa, C. Catala, S. Navalon, B. Ferrer, M. Alvaro and H. Garcia, Appl. Catal., B, 2018, 226, 242–251 CrossRef CAS.
- B.-H. Moon, Y.-B. Park and K.-H. Park, Desalination, 2011, 268, 249–252 CrossRef CAS.
- X. Yang, X. Cheng, A. A. Elzatahry, J. Chen, A. Alghamdi and Y. Deng, Chin. Chem. Lett., 2018 DOI:10.1016/j.cclet.2018.06.026.
- S. Navalon, R. Martin, M. Alvaro and H. Garcia, Angew. Chem., Int. Ed., 2010, 49, 8403–8407 CrossRef CAS PubMed.
- J. Herney-Ramirez, M. A. Vicente and L. M. Madeira, Appl. Catal., B, 2010, 98, 10–26 CrossRef CAS.
- A. N. Soon and B. H. Hameed, Desalination, 2011, 269, 1–16 CrossRef CAS.
- J. C. Espinosa, S. Navalon, M. Alvaro and H. Garcia, Catal. Sci. Technol., 2016, 6, 7077–7085 RSC.
- Y. Shi, H. Li, L. Wang, W. Shen and H. Chen, ACS Appl. Mater. Interfaces, 2012, 4, 4800–4806 CrossRef CAS PubMed.
- H. Yu, X. Huang, P. Wang and J. Yu, J. Phys. Chem. C, 2016, 120, 3722–3730 CrossRef CAS.
- Y. Zhang, Y. Li, W. Sun, C. Yuan, B. Wang, W. Zhang and X. M. Song, Langmuir, 2017, 33, 12065–12071 CrossRef CAS PubMed.
- J. C. Espinosa, S. Navalon, M. Alvaro and H. Garcia, Chemcatchem, 2016, 8, 2642–2648 CrossRef CAS.
- H. Dong, G. Zeng, L. Tang, C. Fan, C. Zhang, X. He and Y. He, Water Res., 2015, 79, 128–146 CrossRef CAS PubMed.
- M. Pedrosa, L. M. Pastrana-Martínez, M. F. R. Pereira, J. L. Faria, J. L. Figueiredo and A. M. T. Silva, Chem. Eng. J., 2018, 348, 888–897 CrossRef CAS.
- V. Moradi, M. B. G. Jun, A. Blackburn and R. A. Herring, Appl. Surf. Sci., 2018, 427, 791–799 CrossRef CAS.
- X. Chen, D.-H. Kuo and D. Lu, Chem. Eng. J., 2016, 295, 192–200 CrossRef CAS.
- X. Li, J. Wang, M. Li, Y. Jin, Z. Gu, C. Liu and K. Ogino, Chin. Chem. Lett., 2018, 29, 527–530 CrossRef CAS.
- M. Hu and Y. Xu, Chem. Eng. J., 2014, 246, 299–305 CrossRef CAS.
- J. Yu, Q. Xiang and M. Zhou, Appl. Catal., B, 2009, 90, 595–602 CrossRef CAS.
- L. Wen, B. Liu, X. Zhao, K. Nakata, T. Murakami and A. Fujishima, Int. J. Photoenergy, 2012, 2012, 1–10 Search PubMed.
- Y. Lin, Z. Jiang, C. Zhu, X. Hu, X. Zhang, H. Zhu, J. Fan and S. H. Lin, Appl. Catal., B, 2013, 142–143, 38–44 CrossRef CAS.
- Y. Shen, T. Xiong, T. Li and K. Yang, Appl. Catal., B, 2008, 83, 177–185 CrossRef CAS.
- Q. Xiao and L. Gao, J. Alloys Compd., 2013, 551, 286–292 CrossRef CAS.
- D. Wang, Y. Zou, S. Wen and D. Fan, Appl. Phys. Lett., 2009, 95, 012106 CrossRef.
- Y. Lin, Z. Jiang, C. Zhu, X. Hu, H. Zhu, X. Zhang, J. Fan and S. H. Lin, Int. J. Hydrogen Energy, 2013, 38, 5209–5214 CrossRef CAS.
- Z. Wu, H. Liu, D. Dai and C. Liu, J. Sol-Gel Sci. Technol., 2017, 83, 243–251 CrossRef CAS.
- B. Wang, Y. Wang, Y. Lei, N. Wu, Y. Gou, C. Han, S. Xie and D. Fang, Nano Res., 2016, 9, 886–898 CrossRef CAS.
- J. G. Yu, H. G. Yu, B. Cheng, X. J. Zhao, J. C. Yu and W. K. Ho, J. Phys. Chem. B, 2003, 107, 13871–13879 CrossRef CAS.
- X. Y. Deng, Q. L. Ma, Y. Q. Cui, X. W. Cheng and Q. F. Cheng, Appl. Surf. Sci., 2017, 419, 409–417 CrossRef CAS.
- X. Yan, J. He, D. G. Evans, X. Duan and Y. Zhu, Appl. Catal., B, 2005, 55, 243–252 CrossRef CAS.
- X. L. Song, Y. Y. Li, Z. D. Wei, S. Y. Ye and D. D. Dionysiou, Chem. Eng. J., 2017, 314, 443–452 CrossRef CAS.
- M. Asiltürk, F. Sayılkan and E. Arpaç, J. Photochem. Photobiol., A, 2009, 203, 64–71 CrossRef.
- M. Kang and M.-H. Lee, Appl. Catal., A, 2005, 284, 215–222 CrossRef CAS.
- H. Tang, S. F. Chang, K. Q. Wu, G. G. Tang, Y. H. Fu, Q. Q. Liu and X. F. Yang, RSC Adv., 2016, 6, 63117–63130 RSC.
- C. R. Brundle, T. J. Chuang and K. Wandelt, Surf. Sci., 1977, 68, 459–468 CrossRef CAS.
- J. Zhu, F. Chen, J. Zhang, H. Chen and M. Anpo, J. Photochem. Photobiol., A, 2006, 180, 196–204 CrossRef CAS.
- L. Huang, G. Su, A. Zhang, Y. Shi, C. Xia, H. Lu, L. Li, S. Liu and M. Zheng, J. Hazard. Mater., 2013, 261, 451–462 CrossRef CAS PubMed.
- A. I. Khuri and S. Mukhopadhyay, Wiley Interdiscip. Rev. Comput. Stat., 2010, 2, 128–149 CrossRef.
- M. Sánchez-Polo, J. Rivera-Utrilla, G. Prados-Joya and R. Ocampo-Pérez, J. Chem. Technol. Biotechnol., 2012, 87, 1202–1208 CrossRef.
- J. M. Gong, T. Fang, D. H. Peng, A. M. Li and L. Z. Zhang, Biosens. Bioelectron., 2015, 73, 256–263 CrossRef CAS PubMed.
- M. Farzadkia, E. Bazrafshan, A. Esrafili, J. K. Yang and M. Shirzad-Siboni, J. Environ. Health Sci. Eng., 2015, 13, 35–42 CrossRef PubMed.
- H. B. Ammar, Ultrason. Sonochem., 2016, 33, 164–169 CrossRef CAS PubMed.
- Y. H. Yan, T. J. Ni, J. G. Du, L. Li, S. Fu, K. Li and J. G. Zhou, Dalton Trans., 2018, 47, 6089–6101 RSC.
- M. Farzadkia, A. Esrafili, M. A. Baghapour, Y. D. Shahamat and N. Okhovat, Desalin. Water Treat., 2014, 52, 4947–4952 CrossRef CAS.
- Y. Y. Shi, Y. D. Hu, L. Zhang, Z. W. Yang, Q. H. Zhang, H. Cui, X. F. Zhu, J. Z. Wang, J. Chen and K. L. Wang, Appl. Clay Sci., 2017, 137, 249–258 CrossRef CAS.
- W. Deng, H. Zhao, F. Pan, X. Feng, B. Jung, A. Abdel-Wahab, B. Batchelor and Y. Li, Environ. Sci. Technol., 2017, 51, 13372–13379 CrossRef CAS PubMed.
- M. Pelaez, P. Falaras, V. Likodimos, K. O'Shea, A. A. de la Cruz, P. S. M. Dunlop, J. A. Byrne and D. D. Dionysiou, J. Mol. Catal. A: Chem., 2016, 425, 183–189 CrossRef CAS PubMed.
- P. Schopfer, C. Plachy and G. Frahry, Plant Physiol., 2001, 125, 1591–1602 CrossRef CAS PubMed.
- T. L. Thompson and J. T. Yates, Chem. Rev., 2006, 106, 4428–4453 CrossRef CAS PubMed.
- X. Chen and S. S. Mao, Chem. Rev., 2007, 107, 2891–2959 CrossRef CAS PubMed.
- W. W. Zhao, J. J. Xu and H. Y. Chen, Chem. Soc. Rev., 2015, 44, 729–741 RSC.
- Y. Q. Wang, W. J. Chu, S. S. Wang, Z. H. Li, Y. H. Zeng, S. C. Yan and Y. M. Sun, ACS Appl. Mater. Interfaces, 2014, 6, 20197–20204 CrossRef CAS PubMed.
- Y. Zang, J. P. Lei, Q. Hao and H. X. Ju, ACS Appl. Mater. Interfaces, 2014, 6, 15991–15997 CrossRef CAS PubMed.
- X. Z. Li, C. C. Chen and J. C. Zhao, Langmuir, 2001, 17, 4118–4122 CrossRef CAS.
- M. B. Kasiri, H. Aleboyeh and A. Aleboyeh, Appl. Catal., B, 2008, 84, 9–15 CrossRef CAS.
- N. Neghi and M. Kumar, Water, Air, Soil Pollut., 2017, 228, 339–350 CrossRef.
Footnote |
| † Electronic supplementary information (ESI) available. See DOI: 10.1039/c8ra08114j |
| This journal is © The Royal Society of Chemistry 2018 |