
 Open Access Article
 This Open Access Article is licensed under a Creative Commons Attribution-Non Commercial 3.0 Unported Licence
Hydration of phenylacetylene on sulfonated carbon materials: active site and intrinsic catalytic activity†
Pengqiang Yanab,
Zailai Xie *c,
Siyuan Tiana,
Fan Lia,
Dan Wangad,
Dang Sheng Su*a and
Wei Qi*ab
*c,
Siyuan Tiana,
Fan Lia,
Dan Wangad,
Dang Sheng Su*a and
Wei Qi*ab
aShenyang National Laboratory for Materials Science, Institute of Metal Research, Chinese Academy of Sciences, 72 Wenhua Road, Shenyang, 110016, P. R. China. E-mail: wqi@imr.ac.cn; dssu@imr.ac.cn
bUniversity of Chinese Academy of Sciences, Beijing, 100049, P. R. China
cState Key Laboratory of Photocatalysis on Energy and Environment, College of Chemistry, Fuzhou University, Fuzhou 350116, P. R. China. E-mail: zlxie@fzu.edu.cn
dSchool of Sciences, Northeastern University, Shenyang, Liaoning 110819, China
First published on 14th November 2018
Abstract
A series of sulfonated carbon materials (sulfonated glucose-derived carbon, carbon nanotubes, activated carbon and ordered mesoporous carbon, denoted as Sglu, SCNT, SAC and SCMK, respectively) were synthesized and applied as acid catalysts in phenylacetylene (PA) hydration reactions. The sulfonic acid groups (–SO3H) were identified to be the only kind of active sites and were quantified with XPS and a cation exchange process. Mechanistic studies revealed that the catalytic PA hydration reaction follows pseudo first order reaction kinetics. Sglu exhibits a higher reaction rate constant (k) and lower apparent activation energy (Ea) in the hydration reactions than SCNT catalysts. NH3-temperature programmed desorption measurement results revealed that the relatively high catalytic activity of Sglu was attributed to both the stronger acidity and larger number of –SO3H active sites. This work exhibited the performance of carbon materials without any extra acidic additives in PA hydration reaction and investigated the intrinsic catalytic activity by kinetics. The present work provides the possibility for acid catalytic applications of carbon materials, which sheds light on the environmentally friendly and sustainable production strategy for aldehyde ketone compounds via the catalytic alkyne hydration reactions.
1. Introduction
Alkyne hydration is a mature reaction route for the industrial production of aldehyde compounds due to the relatively high target product selectivity (>99%) and nearly 100% atomic economy of this process,1 and the product aldehyde ketones are considered as some of the most important precursors or raw materials for pesticides, hypnotics, and essences etc. The classical alkyne hydration reaction system involves the application of mercuric salt catalysts in aqueous sulfuric acid media, which has gradually become obsolete due to their relatively high toxicity and serious pollution issues, although they exhibit pretty high catalytic activity under mild conditions. Some other dispersed transition metal clusters or single atoms2,3 or precious metal catalysts, such as Ru,4 Rh,5 Pd,6 Au7 etc., have also been developed and applied in alkyne hydration reactions as alternatives for mercury compounds in consideration of the environmental requirements. Despite the relatively high price of the noble metal catalytic systems, the applications of noble metals also need the assistance of excess mineral acid, such as HClO4 or H2SO4,7,8 to achieve high yields of aldehyde products. Some other transition metal (Fe etc.)9 or Brønsted acid catalysts10 have also been reported, but their catalytic activity are normally not very high. In addition, the difficulty in separation of the catalysts and the loss of the active phase also limits the potential applications of these current existing catalyst systems. The main text of the article should appear here with headings as appropriate.Nanocarbon materials have exhibited relatively high and stable activity in organic compound dehydrogenation,11 selective oxidation,12 hydrogenation,13 and hydrohalogenation14 reactions etc., and they have shown great potential in replacing conventional metal based catalysts. The advantage of nanocarbon materials lies in their earth abundance, gentle and controllable redox ability, tunable porous structure and conjugation size etc., leading to high target product selectivity, catalyst stability, recyclability and sustainability.15,16 Actually, the perfect graphitic lattice is chemically inert and has only limited catalytic activity. Oxygen or nitrogen functionalities on the edges or defects normally serve as the active sites for nanocarbon catalytic materials.17–20 Therefore, nanocarbon materials are normally applied in catalyzing redox reactions, since the acidity of oxygen functionalities (carboxylic acid groups) are weak. The introduction of carboxylic21 or sulfonic22 acid group could improve the acid catalytic activity of nanocarbon materials in some extent. However, the related research still exists in its initial period, although several successful examples have been reported.23–25 The origin and the intrinsic acid catalytic activity, namely the identity and quantity of the acid active sites, are still unclear. In the present work, we tested the acid catalytic activity of several typical sulfonated carbon materials in phenylacetylene (PA) hydration reactions, including amorphous hydrothermal carbon, mesoporous carbon and nanocarbon with relatively high graphitic degree. Furthermore, the identity, quantity and acid strength of the active sites on different carbon materials were revealed with cation exchange, ammonia temperature programmed desorption (NH3-TPD) and X-ray photoelectron spectroscopy (XPS) techniques. The basic understandings on the structure–function relations of carbon based acid catalysts were provided via analysing and comparing the kinetic and thermodynamic parameters of these catalysts in hydration reactions. The present paper summarized the strategy in quantitative characterizations of the acid catalytic activity of carbon materials, which sheds light on the fair evaluation and the rational design of the efficient carbon based acid catalytic systems.
2. Experimental section
2.1 Chemicals
D-Glucose, active carbon (AC), concentrated nitric acid (65–68%) and concentrated sulfuric acid (98%) were purchased from Sinopharm Chemical Reagent Co., Ltd. Phenylacetylene (PA) was purchased from Alfa Aesar. Carbon nanotubes (CNTs) were provided by Shandong Dazhan Nano Materials Co., Ltd. The ordered mesoporous carbon (CMK) was purchased from Nanjing Ji Cang Nano Tech Co., Ltd.2.2 Preparation of the carbon catalysts and the chemical reaction process
The pristine D-glucose (5.0 g) powder was pre-treated at 400 °C under N2 flow (150 ml min−1) for 15 h, and the product was then grounded to powder (denoted as glu, 1.41 g). The commercial CNT (2.0 g) was oxidized by refluxing in concentrated nitric acid (100 ml) at 120 °C for 2 h, resulting the oxidized CNT (oCNT, 1.98 g). The sulfonation of glu, oCNT, AC and CMK was performed as following procedures according to the literature reported method.26 1 g carbon materials (glu, oCNT, AC or CMK) were added into 100 ml concentrated sulfuric acid, and the mixture was refluxed at 150 °C for 15 h under N2 flow (50 ml min−1). After cooling down to room temperature, the sulfonated carbon materials were separated via filtration and washed thoroughly with deionized water until the filtrate reached neutral. The obtained sulfonated samples are named as Sglu, SCNT, SAC and SCMK, respectively.The carbon catalysed PA hydration reaction was performed under ambient pressure. In a typical run, 100 mg carbon catalysts, 1 ml PA and 1.8 ml H2O (H2O is in excess of PA) were mixed and refluxed at 120 °C. After given reaction time, the catalysts were then removed via filtration and washed with 5 ml cyclohexane and 5 ml H2O, respectively. Finally, the concentration of the residual reactant and the forming product is analyzed with gas chromatography.
2.3 Characterization techniques
The concentrations of the reactants and products were detected by the instrumentation of Agilent 7890A gas chromatography. C 1s, O 1s, S 2p XPS spectra were obtained with an ultra-high vacuum (UHV) ESCALAB 250 system equipped with a monochromatic AlKα X-ray source (1486.6 eV; anode operating at 15 kV and 20 mA). Raman measurements were carried out with HORIBA LabRam HR800 Raman spectroscopy equipped with laser source whose wavelength was 633 nm. TEM analysis was performed using an FEI Tecnai G2 T12 microscope with an accelerating voltage of 120 kV. Textural analyses were performed by N2 physisorption at 77 K by using a Micromeritics ASAP 2020 apparatus. The surface area was calculated using the BET method. The NH3-TPD profiles were recorded by using a mass spectrometer connected to a fixed bed micro-reactor. 100 mg samples were firstly dried in the reactor at 120 °C for 2 h in the presence of He flow (25 ml min−1). The adsorption of NH3 (10% NH3 balanced with He, 100 ml min−1) was performed at 35 °C for 2 h. Then the physically adsorbed ammonia was removed by purging He flow (50 ml min−1) for 8 h at 120 °C. At last the TPD profile was recorded upon heating the sample at a rate of 5 K min−1 to 700 °C. The cation exchange and titration of –SO3H groups was performed as the following procedure. 50 mg NaCl and 50 mg of unsulfonated or sulfonated samples (abbreviated as us or ss, respectively) were mixed in 20 ml deionized water, and the mixture was stirred at room temperature for 24 h. The pH value of the supernatant was measured by pH meter, and the content of –SO3H (S) on carbon materials was calculated with the following equation (eqn (1)):
 | (1) |
3. Results and discussion
3.1 Chemical structure of the acid functionalized nanocarbon materials
The sulfonated glucose-derived carbon, carbon nanotube, activated carbon and ordered mesoporous carbon (denoted as Sglu, SCNT, SAC and SCMK, respectively) are selected as typical carbon materials with different textural parameters. The sulfonation process was achieved through refluxing carbon materials (including glucose-derived carbon, oCNT, AC and CMK) in concentrated sulfuric acid at 150 °C.The CNT sample was pre-oxidized with concentrated nitric acid before sulfonation to introduce more “defect sites” (oxygen functionalities) for anchoring sulfonate groups.27,28 Fig. 1 shows the TEM images of the carbon materials after sulfonation. The morphology of the carbon materials keep almost the same as non-sulfonated ones. Sglu consists of stacked nano-slices with irregular sizes, and SAC exhibits abundant pore structures. SCNT and SCMK exhibit typical tubular and lamellar structures, respectively. Sglu and SAC exhibit amorphous features, while SCNT and SCMK are ordered carbon materials with higher degree of graphitization.
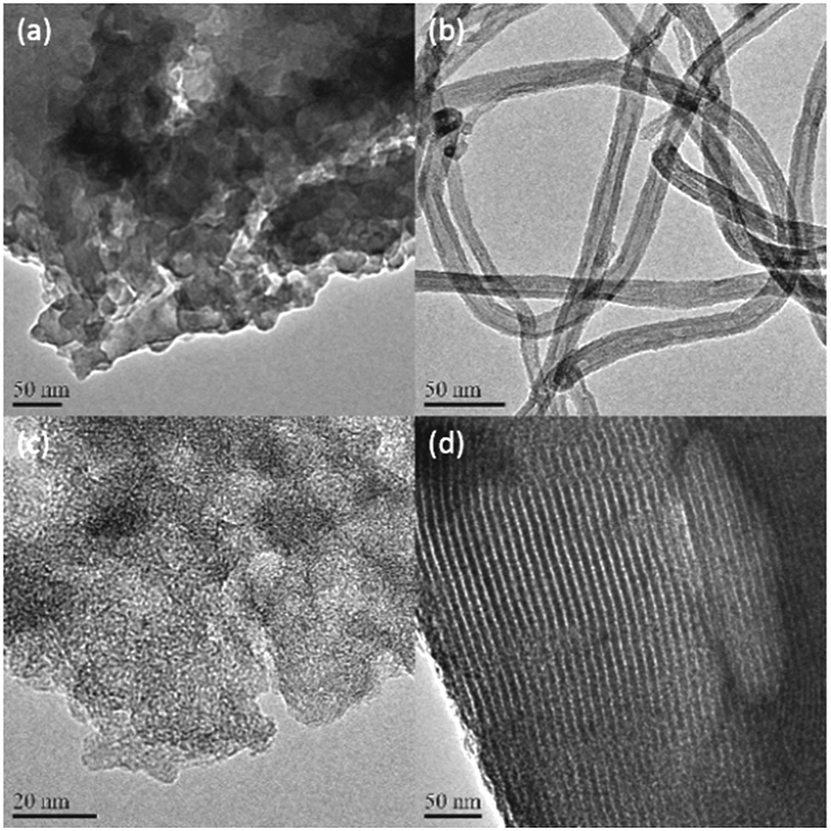 | ||
| Fig. 1 TEM images of Sglu (a), SCNT (b), SAC (c) and SCMK (d). | ||
Table 1 listed the BET specific surface area (SSA) and the pore size distribution information for the selected sulfonated carbon materials. Sglu has very small SSA with nonporous structures as reported in literatures as “sugar catalyst”,29 while SCNT has the biggest total pore volume (Vtotal) and pore width. SAC and SCMK exhibit similar SSA while their pore sizes are quite different. The micro-porosity of SAC reaches 59%, which may bring negative effects on the mass transfer of the reactants. C 1s, O 1s and S 2p XPS signals for the synthesized sulfonated carbon materials were recorded (as shown in Fig. S1†) and the relative contents of these elements were given in Table 1. The element S mainly exists as –SO3H group according to S 2p signal for all the samples, and it is consistent with literature reported results that high temperature refluxing treatment with sulfuric acid would lead to mainly –SO3H functionalization.27 It could also be found that carbon materials, which have higher oxygen content, would get more functionalization (higher S content), since H2SO4 molecules reacted with oxygen-containing functional groups or nearby C–H bonds easier than conjugated C![[double bond, length as m-dash]](https://www.rsc.org/images/entities/char_e001.gif) C bonds.
C bonds.
| Carbon materials | Pore structure | XPS at% | –SO3H content (mmol g−1) | ||||||
|---|---|---|---|---|---|---|---|---|---|
| SSA (m2 g−1) | Vtotal (cm3 g−1) | AAPW (nm) | Microporosity (%) | Mesoporosity (%) | C 1s | O 1s | S 2p | ||
| Sglu | 1 | 0 | — | — | — | 77.8 | 20.9 | 1.27 | 0.97 |
| SCNT | 287 | 1.46 | 21.4 | 2.7 | 80.8 | 95 | 4.77 | 0.27 | 0.22 |
| SAC | 837 | 0.57 | 3 | 59 | 35.8 | 89.7 | 9.82 | 0.48 | 0.38 |
| SCMK | 814 | 0.9 | 4.7 | 17 | 83 | 88 | 11.3 | 0.66 | 0.52 |
It has been generally accepted that the ID1/IG value coming from Raman measurements actually reflects the ordered degree of carbon materials, namely the relative content of sp2 hybridized conjugated structure.30,31 The Raman signal (as shown in Fig. S2†) of the proposed carbon materials was deconvoluted into five peaks following the literature reported strategy.31 All the samples exhibited relatively high intensity of D1 peaks (the ID1/IG values are over 2.3), meaning that there are large amount of functional groups or other kinds of defects on carbon surface, which may contribute to the catalytic activity. No obvious changes of the ID1/IG values are observed after sulfonation, indicating that their basic carbon skeletons keep almost the same during sulfonation process, which is consistent with TEM observations.
3.2 Identification and quantification of the active sites for hydration reactions
Hydration of phenylacetylene (PA) was selected to test the acidic catalytic activity of carbon materials. The reaction was performed under relatively gentle conditions at 120 °C, and the carbon catalysts exhibit negligible structural damage during the reaction process according to the TEM and Raman measurements on the used catalysts. The conversion of PA as a function of the oxygen and sulfur contents of various sulfonated carbon materials are summarized in Fig. 2. The only product for the reaction is determined as acetophenone, and the selectivity for all the tested carbon catalysts are over 99%. Sglu exhibited the highest apparent catalytic activity, while SAC has the lowest in PA hydration reactions. Except for SAC, the conversion of PA exhibits a positive dependence on both O and S content on carbon catalysts, indicating that carboxylic acid or sulfonic acid groups may serve as active sites for the hydration reaction. The main reason for the relatively low catalytic activity of SAC may be attributed to its large content of micropores (microporosity reaches 59%), and the reactant was hindered to access the catalytic active sites.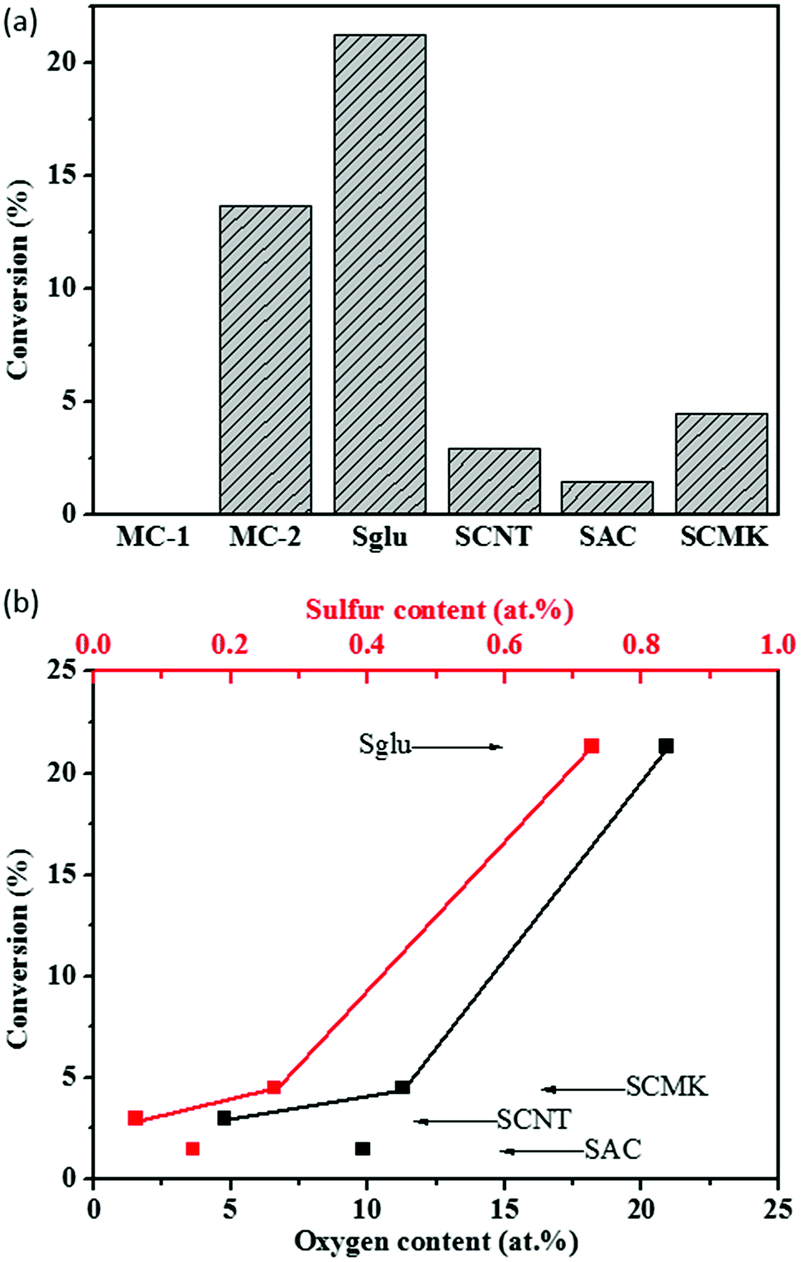 | ||
| Fig. 2 (a) Performance of various catalysts (model molecular catalysts: MC-1 and MC-2 and the synthesized sulfonated carbon materials (Sglu, SCNT, SAC and SCMK)) in PA hydration reactions. (b) PA conversion relating to oxygen or sulphur content on carbon catalysts. Reaction conditions: 100 mg catalysts, 1 ml PA and 1.8 ml H2O, 120 °C, 6 hours (MC-1, MC-2 and Sglu) or 24 hours (SCNT, SAC and SCMK). | ||
It is reported that hydration of PA is an acid catalyzed reaction,32 and in that case carboxylic acid and sulfonic acid groups on carbon materials may serve as the active sites for the reaction. Control experiments with small model molecular catalysts reveal that 4-hydroxyl benzenesulfonic acid (MC-2) have shown observable catalytic activity (PA conversion at 13.7%), while 4-nitrobenzoic acid (MC-1) exhibited almost no reactivity in PA hydration reaction (as shown in Fig. 2a), indicating that carboxylic acid may not have enough acidity, and sulfonic acid group may be the only active sites for the reaction. The S content in MC-2 (5.89%) is higher while the catalytic reactivity of MC-2 is lower than that of Sglu (1.27%), because the hydroxyl groups (as electron donor) may weaken the acidity of –SO3H on MC-2. There are several reported characterization methods to quantify –SO3H groups on carbon materials.33 Here we choose the cation exchange strategy. In a typical measurement, the protons from –SO3H groups were replaced by Na+ (as shown in the following chemical equation (eqn (2))), and the slight solution pH change was monitored to quantify –SO3H groups on carbon materials in liquid phase.33 The detailed cation exchange process could be found in experimental section, and the measured results are also compared with that from S 2p XPS measurements under vacuum.
| –SO3H + NaCl = –SO3Na + HCl | (2) |
The unsulfonated and sulfonated samples were treated via cation exchange process, and the pH values and calculated H+ concentrations were listed in Table 2. Blank experiment with water and NaCl but no carbon materials showed weak acidity, which was caused by dissolution in water of CO2. The H+ concentration of unsulfonated samples are close to the blank experiment, but much lower than that of sulfonated samples. The control experiment results have shown that the statistically significant changes in pH are mainly due to –SO3H groups, and –COOH groups may not exchange cations with NaCl, which is also consistent with literature reported observations.33 It was observed that the sulfonated carbon materials recycled after cation exchange process exhibited no catalytic activity in PA hydration reactions, suggesting that the –SO3H groups were fully poisoned by Na+ cations, and the calculated –SO3H contents from ion exchange process are reliable. As shown in Tables 1 and 2, the contents of –SO3H groups on all the synthesized carbon materials (SCNT, SAC, SCMK and Sglu) measured by these two methods (cation exchange and XPS) exhibit the same trend (relative content) despite slight difference in the absolute value. This variation may come from the different quantification environments. XPS are performed on solid–gas interface under vacuum, while cation exchange measurements are performed in liquid (aqueous) phase. Considering the selected PA hydration reaction was also performed in liquid phase, the sulfonic acid contents measured via cation exchange are more accurate than via XPS to describe the active sites.
| Carbon materials | pH | H (mmol l−1) | –SO3H content (mmol g−1) |
|---|---|---|---|
| Blank | 5.71 | 0.0019 | — |
| glu | 5.25 | 0.0056 | — |
| Sglu | 2.74 | 1.82 | 0.73 |
| oCNT | 4.92 | 0.0120 | — |
| SCNT | 3.81 | 0.15 | 0.06 |
| AC | 5.97 | 0.0011 | — |
| SAC | 3.44 | 0.36 | 0.14 |
| CMK | 4.75 | 0.0178 | — |
| SCMK | 3.18 | 0.66 | 0.26 |
All four kinds of unsulfonated carbon materials exhibited no catalytic activity. In order to further identify the active sites, –SO3H groups were partially removed from Sglu via thermal treatment at 250 °C or 300 °C for 30 minutes. As shown in Fig. 3, the hydration catalytic activity exhibits positive linear dependence on the surface concentration of –SO3H groups, indicating that –SO3H groups may serve as the only active sites for the reaction.
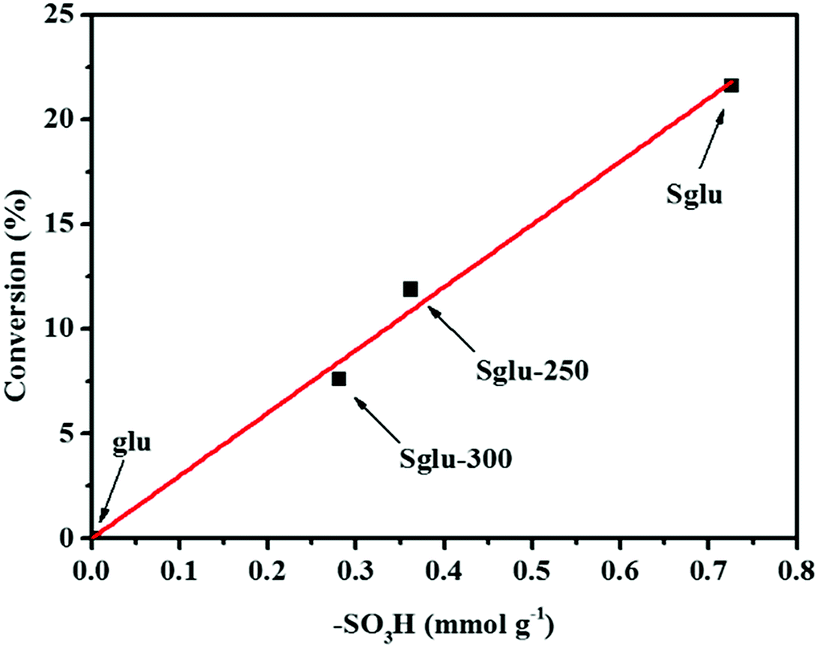 | ||
| Fig. 3 Catalytic reactivity of glu, Sglu and Sglu as a function of –SO3H contents. Reaction conditions: 100 mg catalysts, 1 ml PA and 1.8 ml H2O, 120 °C, 6 hours. –SO3H contents are measured via cation exchange-titration process. | ||
3.3 Kinetics and activity comparison for carbon catalysts in hydration reactions
We choose Sglu and SCNT as two typical carbon materials (representing amorphous and graphitic carbon, respectively) to study the reaction kinetics of PA hydration. As shown in Fig. 4, PA conversion and the value of ln(Ct/C0) for the hydration reaction under the catalysis of Sglu and SCNT are plotted versus the reaction time, where C0 and Ct represents the initial concentration and the concentration of reactant PA at time t, respectively. The linear dependence of ln(Ct/C0) on the reaction time suggests that the reaction follows pseudo-first-order kinetics, since there is large excess of H2O in the reaction system. The reaction rate equation (eqn (3)) below could be applied to describe the basic kinetics of the carbon catalyzed PA hydrations under given reaction conditions:| ln(Ct/C0) = −kt | (3) |
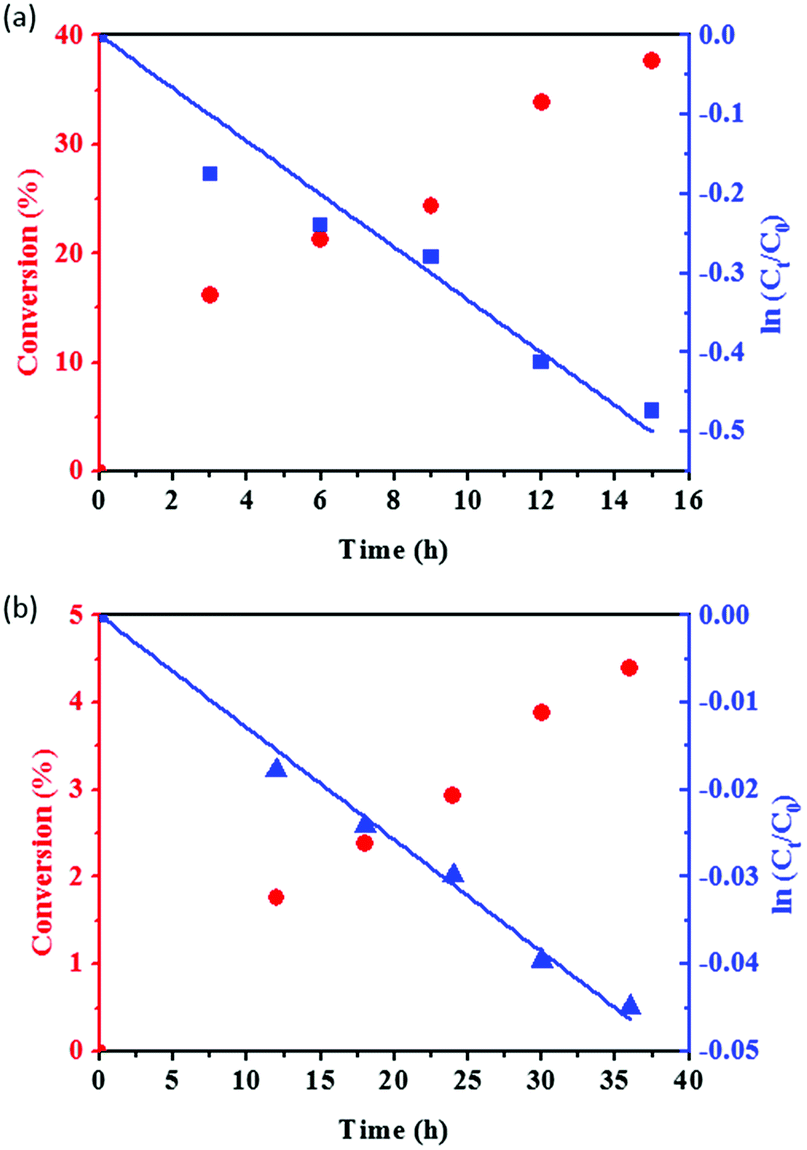 | ||
| Fig. 4 PA conversion and the value of ln(Ct/C0) as a function of reaction time for Sglu (a) and SCNT (b) catalysts. Reaction conditions: 100 mg catalysts, 1 ml PA and 1.8 ml H2O, 120 °C. | ||
The first order rate constant k reflects the intrinsic acid catalytic activity for given carbon catalysts. The kinetic analysis results suggest that Sglu exhibits higher intrinsic catalytic activity than SCNT (one order of magnitude higher k value, 3.34 × 10⁻² h−1 vs. 1.29 × 10⁻³ h−1). Based on Arrhenius equation (k = Ae−Ea/RT), the rate constant k is mainly affected by two factors, namely the frequency factor (A) and the activation energy (Ea) under a given reaction temperature. The physicochemical meaning of the frequency factor is the probability of the activated substrates, and which is closely related to the number of the active sites on the catalysts.34 In the present case, the quantity of the active sites (–SO3H groups) on Sglu is over 10 times higher than that on SCNT catalysts (0.73 mmol g−1 vs. 0.06 mmol g−1), and the Ea for Sglu is also slightly lower than that for SCNT (107.2 vs. 110.6 kJ mol−1, as shown in Fig. S3†). Both of these two factors are consistent with the higher rate constant of Sglu.
The catalytic hydration reaction mechanism could be summarized as Scheme 1.35 PA molecule firstly reacted with protons (H+ from acid catalysts) forming vinyl cation intermediate, and then oxygen atom from H2O was bonded to the carbon cation sites. After the desorption of one proton, enol structure formed and then rearranged to the final product of ketones. The first step is recognized as the rate determining step for the hydration reaction (as shown in Scheme 1), indicating that the activation energy (Ea) may depend on the reactivity of H+, namely the acid strength of the catalysts.
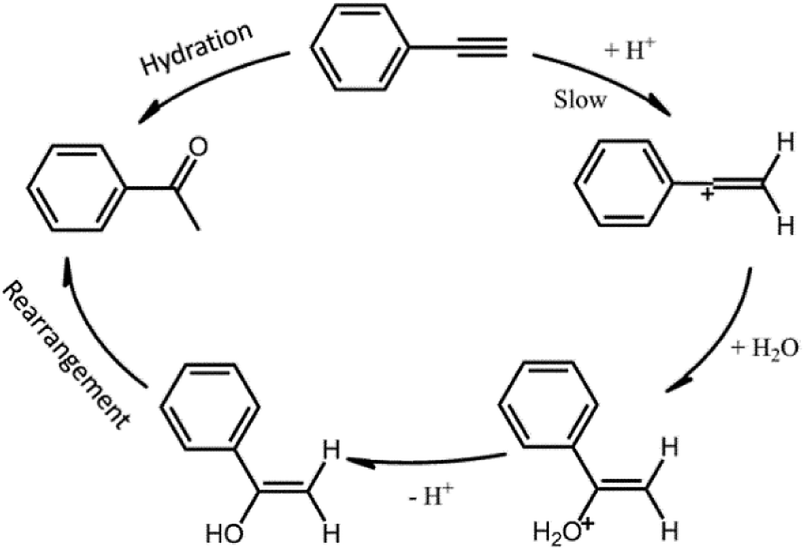 | ||
| Scheme 1 Schematic drawings of the reaction mechanism for PA hydration under the catalysis of Brønsted acid. | ||
As shown in the NH3-TPD profiles (Fig. 5) of Sglu and SCNT, the signals appear at around 200 °C and 270 °C are identified as NH3 molecules desorbed from –COOH and –SO3H sites, respectively. The reliability for the deconvolution strategy was also verified by independent thermal treatment and XPS measurements on Sglu and SCNT. Sglu pre-treated at 200 °C exhibits obviously lower content of carboxylic acid groups, while pre-treatment at 400 °C could remove most of the –COOH and part of the –SO3H groups, indicating the deconvolution and identification of the NH3-TPD signals is reasonable. Independent inert atmosphere-TPD experiments (as shown in Fig. S4†) exhibited that sulfonic acid groups would decompose to SO2 before 380 °C (on SCNT) and 480 °C (on Sglu), respectively, which may be the reason for the undefined NH3 desorption signal beyond 400 °C in Fig. 5. Another possibility for the high temperature desorption of NH3 could be the decomposition of lactams (decomposition at 540–725 °C) that formed via the reaction between NH3 and lactones during the NH3 pre-treatment period.36 As shown in Fig. 5, both the carboxylic acid and sulfonic groups on Sglu exhibit higher NH3 desorption temperature than these functionalities on SCNT, indicating the stronger acidity of Sglu, which is also consistent with its higher intrinsic catalytic activity (reaction rate constant). One of the key reasons for the higher acidity of Sglu could be the large surface content of oxygen functionalities. The surface concentration of oxygen functionalities on Sglu is obviously higher than that on SCNT (over 1000 times higher, 16 mmol m−2 vs. 0.013 mmol m−2). These electron-withdrawing groups may effectively increase the acid strength of carbon materials. For example, the pKa of 4-nitro benzenesulfonic acid is obviously higher than that of benzenesulfonic acid (−3.8 vs. −2.8) due to the introduction of electron-withdrawing nitro groups.
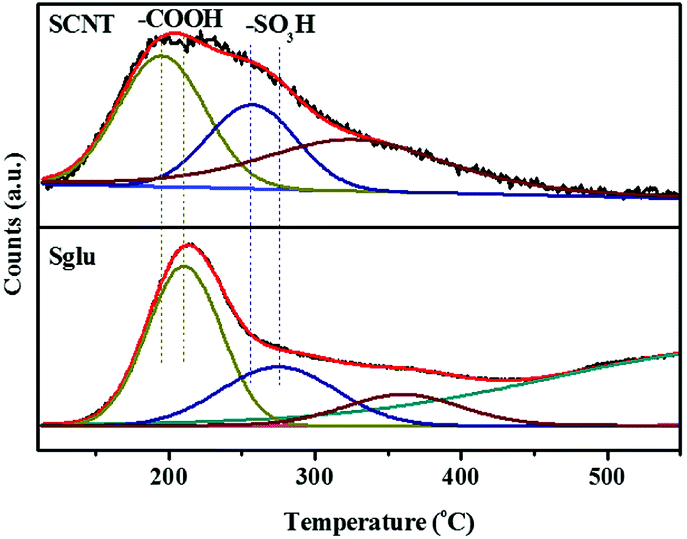 | ||
| Fig. 5 NH3-TPD profiles of Sglu and SCNT and the corresponding peak deconvolution results. | ||
The basic topographic features of the recovered carbon materials (after catalyzing PA hydration reactions) keep almost the same as fresh samples based on TEM images (Fig. S5†) and Raman measurement results (ID1/IG, Fig. S2†). However, XPS measurements on the used catalysts have shown the decrease of the sulfur content after catalytic reactions (from 1.27% to 0.90% on Sglu), indicating the loss of the active sites (Fig. S6 and Table S1†). The intrinsic catalytic activity also drops (conversion rate per active site drops from 2.54 to 0.98 mol-PA mol−1–SO3H h−1), which may be associated with the decrease of oxygen content (from 20.7% to 15.5%) as discussed above. The instability of –SO3H groups in liquid phase may be one of the key reasons for the activity drop during the reuse of the carbon catalysts. This phenomena have also been observed in other independent research results,27,28,37 attributing to the reversibility of the sulfonation process, namely –SO3H groups may transform into sulfuric acid and leach into the reaction system. At the end, we compared the catalytic activity of our synthesized sulfonated carbon materials with other typical PA hydration catalytic reaction systems, as shown in Table 3. The apparent catalytic activity (acetophenone yield) of Sglu is comparable even to the noble-metal catalyst.38 It should be mentioned that carbon catalysts are used in the absence of organic solvents or any other additives, and that could be easily recovered via filtration method, indicating their potential in practical applications.
| Catalyst | Solvent | Acidic additive | Reaction temperature | Time | Acetophenone yield | First order rate constant |
|---|---|---|---|---|---|---|
| Sglu | H2O | — | 120 °C | 6 h | 21.3% | k = 0.0334 h−1 |
| H2SO4 (ref. 35) | H2O | — | 45 °C | — | — | k = 0.1757 h−1 |
| Au-complex38 | Methanol, H2O | AgOTf | 80 °C | 2 h | 27% | — |
| CF3SO3H (ref. 10) | CF3CH2OH | — | 25 °C | 45 h | 100% | — |
| FeCl3 (ref. 9) | 1,2-Di-chloroethane | — | 80 °C | 67 h | 19% | — |
4. Conclusions
In conclusion, we have shown in the present research paper that glucose-derived carbon (glu), carbon nanotube (CNT), activated carbon (AC) and ordered mesoporous carbon (CMK) was successfully sulfonated via refluxing with concentrated sulfuric acid. These sulfonated carbon materials exhibit acceptable catalytic activity in PA hydration reactions, and the sulfonate groups are recognized as the active sites for the reaction. The quantity of the active sites could be revealed via cation exchange in liquid phase or XPS measurements under vacuum. These two methods exhibit the same trend in the surface content of active sites. The kinetic study suggests that carbon catalyzed PA hydration reactions follow pseudo first order model due to the excess usage of H2O. Sglu exhibits higher intrinsic catalytic activity (first order rate constant k) than SCNT, because it has both higher acidity and the quantity of the active sites as proved by NH3-TPD and cation exchange experiments. Kinetic analysis combining catalyst structure characterization results suggest that the enrichment of the surface content of electron-withdrawing oxygen groups may be an effective method to increase the acidity of the sulfonated carbon materials. The present research provides the possibility for the applications of carbon materials as acid catalysts, and it also sheds light on the rational design of carbon materials with high acidity using these basic and simple structure–function relations.Conflicts of interest
There are no conflicts to declare.Acknowledgements
The authors acknowledge financial support from the NSFC of China (21573256, 21761132010, 91645114, and 51521091, 21571035), and the Youth Innovation Promotion Association, CAS.Notes and references
- L. Hintermann and A. Labonne, Synthesis, 2007, 8, 1121–1150 CrossRef.
- L. Xu, L.-M. Yang and E. Ganz, Theor. Chem. Acc., 2018, 137, 98 Search PubMed.
- J.-H. Liu, L.-M. Yang and E. Ganz, ACS Sustainable Chem. Eng., 2018, 6(11), 15494–15502 Search PubMed.
- J. Halpern, B. James and A. Kemp, J. Am. Chem. Soc., 1961, 83, 4097–4098 CrossRef CAS.
- B. R. James and G. Rempel, J. Am. Chem. Soc., 1969, 91, 863–865 CrossRef CAS.
- K. Imi, K. Imai and K. Utimoto, Tetrahedron Lett., 1987, 28, 3127–3130 CrossRef CAS.
- S.-J. Lai, D. Yang, Y.-Q. Li, X.-L. Zhao, Y. Lu and Y. Liu, Eur. J. Inorg. Chem., 2015, 8, 1408–1416 CrossRef.
- S. Sanz, L. A. Jones, F. Mohr and M. Laguna, Organometallics, 2007, 26, 952–957 CrossRef CAS.
- J. R. Cabrero-Antonino, A. Leyva-Perez and A. Corma, Chem.–Eur. J., 2012, 18, 11107–11114 CrossRef CAS PubMed.
- W. Liu, H. Wang and C. J. Li, Org. Lett., 2016, 18, 2184–2187 CrossRef CAS PubMed.
- W. Qi and D. Su, ACS Catal., 2014, 4, 3212–3218 CrossRef CAS.
- B. Frank, R. Blume, A. Rinaldi, A. Trunschke and R. Schlögl, Angew. Chem., Int. Ed., 2011, 50, 10226–10230 CrossRef CAS PubMed.
- A. Primo, F. Neatu, M. Florea, V. Parvulescu and H. Garcia, Nat. Commun., 2014, 5, 5291 CrossRef CAS PubMed.
- X. Li, X. Pan, L. Yu, P. Ren, X. Wu, L. Sun, F. Jiao and X. Bao, Nat. Commun., 2014, 5, 3688 CrossRef CAS PubMed.
- P. Serp, M. Corrias and P. Kalck, Appl. Catal., A, 2003, 253, 337–358 CrossRef CAS.
- F. Rodriguez-Reinoso, Carbon, 1998, 36, 159–175 CrossRef CAS.
- R. Schlögl, in Advance in Catalysis, ed. B. C. Gates and F. C. Jentoft, 2013, vol. 56, pp. 103–185 Search PubMed.
- W. Qi, W. Liu, B. Zhang, X. Gu, X. Guo and D. Su, Angew. Chem., Int. Ed., 2013, 52, 14224–14228 CrossRef CAS PubMed.
- W. Qi, W. Liu, X. Guo, R. Schlögl and D. Su, Angew. Chem., Int. Ed., 2015, 54, 13682–13685 CrossRef CAS PubMed.
- X. Guo, W. Qi, W. Liu, P. Yan, F. Li, C. Liang and D. Su, ACS Catal., 2017, 7, 1424–1427 CrossRef CAS.
- G. Wen, S. Wu, B. Li, C. Dai and D. S. Su, Angew. Chem., Int. Ed., 2015, 54, 4105–4109 CrossRef CAS PubMed.
- A. Onda, T. Ochi and K. Yanagisawa, Green Chem., 2008, 10, 1033–1037 RSC.
- E. Lam and J. H. T. Luong, ACS Catal., 2014, 4, 3393–3410 CrossRef CAS.
- I. Matos, P. D. Neves, J. E. Castanheiro, E. Perez-Mayoral, R. Martin-Aranda, C. Duran-Valle, J. Vital, A. M. Botelho do Rego and I. M. Fonseca, Appl. Catal., A, 2012, 439–440, 24–30 CrossRef CAS.
- M. M. Antunes, P. A. Russo, P. V. Wiper, J. M. Veiga, M. Pillinger, L. Mafra, D. V. Evtuguin, N. Pinna and A. A. Valente, ChemSusChem, 2014, 7, 804–812 CrossRef CAS PubMed.
- T. Atsushi, T. Masakazu, O. Mai, K. N. Junko, D. Kazunari, H. Shigenobu and H. Michikazu, Nature, 2005, 438, 178 CrossRef PubMed.
- J. M. Anderson, R. L. Johnson, K. Schmidt-Rohr and B. H. Shanks, Carbon, 2014, 74, 333–345 CrossRef CAS.
- J. M. Anderson, R. L. Johnson, K. Schmidt-Rohr and B. H. Shanks, Catal. Commun., 2014, 51, 33–36 CrossRef CAS.
- M.-H. Zong, Z.-Q. Duan, W.-Y. Lou, T. J. Smith and H. Wu, Green Chem., 2007, 9, 434–437 RSC.
- K. M. Daniels, B. K. Daas, N. Srivastava, C. Williams, R. M. Feenstra, T. S. Sudarshan and M. V. S. Chandrashekhar, Mater. Sci. Forum, 2012, 717–720, 661–664 CAS.
- A. Sadezky, H. Muckenhuber, H. Grothe, R. Niessner and U. Pöschl, Carbon, 2005, 43, 1731–1742 CrossRef CAS.
- L. Chen and C. J. Li, Adv. Synth. Catal., 2006, 348, 1459–1484 CrossRef CAS.
- I. Ogino, Y. Suzuki and S. R. Mukai, ACS Catal., 2015, 5, 4951–4958 CrossRef CAS.
- B. Wang, G. Wen and D. Su, Nano Res., 2017, 10, 2954–2965 CrossRef CAS.
- D. S. Noyce and M. D. Schiavelli, J. Am. Chem. Soc., 1968, 90, 1020–1022 CrossRef CAS.
- K. Friedel Ortega, R. Arrigo, B. Frank, R. Schlögl and A. Trunschke, Chem. Mater., 2016, 28, 6826–6839 CrossRef CAS.
- D. S. Su, G. Wen, S. Wu, F. Peng and R. Schlögl, Angew. Chem., Int. Ed., 2017, 56, 936–964 CrossRef CAS PubMed.
- S.-J. Lai, Y.-Q. Li, H. Zhang, X.-L. Zhao and Y. Liu, Catal. Commun., 2015, 58, 169–173 CrossRef CAS.
Footnote |
| † Electronic supplementary information (ESI) available. See DOI: 10.1039/c8ra07966h |
| This journal is © The Royal Society of Chemistry 2018 |