 Open Access Article
Surface modified Li4Ti5O12 by paper templated approach for enhanced interfacial Li+ charge transfer in Li-ion batteries†
Ujjwala V. Kawadea,
Manish S. Jayswala,
Anuradha A. Ambalkara,
Sunil R. Kadamb,
Rajendra P. Panmand a,
Jalinder D. Ambekara,
Milind V. Kulkarni*a and
Bharat B. Kale
 *a
*a
aCentre for Materials for Electronics Technology (C-MET), Ministry of Electronics and Information Technology (MeitY), Panchavati, Pune 411008, India. E-mail: bbkale@cmet.gov.in; milind@cmet.gov.in
bDepartment of Physics, Savitribai Phule Pune University, Ganeshkhind, Pune 411007, India
First published on 14th November 2018
Abstract
The Li4Ti5O12 (LTO) and lithium silicate (LS) surface modified LTO have been demonstrated by a unique paper templated method. Comparative study of structural characterization with electrochemical analysis was demonstrated for pristine and modified Li4Ti5O12. Structural and morphological study shows the existence of the cubic spinel structure with highly crystalline 250–300 nm size particles. The LS modified LTO shows the deposition of 10–20 nm sized LS nanoparticles on cuboidal LTO. Further, X-ray photoelectron spectroscopy (XPS) confirms the existence of Li2SiO3 (LS) in the modified LTO. The electrochemical performance was investigated by cyclic voltammetry (CV), electrochemical impedance spectroscopy (EIS) and galvanostatic charge–discharge. The modified LTO with 2% LS (LTS2) exhibited excellent rate capability compare to pristine LTO i.e. 182 mA h g−1 specific capacity at a current rate, 50 mA g−1 with remarkable cycling stability up to 1100 cycles at a current rate of 800 mA g−1. The lithium ion full cell of modified LTO with LS as an anode and LiCoO2 as a cathode exhibited a remarkably reversible specific capacity i.e. 110 mA h g−1. Both electronic and ionic conductivities of pristine LTO are observed to be enhanced by incorporation of appropriate amount of LS in LTO due to a larger surface contact at the interface of electrode and electrolyte. More significantly, the versatile paper templated synthesis approach of modified LTO with LS provides densely packed highly crystalline particles. Additionally, it exhibits lower Warburg coefficient and higher Li ion diffusion coefficient which in turn accelerate the interfacial charge transfer process, which is responsible for enhanced stable electrochemical performance. The detailed mechanism is expressed and elaborated for better understanding of enhanced electrochemical performance due to the surface modification.
1. Introduction
Graphite has been widely used as a common anode material for lithium ion batteries (LIBs) but it possesses some demerits such as, some graphite material peel off from the current collector during lithiation/delithiation of Li-ions. At high rate Li-ion diffusion in graphite is low and the charge/discharge potential around 0.1 V (vs. Li/Li+) hence Li dendrites formation take place in graphite which reduces the electrochemical performance and also generate safety issues. These combined limitations restrict the application of graphite in LIBs.1–3 Lithiation and delithiation ability of lithium titanium oxide was first reported by Murphy et al. in 1983.4 Recently many reports have signified enormous attention on Li4Ti5O12 (LTO) as an excellent anode material for LIBs. LTO is considered to be the most suitable anode material in LIBs for energy storage due to some excellent electrochemical properties, such as a stable and high voltage plateau of 1.5 V vs. Li/Li+, high safety, high rate capability, long cycling performance and ease of synthesis. Lithiated LTO's higher potential versus lithium makes it more stable and safer than lithiated graphite, due to a reduction in the driving force for lithium dendrite formation. The LTO has excellent reversibility and long stable cyclability in LIBs due to negligible volume expansion during intercalation/deintercalation of Li ions.5–10 Especially LTO has a “zero-strain” structure during charge and discharge processes in the lithium ion battery applications.10–12 The LTO has cubic crystal structure with Fd![[3 with combining macron]](https://www.rsc.org/images/entities/char_0033_0304.gif) m space group, where O2− is located at 32e sites, 3/4 of Li+ is located at tetrahedral 8a sites and the rest of Li+ with Ti4+ is located at octahedral 16d sites with a unit cell parameter of 0.836 nm. The reaction mechanism with lithiation and delithiation during electrochemical reaction has been reported.12,13
m space group, where O2− is located at 32e sites, 3/4 of Li+ is located at tetrahedral 8a sites and the rest of Li+ with Ti4+ is located at octahedral 16d sites with a unit cell parameter of 0.836 nm. The reaction mechanism with lithiation and delithiation during electrochemical reaction has been reported.12,13
At counter electrode,
| Li ⇌ xLi + xe− | (1) |
Intercalation at LTO working electrode,
| 3Li+ + 3e− + Li4Ti5O12 ⇌ Li7Ti5O12 | (2) |
Even at zero-strain, during reaction LTO has some intrinsic kinetics drawbacks because of its low electrical conductivity (ca. 10−8 to 10−13 S cm−1)14,15 and low lithium diffusion coefficient (ca. 10−9 to 10−16 cm2 s−1),16 which limits its rate capacity. Efforts have been devoted to enhance the specific capacity by improving the electronic conductivity as well as ionic conductivity via surface modifications within LTO. Diverse modifications in LTO were carried out by doping of metal and non-metals, coating with carbonaceous materials (carbon, graphene, CNT), size reduction up to nano-regime and composite strategies.14,17–30 The fundamental thought behind these modifications is that to increase anion adsorption, electronic conductivity, and decrease the polarization and ionic energy barrier. This modification to enhance interfacial charge transfer involves both lithium ions and electrons which ultimately enhance the electrochemical performance. However, these improvements are marginal to satisfy the high rate capability demanded by electric vehicles.
To avoid the gassing behaviour and to reduce adverse interfacial side reactions of active materials, chemically inert substances were used for surface modifications on electrode.15,31 But due to the lower electronic and ionic conductivities of the coating materials, the electrochemical performance of LTO is still an inadequate. Therefore, choosing proper chemically inert coating substances to improve conductivity is necessary to enhance the electrochemical performance of the LTO. Most of the researchers have reported surface modification of cathode and anode using solid electrolytes which displayed outstanding lithium ion conduction and effectively improved electrochemical performance.31–38 Many researchers have synthesized LTO using different synthesis approach to address the effect of surface modification to enhance the electrochemical performance. Also, efforts have been taken to find more effective surface modifier to enhanced capacity with stability. Recently, Li4Ti5O12 surface was modified with TiO2, SiO2, TiO2–SiO2 and Li2SiO3 etc. via solvothermal/hydrothermal followed by annealing, sol–gel method, cellulose-assisted combustion technique and emulsion system.16,19,23,27 Among these as a surface modifying agent, Li2SiO3 has recently attracted as a coating for anode materials due to its high ionic conductivity. It acts as a Li+-ion conductor to enhance the ionic conductivity for anode as well as cathode materials for LIBs.15,19,39 Li2SiO3 acts as a most excellent surface modifier because it gives stability to the electrode materials and avoids the side reactions and giving more Li+ ions during lithiation/delithiation processes which accelerates the capacity.39
The voltage of LTO batteries lower than graphite batteries. But cubic spinel LTO anode has a three orders of magnitude lower risk of short circuiting than commercial graphite anodes which is confirmed by short circuit abuse tests (ISCAT).40,41 Therefore, as a potential anode for LIBs, the LTO electrode has been used efficiently in batteries. Jansen et al.42 reported a full cell of LTO with a LiCoO2 as a cathode material with its cycling performance up to 117![[thin space (1/6-em)]](https://www.rsc.org/images/entities/char_2009.gif) 000. Then, the compatibility of LTO anode with layered LiCoO2 and its hybrids materials have been studied to ensure the electrochemical performance at around 2.5 V. Additionally, the LTO anode with a layered type LiCoO2 cathode in full cell exhibits higher energy density than its hybrids materials such as LiNi1/3Co1/3, Mn1/3O2 and LiMn2O4 cathodes.
000. Then, the compatibility of LTO anode with layered LiCoO2 and its hybrids materials have been studied to ensure the electrochemical performance at around 2.5 V. Additionally, the LTO anode with a layered type LiCoO2 cathode in full cell exhibits higher energy density than its hybrids materials such as LiNi1/3Co1/3, Mn1/3O2 and LiMn2O4 cathodes.
Thus, based on the our earlier report,43 we have demonstrated pristine Li4Ti5O12 and surface modified nanocomposites of Li4Ti5O12 with lithium silicate (Li2SiO3) by the whatman paper mediated template method as an anode material for lithium-ion batteries. Li4Ti5O12, modification with Li2SiO3 has been carried out by in situ synthesis method for the first time. The comparative study of structural characterization with electrochemical analysis was demonstrated for pristine and modified Li4Ti5O12. The modified anode composite exhibits significant enhancement in the specific capacity and rate capability for high-performance lithium-ion batteries. After evaluation of the electrochemical performances of all LTO electrodes in half-cell assembly, its full cells has been fabricated and electrochemical performance has been demonstrated.
2. Experimental methods
2.1 Material preparation
All the reagents were analytical pristine grade and used without further purification. Li4Ti5O12 anode materials were synthesized by a versatile template method according to our previous work.43 Stoichiometric amounts of lithium acetate (LiAc·2H2O, 99.0%, Aldrich) and tetraethyl orthotitanate (Ti(OC2H5)4, 99%, Aldrich) were dissolved in anhydrous ethanol. Nitric acid was added to avoid the precipitation of tetraethyl orthotitanate. After dissolved completely, the stoichiometric amount of tetraethyl orthosilicate (Si(OC2H5)4, Aldrich) was added drop-wise in the above solution under continuous stirring. The mixture was magnetically stirred for 30 min to obtain homogeneous mixing. The above solution was impregnated in the ash less Whatman filter paper and dried at room temperature. The papers were calcined at 300 °C for 3 h in air. After calcination, the powders were ground again to fine powders and followed by sintering at 900 °C for 4 h. Heating rate was kept constant at 5 °C min−1 for all processes during the synthesis. For fabricating surface modified Li4Ti5O12, the Si(OC2H5)4 solution was added i.e. silicate accounting for 1, 2 and 3 wt% in the mixture, and the products are assigned to LTS1, LTS2 and LTS3 in order. To get the pristine Li4Ti5O12 anode material the same synthesis process without addition of Si(OC2H5)4 was used and the product is named as PLTO.2.2 Material characterization
The crystal structures of the Li4Ti5O12 anode nanostructures were examined with powder X-ray diffraction technique (XRD, Bruker Advanced D8) using Cu Kα radiation source. The morphological and micro-structural analysis of as-synthesized Li4Ti5O12 nanostructures were investigated with field emission scanning electron microscopy (FESEM, Hitachi, S-4800) and field emission transmission electron microscopy (FETEM by JEOL; JEM-2200FS). The surface chemical composition was studied with X-ray photoelectron spectroscopy (XPS, Thermo Fisher Scientific Co., Theta Probe). Room temperature micro Raman scattering was performed using a HR 800-Raman Spectroscopy, Horiba JobinYvon, France, with an excitation at 532 nm.2.3 Electrochemical measurements
To perform electrochemical measurements 2032 type coin cells were used. The active material, conducting carbon and polyvinylidene fluoride (PVDF) binder were mixed in a weight ratio of 80![[thin space (1/6-em)]](https://www.rsc.org/images/entities/char_2009.gif) :
:![[thin space (1/6-em)]](https://www.rsc.org/images/entities/char_2009.gif) 10
10![[thin space (1/6-em)]](https://www.rsc.org/images/entities/char_2009.gif) :
:![[thin space (1/6-em)]](https://www.rsc.org/images/entities/char_2009.gif) 10 in N-methyl-2-pyrrolidone (NMP) as a solvent. The prepared slurry was casted onto copper current collector with help of a doctor-blade and kept for drying in vacuum oven for 12 h, at 120 °C, which was further used as a working electrode. After drying under ambient condition, round discs of 16 mm diameter were punched and further dried under vacuum at 120 °C for 12 h. The 2032 coin type half-cells were assembled in an argon-filled glove box, using metallic lithium foil (75 μm in thickness) as the counter and reference electrode, quartz filter paper as the separator, 1 M LiPF6 in ethylene carbonate (EC)
10 in N-methyl-2-pyrrolidone (NMP) as a solvent. The prepared slurry was casted onto copper current collector with help of a doctor-blade and kept for drying in vacuum oven for 12 h, at 120 °C, which was further used as a working electrode. After drying under ambient condition, round discs of 16 mm diameter were punched and further dried under vacuum at 120 °C for 12 h. The 2032 coin type half-cells were assembled in an argon-filled glove box, using metallic lithium foil (75 μm in thickness) as the counter and reference electrode, quartz filter paper as the separator, 1 M LiPF6 in ethylene carbonate (EC)![[thin space (1/6-em)]](https://www.rsc.org/images/entities/char_2009.gif) :
:![[thin space (1/6-em)]](https://www.rsc.org/images/entities/char_2009.gif) dimethyl carbonate (DMC) (1
dimethyl carbonate (DMC) (1![[thin space (1/6-em)]](https://www.rsc.org/images/entities/char_2009.gif) :
:![[thin space (1/6-em)]](https://www.rsc.org/images/entities/char_2009.gif) 1 in volume) (BASF) as the electrolyte, and the round discs as working electrodes. Lithium cobalt oxide (LCO, MTI Corp.) slurry were prepared by mixing the active material, conducting carbon and Polyvinylidene fluoride (PVDF) binder were mixed in a weight ratio of 80
1 in volume) (BASF) as the electrolyte, and the round discs as working electrodes. Lithium cobalt oxide (LCO, MTI Corp.) slurry were prepared by mixing the active material, conducting carbon and Polyvinylidene fluoride (PVDF) binder were mixed in a weight ratio of 80![[thin space (1/6-em)]](https://www.rsc.org/images/entities/char_2009.gif) :
:![[thin space (1/6-em)]](https://www.rsc.org/images/entities/char_2009.gif) 10
10![[thin space (1/6-em)]](https://www.rsc.org/images/entities/char_2009.gif) :
:![[thin space (1/6-em)]](https://www.rsc.org/images/entities/char_2009.gif) 10 in N-methyl-2-pyrrolidone (NMP) as a solvent. The prepared slurry was casted onto aluminum current collector and kept for drying in vacuum oven for 12 h, at 120 °C, which further used as a cathode electrode. The 2032 type full cells were prepared by using LCO/LTO (LTS2) electrode. Their electrochemical measurements (galvanostatic charge–discharge tests) were carried out on MTI make battery analyzer (vs. Li/Li+) at room temperature. Cyclic voltammetry behaviour of the half cells was tested on the Autolab potentiostat/galvanostatic instruments (Metrohm Autolab) between 1 V to 2.5 V with scan rate of 0.2 mV s−1. Electrochemical impedance spectroscopy was performed using amplitude of 5 mV with a frequency range from 0.1 Hz to 1 MHz.
10 in N-methyl-2-pyrrolidone (NMP) as a solvent. The prepared slurry was casted onto aluminum current collector and kept for drying in vacuum oven for 12 h, at 120 °C, which further used as a cathode electrode. The 2032 type full cells were prepared by using LCO/LTO (LTS2) electrode. Their electrochemical measurements (galvanostatic charge–discharge tests) were carried out on MTI make battery analyzer (vs. Li/Li+) at room temperature. Cyclic voltammetry behaviour of the half cells was tested on the Autolab potentiostat/galvanostatic instruments (Metrohm Autolab) between 1 V to 2.5 V with scan rate of 0.2 mV s−1. Electrochemical impedance spectroscopy was performed using amplitude of 5 mV with a frequency range from 0.1 Hz to 1 MHz.
3. Results and discussion
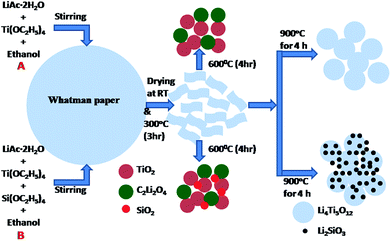
The detailed phase formation mechanism for PLTO and modified LTO composite nanomaterials, via versatile paper template method schematically illustrated in Fig. 1. The ethanolic solution lithium acetate, tetraethyl orthotitanate and tetraethyl orthosilicate was absorbed in the Whatman paper and dried at 80 °C and further calcined at 300 °C. During calcination, Ti(OH)4 and Si(OH)4 slowly condensed into amorphous TiO2 and SiO2. Then this powder was grinded in pestle mortar for homogenization of intermediates formed and further used for next steps.| 4C2H3LiO2·2H2O + 5Ti(OC2H5) → 5TiO2 + 2C2Li2O2 | (3) |
| 5TiO2 + 2C2Li2O4 → Li4Ti5O12 + CO2 | (4) |
| 4C2H3LiO2·2H2O + Si(OC2H5)4 + 5Ti(OC2H5)4 → 5TiO2 + 2C2Li2O4 + SiO2 | (5) |
| 5TiO2 + 3C2Li2O4 + SiO2 → Li4Ti5O12 + Li2SiO3 + nCO2 | (6) |
When calcined at 600 °C for 4 h, titanium oxide (TiO2) and lithium oxalate (C2Li2O4) phase formation take place as per reaction 3. Further as per reaction 4, the TiO2 react with C2Li2O4 and form the Li4Ti5O12 at 800 °C (Fig. 1A). Fig. S1 in ESI† shows the X-ray diffraction patterns of samples calcined at 600, 700 and 800 °C. However, at 800 °C, the LTO crystal grows at [400] direction instead of [111] plane. For LIBs, Li4Ti5O12 spinel structure is essential with the unit cell parameter 0.836 nm for a “zero strain effect”. Thus, final sintering of intermediates at 900 °C for 4 h has been performed to accelerate the growth of [111] plane for cubic spinel structure. For surface modification, along with LTO precursor's tetraethyl orthosilicate was also added. Hence, along with TiO2 and C2Li2O4, formation of SiO2 is also taking place at 600 °C. Since, the concentration of SiO2 is very less and due to amorphous state, XRD peaks are not detected. When the sintering was carried out for surface modified samples, SiO2 reacts with C2Li2O4 and formation of Li2SiO3 take place along with LTO at 900 °C as per the eqn (6) (Fig. 1B).
Fig. 2 shows the X-ray diffraction patterns of synthesized Li4Ti5O12 (PLTO) and silicate modified Li4Ti5O12 (LTS1, LTS2, LTS3) with varying Si(OC2H5)4 concentration. The pristine Li4Ti5O12 shows formation of highly crystalline cubic spinel phase (Fig. 2, PLTO). The silicate modified Li4Ti5O12 prepared with varying the Si(OC2H5)4 concentrations also shows formation of cubic spinel structure. For all samples, there are sharp diffraction peaks at 2θ values of 18.20, 35.59, 43.27, 47.41, 57.19, 62.62, 66.03, 74.4, 75.12 and 79.22 which can be assigned to the [111], [311], [400], [331], [333], [440], [531], [533], [622] and [444] planes of face centered cubic spinel Li4Ti5O12 phase (JCPDS card no. 049-0207). Fig. 2b shows the magnified [111] peak of LTO reveals a slight peak shift to a lower theta. As discussed, silicate precursor was mixed with the precursor of LTO and sintered at 900 °C for 4 h which leads not only to form interface bond, but also confer solid diffusion near the interface between LTO and silicate compound (Li2SiO3). This is due to the large octahedral (1.9854 nm) and tetrahedral (1.9963 nm) interstices in LTO.44 Generally, due to the smaller radius of Si4+ (0.04 nm) than Ti4+ (0.06 nm) and Li+ (0.076 nm), the substitution of Si4+ for Ti4+ or Li+ exhibit lattice shrinkage.16 Thus the lower 2θ shift of diffraction peaks after coating with LS is very likely to be induced the interstitial sites of LTO as similar to F-doped LTO.28 The diffraction peaks of Li2SiO3 are detected in silicate modified Li4Ti5O12. In the silicate modified sample, peak at 27.01 corresponds to [111] plane of the Li2SiO3 phase shown in inset of Fig. 1a (JCPDS card no. 00-029-0829) which is absent in case of PLTO. In XRD, absence of impurity peaks other than LS suggesting the high phase purity of the nanocomposite.
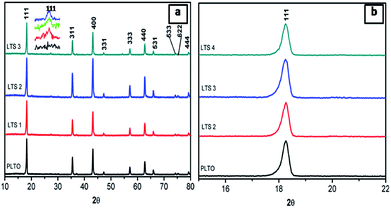 | ||
| Fig. 2 XRD patterns of pristine Li4Ti5O12 (PLTO) and silicate modified Li4Ti5O12 (LTS1, LTS2 and LTS3) samples. | ||
The morphological study of PLTO and the surface modified LTO with Li2SiO3 by FESEM are depicted in Fig. 3a–d. It is observed that both LTO samples possess a well-crystalline structure, suggesting retaining in the morphology of LTO. As shown in Fig. 3a and b several particles are interconnected to form a chain like structure with dense network having diameter in the range of 200–500 nm. When silicon was introduced, the diameter of particles was reduced (Fig. 3b), The LTS2 (2% silicate) indicates the increased the particles linkage and network (Fig. 3c and d). This interconnected network which may be responsible in shortening the transport path of lithium ions and electrons. Overall, with varying silicon concentration, the morphology does not show any significant difference but the formation of denser network is observed (Fig. S2 in ESI†).
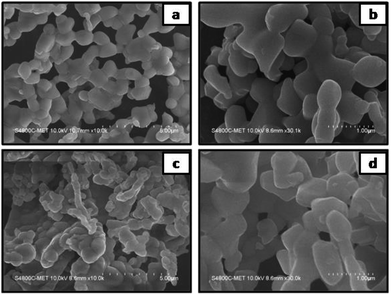 | ||
| Fig. 3 FESEM images of (a and b) pristine Li4Ti5O12 (PLTO) and (c and d) the silicate modified Li4Ti5O12 (LTS2) at low and high magnifications. | ||
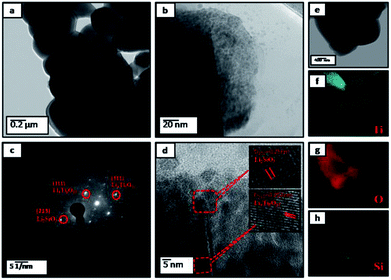
Accordingly, further investigated the surface microstructure of the PLTO and surface modified LTO (2%) using field emission transmission electron microscope (FETEM) has been performed. The low and high resolution FETEM images of PLTO (Fig. 4) and LTS2 (Fig. 5) nanostructures, along with selected area electron diffraction pattern (Fig. 4d and 5c) shows highly crystalline interconnected nanoparticle network. The SAED image shows many bright diffraction spots indicating that the both samples have good crystalline characteristic. The pristine PLTO sample depicts formation of spherical shaped 100–200 nm size particles aligned each other. Fig. 5b shows a uniform distribution of Li2SiO3 nanoparticles having size in the range of 20–30 nm on the surface of LTO. The FETEM of PLTO and LTS2 samples depicts the inter-planar spacing of 0.248 and 0.24 nm corresponds to [101] and [111] plane exhibit spinel structure.
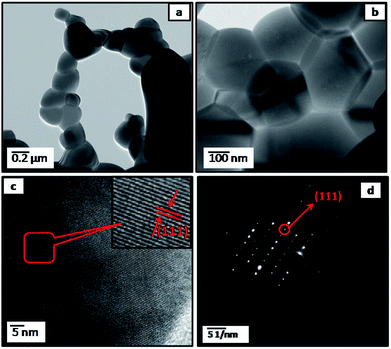 | ||
| Fig. 4 FETEM images of pristine Li4Ti5O12 (PLTO) (a and b) at different magnifications; (c) FETEM of the individual Li4Ti5O12 at high resolution; (d) corresponding SAED patterns. | ||
The silicate modified Li4Ti5O12 (LTS2) was further analyzed using EDS (Fig. 5e–h) for elemental mapping images which demonstrate that all Li2SiO3 nanoparticles homogeneously coated on LTO particles. LTO and LS particles are interconnected and forms interface bond, as well as the solid diffusion near the interface between LTO and LS due to sintering. The silicate nanoparticles prevent the stacking of LTO nanoparticles as well as buffer the expansion volume of Li–Si during cycling.
Further, Raman of pristine LTO and surface modified LTO shows the comparison of their shifting to longer wavelength due to surface modification (Fig. 6a). Raman spectrum shows typical bands located at 673 and 751 cm−1, which correspond to the vibrations of Ti–O bonds in TiO6 octahedra, the two bands located at 348 and 425 cm−1 are ascribed to the stretching vibrations of Li–O bonds.45 It can be clearly seen that prominent peak centered at 234 cm−1 is due to the bending vibrations of O–Ti–O and O–Li–O bonds.46 In the spectra, for pristine LTO and surface modified LTO, all the above mentioned Raman bands are observed for the spinel Li4Ti5O12 too.
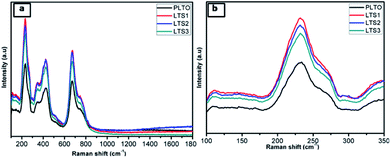 | ||
| Fig. 6 Raman spectra of (a) all Li4Ti5O12 (PLTO, LTS1, LTS2 and LTS3) samples (b) compares the magnified Raman signature. | ||
In case of silicate modified sample bands of LTO exhibit a slight shift to the higher wavelength with broadening (Fig. 6b) which suggests that the surface coating on LTO simultaneously changes the inner chemical environment of LTO, giving rise to the weakening of the cation–oxygen bonds and the increment in lattice constant.47 A further observation reveals that the peak intensity of Raman spectra decreases gradually in samples from LTS1–LTS3 composite with the increasing silicate content, implying the Si4+ content enhanced degree of disorder. Therefore, the Raman result reveals that the successful incorporation of Si4+ into the interstitial sites of LTO to impair the Li–O and Ti–O bonding.15
To investigate the surface elements, their chemical state and binding natures, X-ray photoelectron spectroscopy (XPS) measurements were conducted. Fig. 7 shows the survey spectrum of LTS1 and LTS3 samples which depicts the existence of Si, Li, Ti, and O elements related to LTO. Along with these elements, LTS2 shows Si corresponds to silicon components. The Si 2p peak could be deconvoluted into two peaks (Fig. 7b). Out of these, one peak located at 101.9 eV due to Li2SiO3 while the other for SiO2 (100.9 eV) from the Si–O bond in SiO2. This result confirms the existence of Li2SiO3 and SiO2 within the LTO phase. It is worth noting that the diffraction peaks of SiO2 in XRD cannot be detected in silicate modified Li4Ti5O12 which might be due to the low content and amorphous state of SiO2.48 Fig. 7c shows Li 1s peak occurs at 61.7 and 61.8 eV for PLTO and LTS2 sample respectively. The Ti 2p presented Ti 2p1/2 peak centered at 464.40 eV and Ti 2p3/2 around 458.56 eV which depicts that the oxidation state of the Ti cations is four (IV) in PLTO and LTS2 as shown in Fig. 7d.48–50 Fig. 7e, shows the O 1s peak at 530 eV and 531.5 eV observed are related to TiO2, while the peak at 532.5 eV observed is associated with oxygen bonded with silicon. In addition, in every peak, the binding energies of modified LTO are shifted to longer wavelength with lowering in intensity than that pristine LTO due to the existence of Li2SiO3 and SiO2.
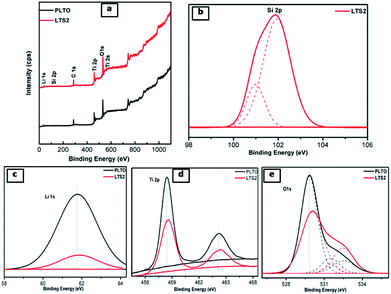 | ||
| Fig. 7 (a) XPS survey scan PLTO and silicate modified Li4Ti5O12 (LTS2: 2%) and XPS spectra of (b) Li, (c) Ti, (d) Si, (e) O. | ||
4. Electrochemical study
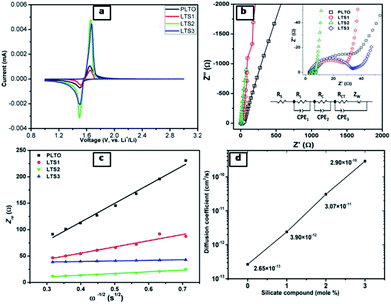
The electrochemical performance of individual LTO samples was identically investigated using a coin-type half cell. Cyclic voltammograms (CVs) curves of PLTO, LTS1, LTS3 and LTS4 are shown in Fig. 8a. The anodic peaks at about 1.65 V (vs. Li/Li+) and the cathodic peaks at around 1.49 V (vs. Li/Li+) are correspond to the processes of Li de-intercalation and intercalation within the spinel Li4Ti5O12. The result clearly demonstrates that there is a pair of similar reversible redox peaks for pure LTO and modified LTO, suggesting that Li2SiO3 do not change the electrochemical reaction process of LTO. But the intensity of cathodic and anodic peaks of the LTS2 sample are higher and sharper compared to the PLTO. The peaks reflect the better electrode kinetic which enhances the charge–discharge capacity of modified Li4Ti5O12 (LTS2).Fig. 8b shows the AC impedance spectra of the all LTO electrodes, which are measured at the identical conditions. The impedance spectra are simulated with the given equivalent circuit and the results are presented in Table 1 for resistance (R) values. In this circuit RS, RL, RC and RCT are electrolyte resistance, resistance of LS coating, connection resistance of active nanoparticles and charge transfer resistance, respectively. The charge transfer resistance of LTS2 (7.63 Ω) is less than that of the pristine PLTO (35.43 Ω), most likely because of the availability of Li ions which increases charge transfer process at the electrode/electrolyte interface. The exchange current density (i0) behaviour of all LTO samples are evaluated by the eqn (7)48 and values are presented in Table 1.
 | (7) |
| Sample | RS (Ω) | RL (Ω) | RC (Ω) | RCT (Ω) | i0 (mA cm−2) |
|---|---|---|---|---|---|
| PLTO | 4.64 | 41.75 | 12![[thin space (1/6-em)]](https://www.rsc.org/images/entities/char_2009.gif) 551 551 |
35.43 | 0.72 |
| LTS1 | 2.769 | 27.22 | 17![[thin space (1/6-em)]](https://www.rsc.org/images/entities/char_2009.gif) 320 320 |
28.60 | 0.90 |
| LTS2 | 3.338 | 4.17 | 3317 | 7.63 | 3.38 |
| LTS3 | 1.871 | 26.45 | 901.4 | 33.7 | 0.76 |
These results reveal that LTS2 sample has higher exchange current density (3.38 mA cm−2) than PLTO sample (0.72 mA cm−2) which confirms that silicate coating on LTO effectively increases the Li+ ion diffusion which controls the interfacial resistance between particles during the electrochemical reactions. During the charge–discharge cycling, electrolyte soaks into the silicate compounds to form solid electrolyte which enhances the ionic conductivity of LTO particles. In this case, Li2SiO3 and amorphous SiO2 on the LTO surface provide larger contact area at the interface of electrode and electrolyte which in turn may accelerate Li+ ion diffusion. Additionally to investigate the effect of surface modification on LTO in terms of Li+ ion diffusion calculated from the relationship between Zre and ω−1/2 in the low frequency region using the following equations.15,51
 | (8) |
 | (9) |
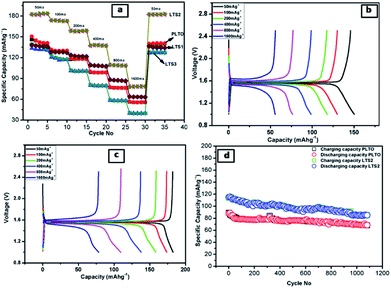
The discharge–charge behaviours of the individual composite electrodes are performed by galvanostat. The electrochemical performance of the LTO and modified LTO is shown in Fig. 9. The rate potential of the LTO and surface modified LTO are tested at the current densities from 50 to 1600 mA g−1 (Fig. 9a), respectively. Accordingly, the reversible discharge capacities obtained at various current densities are summarized in Table 2.
| Cycle no. | Current rate (mA g−1) | Specific capacity (mA h g−1) | |||
|---|---|---|---|---|---|
| PLTO | LTS1 | LTS2 | LTS3 | ||
| 1 | 50 | 150 | 138 | 182 | 139 |
| 6 | 100 | 131 | 128 | 174 | 123 |
| 11 | 200 | 118 | 123 | 158 | 102 |
| 16 | 400 | 99 | 109 | 138 | 81 |
| 21 | 800 | 78 | 88 | 109 | 59 |
| 26 | 1600 | 56 | 64 | 77 | 40 |
| 31 | 50 | 140 | 137 | 182 | 128 |
From the Table 2, it is observed that the reversible capacities of coated LTS2 are higher than those of pristine LTO (PLTO) at the respective current densities. For pristine LTO the initial discharge/charge capacities are 150/146 mA h g−1 and for modified LTO (LTS2) 182/183 mA h g−1. The reversible capacity for PLTO and LTS2 are 141 and 183 mA h g−1 retains after 5th cycles at 50 mA g−1, respectively. More significantly, it reveals better Li-intercalation maintained after cycling at different current densities. The initial coulombic efficiencies are observed to be 95.68, 97.33, 99.45 and 99.8% for PLTO, LTS1, LTS2 and LTS3, respectively. All the samples shows higher coulombic efficiency for first cycle reveals less SEI formation and better stability of the electrode due to interconnected particle network. At the maximum discharging rate i.e. 1600 mA g−1 C (∼10C), the LTS2 delivers a reversible capacity of 77 mA h g−1 which is higher than that of PLTO (56 mA h g−1). Moreover, recovery rate of LTS2 is observed to be ∼100% while for PLTO is 93% when the current density reverts to 50 from 1600 mA g−1. Fig. 9a depicts that as the current rate revert back from high to low, the specific capacity observed almost similar to initial capacity. This recovery clearly demonstrates that the stability of the LTO anode material which retained even after high current rate to lower during discharge/charge processes.
The modified LTO electrodes with 1% silicate, initially shows lower capacity than pristine LTO but having good rate capability at high current. Sample LTS2 exhibited higher capacity with better rate capability because of the interface bonding between LTO and LS which improved Li+ transport due the sintering. However, the LTS3 sample shows capacity decrease with the increasing amount of silicate (3%).
The better electrochemical performances for LTS2 confirm the favourable effect of optimum LS coating. Fig. 9b and c show the galvanostatic discharge/charge performance plateau at different current rates for PLTO and modified LTS2, respectively. A small amount of ionic conductor Li2SiO3, gives stability to the active material, additionally provides three-dimensional Li+ channels which favour the diffusion of Li+ ions, during discharging/charging process. By expanding the voltage plateau at around 1.3 V vs. Li/Li+ which ultimately enhances the capacity. The LTS3 demonstrate further suppressed electron migration and results in reduced cycling performance with a reversible capacity of 139 mA h g−1 than the LTS2 (182 mA h g−1) at 50 mA g−1 current rate. Due to excess LS there is increases ionic conductivity but reduction in electronic conductivity which is responsible for getting lower capacity for LTS3. To evaluate the polarization effects during galvanostatic charge/discharge, the potential interval (ΔV) between the initial discharge/charge plateaus is calculated for lower and higher current rates (50 and 1600 mA g−1) shown in Fig. 10. The potential interval is smaller for LTS2 compared to pristine PLTO. From Table 1, it is observed that the connection resistance RC among active particles is decreasing with increasing silicate concentration which is correlated with the ΔV values of respective samples. This suggests that, during cycling lithium silicate helps in reducing the polarization of Li+ ions. The cycling performance of PLTO and LTS2 samples was tested at the current rate of 800 mA g−1 for 1100 cycles between 1–2.5 V. The discharge capacities for PLTO and LTS2 samples were observed to be 67 and 88 mA h g−1 after 1100 cycles with 100% coulombic efficiency, respectively. It is noteworthy that at high current rate i.e. 800 mA g−1, the LTS2 electrode exhibits long-term cycling stability (88 mA h g−1 after 1100 cycles) with marginal capacity fading due to the insignificant volume change of LTO during cycling.
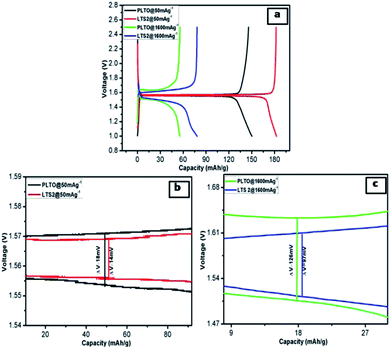 | ||
| Fig. 10 (a) Comparison of the initial discharge–charge profiles of PLTO and LTS2 at 50 and 1600 mA g−1 and (b) 50 mA g−1 (c) 1600 mA g−1. | ||
The pristine and modified Li4Ti5O12 synthesized via template method shows the efficient rate capability and cycling stability at 800 mA g−1, which serve as potential anode materials for high-performance LIBs. This improvement in performance is ascribed to the, interconnecting network of nanoparticles as well as surface modification in LTO having zero-strain property. Therefore, during cycling LTO has negligible volume change, which is an advantage for good cyclability and rate capability. In the surface modified system, Li2SiO3 nanoparticles increases ionic conductivity of Li ions and giving more Li+ ions during lithiation/delithiation processes and reduces the polarization which enhances the capacity. Surface modification exhibit creation in vacancies in LTO which inhibit the recombination of charge carrier. It is responsible for enhancement in the electrochemical properties of LTO. Additionally, Li2SiO3 nanoparticles with SiO2 form shielding layer on LTO against the electrolyte which suppresses the side reactions at the interfaces, which is beneficial to reduce the gassing behaviour and provide stability to the electrode materials.13 But some researchers emphasized more on the electrochemical activity than the Li+ diffusion at the high rate discharge processes. From the lithium ion diffusion coefficient Li2SiO3 exhibits excellent ionic conductivity, but its higher concentration decreases the specific capacity of LTO electrodes. At 3% silicate compound within LTO further suppressed electron migration and results in lower electronic conductivity during electrochemical reaction resulting in reduced cycling performance. Hence, surface modification of LTO with appropriate amount of silicate compound exhibits moderate ionic conductivity, good electrical conductivity with lower polarization which gives good reversible capacity and rate capability.
After electrochemical performances study of half-cells, the full cells with LiCoO2 as a cathode and LTS2 as anode were fabricated. Fig. 11a shows charge–discharge curve of the full cell and Fig. 11b shows the galvanostatic charge/discharge capacity at various C-rates (C/20, C/10, C/5 and 1C) with coulombic efficiency. Further this cell cycled up to 100 cycles. The initial charge capacity of the cell at C/20 rate is 110 mA h g−1 and while reversible capacity was 107 mA h g−1. The good electrochemical stability of full cell demonstrates the stability of the electrode material. The specific capacity of cell is 98 mA h g−1 at C/10 rate. The LiCoO2/LTS2 full cell also showed good rate performance, as shown in Fig. 11b. Further, work on improve the enhancement in capacity for full cell for high performance grid storage applications is in progress. In nutshell, the present versatile whatman paper template approach of synthesis will have potential to produce other active materials for battery application.
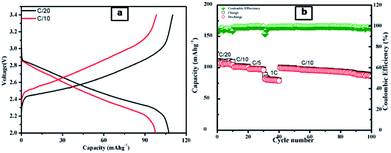 | ||
| Fig. 11 (a) Galvanostatic charge–discharge voltage profiles of a LiCoO2/LTS2 full cell at varied current densities within a voltage of 2–3.4 V; (b) the rate performance for LiCoO2/LTS2 full cell. | ||
5. Conclusions
Herein, we have demonstrated Li4Ti5O12 and silicate modified Li4Ti5O12 nanostructures using versatile paper-template technique with interconnected particle network for the first time. The present synthesis method is a new and facile technique for the modification of Li4Ti5O12 which has been effectively utilized for Li ion batteries. The 2% silicate modified Li4Ti5O12 anode demonstrated high ionic conductivity with lower electrochemical polarization shows enhanced electrochemical properties. The half-cell of modified LTO (LTS2) shows a high initial discharge capacity of 182 mA h g−1 at 50 mA g−1 rate between 1–2.5 V with 2% silicate compound. Significantly it shows better capacity retention when switched from higher current (1600 mA g−1) to lower current (50 mA g−1). It is observed that excess silicate coating on LTO lower the electrochemical performance. More significantly at optimum silicate coating on LTO shows enhanced electrochemical performance due to decrease in the charge transfer resistance by availing the Li ions. As well as ionic and electronic conductivity of LTO enhances which increases the Li ion diffusion this helps in migration and transport of electron. The present nanocomposite as an anode materials exhibit a remarkably reversible specific capacity 110 mA h g−1 for LIBs. More significantly, it reveals excellent rate capabilities maintained after cycling at different current densities for full cell. Therefore, it is anticipated that such a facile “versatile-template” approach with Li2SiO3 as a surface modifier can provide as promising platform to produce other density packed active materials for battery application (LIBs).Conflicts of interest
There are no conflicts to declare.Acknowledgements
Author would like to thank Ministry of Electronics and information Technology (MeitY), Government of India (No. 1(09)/2013-EMCD) and Ministry of science and technology (No. SR/WOS-A/CS-73/2017) for financial support. Authors would like to thank C-MET Pune for providing research facilities and nanocrystalline materials group for kind support.Notes and references
- T.-F. Yi, S.-Y. Yang and Y. Xie, J. Mater. Chem. A, 2015, 3, 5750–5777 RSC.
- T. Yuan, Z. Tan, C. Ma, J. Yang, Z. F. Ma and S. Zheng, Adv. Energy Mater., 2017, 7, 1601625 CrossRef.
- X. Han, X. Gui, T.-F. Yi, Y. Li and C. Yue, Curr. Opin. Solid State Mater. Sci., 2018, 22, 109–126 CrossRef CAS.
- D. W. Murphy, R. J. Cava, S. M. Zahurak and A. Santoro, Solid State Ionics, 1983, 9–10, 413–417 CrossRef CAS.
- F. Ronci, P. Reale, B. Scrosati, S. Panero, V. Rossi Albertini, P. Perfetti, M. di Michiel and J. M. Merino, J. Phys. Chem. B, 2002, 106, 3082–3086 CrossRef CAS.
- K. Ariyoshi, R. Yamato and T. Ohzuku, Electrochim. Acta, 2005, 51, 1125–1129 CrossRef CAS.
- T. Yuan, X. Yu, R. Cai, Y. Zhou and Z. Shao, J. Power Sources, 2010, 195, 4997–5004 CrossRef CAS.
- B. Yan, M. Li, X. Li, Z. Bai, J. Yang, D. Xiong and D. Li, J. Mater. Chem. A, 2015, 3, 11773–11781 RSC.
- M. Wilkening, R. Amade, W. Iwaniak and P. Heitjans, Phys. Chem. Chem. Phys., 2007, 9, 1239–1246 RSC.
- K. T. Fehr, M. Holzapfel, A. Laumann and E. Schmidbauer, Solid State Ionics, 2010, 181, 1111–1118 CrossRef CAS.
- T. Ohzuku, A. Ueda, N. Yamamoto and Y. Iwakoshi, J. Power Sources, 1995, 54, 99–102 CrossRef CAS.
- W. Wepner, P. Schmid-Beurmann and S. Scharner, J. Electrochem. Soc., 1999, 146, 857–861 CrossRef.
- A. Mahmoud, J. M. Amarilla and I. Saadoune, Electrochim. Acta, 2015, 163, 213–222 CrossRef CAS.
- E. Pohjalainen, T. Rauhala, M. Valkeapää, J. Kallioinen and T. Kallio, J. Phys. Chem. C, 2015, 119, 2277–2283 CrossRef CAS.
- X. Bai, T. Li, Z. Dang, Y.-X. Qi, N. Lun and Y.-J. Bai, ACS Appl. Mater. Interfaces, 2017, 9, 1426–1436 CrossRef CAS PubMed.
- S. Jiang, B. Zhao, Y. Chen, R. Cai and Z. Shao, J. Power Sources, 2013, 238, 356–365 CrossRef CAS.
- D. Leanza, C. A. F. Vaz, I. Czekaj, P. Novak and M. El Kazzi, J. Mater. Chem. A, 2018, 6, 3534–3542 RSC.
- L. Xiaoshi, L. Ying, C. Kedi, L. Lan, Z. Qingguo and W. Hao, Energy Technol., 2018 DOI:10.1002/ente.201700982.
- Q. Wang, S. Yang, J. Miao, M. Lu, T. Wen and J. Sun, Appl. Surf. Sci., 2017, 403, 635–644 CrossRef CAS.
- N. Sharma, D. Puthusseri, M. O. Thotiyl and S. Ogale, ACS Omega, 2017, 2, 8818–8824 CrossRef CAS.
- M. Qin, Y. Li and X.-J. Lv, Nanomaterials, 2017, 7(6), 150–160 CrossRef PubMed.
- Y. Wang, J. Zhao, J. Qu, F. Wei, W. Song, Y.-G. Guo and B. Xu, ACS Appl. Mater. Interfaces, 2016, 8, 26008–26012 CrossRef CAS PubMed.
- B. Kurc, Ionics, 2018, 24, 121–131 CrossRef CAS.
- X. Li, J. Xu, P. Huang, W. Yang, Z. Wang, M. Wang, Y. Huang, Y. Zhou, M. Qu, Z. Yu and Y. Lin, Electrochim. Acta, 2016, 190, 69–75 CrossRef CAS.
- H. Ge, T. Hao, H. Osgood, B. Zhang, L. Chen, L. Cui, X.-M. Song, O. Ogoke and G. Wu, ACS Appl. Mater. Interfaces, 2016, 8, 9162–9169 CrossRef CAS PubMed.
- C. Zhang, D. Shao, Q. Gao, Y. Lu, Z. Liu, X. Yu, Y. Fang and D. Chen, J. Solid State Electrochem., 2015, 19, 1859–1866 CrossRef CAS.
- T.-F. Yi, Z.-K. Fang, Y. Xie, Y.-R. Zhu and S.-Y. Yang, ACS Appl. Mater. Interfaces, 2014, 6, 20205–20213 CrossRef CAS PubMed.
- Z. Zhao, Y. Xu, M. Ji and H. Zhang, Electrochim. Acta, 2013, 109, 645–650 CrossRef CAS.
- G. B. Xu, W. Li, L. W. Yang, X. L. Wei, J. W. Ding, J. X. Zhong and P. K. Chu, J. Power Sources, 2015, 276, 247–254 CrossRef CAS.
- G. Xu, L. Yang, X. Wei, J. Ding, J. Zhong and P. K. Chu, Adv. Funct. Mater., 2016, 26, 3349–3358 CrossRef CAS.
- F. Cheng, Y. Xin, Y. Huang, J. Chen, H. Zhou and X. Zhang, J. Power Sources, 2013, 239, 181–188 CrossRef CAS.
- Y. Zheng, M. Hirayama, S. Taminato, S. Lee, Y. Oshima, K. Takayanagi, K. Suzuki and R. Kanno, J. Power Sources, 2015, 300, 413–418 CrossRef CAS.
- X. Yang, R. Yu, L. Ge, D. Wang, Q. Zhao, X. Wang, Y. Bai, H. Yuan and H. Shu, J. Mater. Chem. A, 2014, 2, 8362–8368 RSC.
- X. Pu and C. Yu, Nanoscale, 2012, 4, 6743–6747 RSC.
- H. Miyashiro, S. Seki, Y. Kobayashi, Y. Ohno, Y. Mita and A. Usami, Electrochem. Commun., 2005, 7, 1083–1086 CrossRef CAS.
- G. Tan, F. Wu, L. Li, R. Chen and S. Chen, J. Phys. Chem. C, 2013, 117, 6013–6021 CrossRef CAS.
- H. Deng, P. Nie, H. Luo, Y. Zhang, J. Wang and X. Zhang, J. Mater. Chem. A, 2014, 2, 18256–18262 RSC.
- J. Lu, Q. Peng, W. Wang, C. Nan, L. Li and Y. Li, J. Am. Chem. Soc., 2013, 135, 1649–1652 CrossRef CAS PubMed.
- Y. Deng, J. Mou, H. Wu, N. Jiang, Q. Zheng, K. H. Lam, C. Xu and D. Lin, Electrochim. Acta, 2017, 235, 19–31 CrossRef CAS.
- R. J. G. E. Ferg, A. de Kock and M. M. Thackeray, J. Electrochem. Soc., 1994, 141, 147–150 CrossRef.
- T.-F. Yi, Y.-R. Zhu, W. Tao, S. Luo, Y. Xie and X.-F. Li, J. Power Sources, 2018, 399, 26–41 CrossRef CAS.
- A. N. Jansen, A. J. Kahaian, K. D. Kepler, P. A. Nelson, K. Amine, D. W. Dees, D. R. Vissers and M. M. Thackeray, J. Power Sources, 1999, 81–82, 902–905 CrossRef CAS.
- G. Kale, S. Arbuj, U. V. Kawade, S. Rane, J. Ambekar and B. B Kale, Mater. Chem. Front., 2017, 2, 163–170 RSC.
- K. Kataoka, Y. Takahashi, N. Kijima, J. Akimoto and K.-i. Ohshima, J. Phys. Chem. Solids, 2008, 69, 1454–1456 CrossRef CAS.
- L. Aldon, P. Kubiak, M. Womes, J. C. Jumas, J. Olivier-Fourcade, J. L. Tirado, J. I. Corredor and C. Pérez Vicente, Chem. Mater., 2004, 16, 5721–5725 CrossRef CAS.
- R. Baddour-Hadjean and J.-P. Pereira-Ramos, Chem. Rev., 2010, 110, 1278–1319 CrossRef CAS PubMed.
- T.-F. Yi, J. Shu, Y.-R. Zhu, X.-D. Zhu, C.-B. Yue, A.-N. Zhou and R.-S. Zhu, Electrochim. Acta, 2009, 54, 7464–7470 CrossRef CAS.
- W. Li, M. Chen, J. Jiang, R. Wu, F. Wang, W. Liu, G. Peng and M. Qu, J. Alloys Compd., 2015, 637, 476–482 CrossRef CAS.
- J. Mosa, J. F. Vélez, J. J. Reinosa, M. Aparicio, A. Yamaguchi, K. Tadanaga and M. Tatsumisago, J. Power Sources, 2013, 244, 482–487 CrossRef CAS.
- R. Lv, J. Yang, J. Wang and Y. NuLi, J. Power Sources, 2011, 196, 3868–3873 CrossRef CAS.
- X. Wang, H. Hao, J. Liu, T. Huang and A. Yu, Electrochim. Acta, 2011, 56, 4065–4069 CrossRef CAS.
- S. Takai, M. Kamata, S. Fujine, K. Yoneda, K. Kanda and T. Esaka, Solid State Ionics, 1999, 123, 165–172 CrossRef CAS.
- L. P. An, X. P. Gao, G. R. Li, T. Y. Yan, H. Y. Zhu and P. W. Shen, Electrochim. Acta, 2008, 53, 4573–4579 CrossRef CAS.
- H.-W. Lu, D. Li, K. Sun, Y.-S. Li and Z.-W. Fu, Solid State Sci., 2009, 11, 982–987 CrossRef CAS.
Footnote |
| † Electronic supplementary information (ESI) available. See DOI: 10.1039/c8ra07953f |
| This journal is © The Royal Society of Chemistry 2018 |

