 Open Access Article
Creative Commons Attribution 3.0 Unported Licence
Photocatalytic decontamination of phenol and petrochemical wastewater through ZnO/TiO2 decorated on reduced graphene oxide nanocomposite: influential operating factors, mechanism, and electrical energy consumption†
Farzan Hayatia,
Ali Akbar Isaria,
Moslem Fattahi *a,
Bagher Anvaripour*a and
Sahand Jorfibc
aDepartment of Chemical Engineering, Abadan Faculty of Petroleum Engineering, Petroleum University of Technology, Abadan, Iran. E-mail: farzan.hayati73@gmail.com; aliichemeng@gmail.com; fattahi@put.ac.ir; anvaripour@put.ac.ir
bDepartment of Environmental Health Engineering, School of Health, Ahvaz Jundishapur University of Medical Sciences, Ahvaz, Iran. E-mail: sahand369@yahoo.com
cEnvironmental Technologies Research Center, Ahvaz Jundishapur University of Medical Sciences, Ahvaz, Iran
First published on 30th November 2018
Abstract
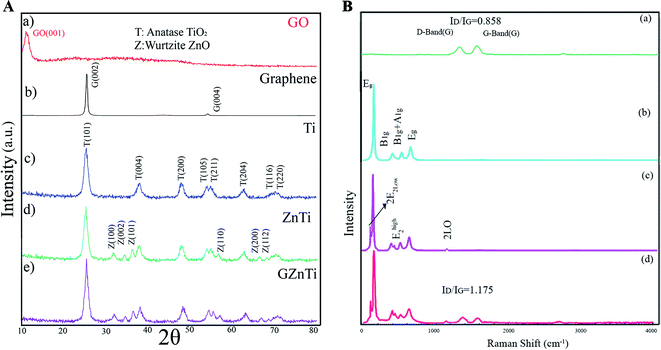
ZnO/TiO2 anchored on a reduced graphene oxide (rGO) ternary nanocomposite heterojunction was synthesized via the multi-step method including hydrothermal, solvothermal and sol–gel methods. XRD, Raman, FESEM, EDX, Dot Mapping EDS, BET, FTIR, UV-VIS, TGA, and EIS techniques were utilized for characterizing as-synthesized catalysts. The XRD and Raman data proved the formation of anatase phase TiO2 and wurtzite phase ZnO in the prepared samples. Further, the UV-Vis spectrum confirmed that the band gap value of ZnO/TiO2 diminished on introduction of graphene oxide. Photocatalytic performance of the fabricated catalysts was investigated by decontamination of phenol in aqueous solutions. The effect of different operational factors such as pH, catalyst dosage, phenol concentration, and light illumination was investigated to find the optimum decontamination conditions. According to the results, complete degradation of phenol was achieved at pH = 4, catalyst dosage of 0.6 g L−1, light intensity of 150 W, and phenol initial concentration of 60 ppm at 160 min under visible light illumination. With the addition of graphene oxide to the composite, a significant increase was detected in the photocatalytic performance due to the higher available surface area and lower electron/hole recombination rate. In addition, the scavenging experiments revealed that the ·OH is responsible for the degradation of phenol during the reaction. The degradation mechanism, economic performance, mineralization, and recyclability were also investigated. Kinetic studies confirmed that photocatalytic degradation process followed the pseudo-first-order kinetic model. A case of real wastewater treatment was used to examine the performance of the catalyst for real case studies.
1 Introduction
Nowadays, providing clean and healthy water resources has become one of the most important concerns of governments due to the population growth, considerable increase in water withdrawal, and production of large amounts of wastewater by different industries. Many industries produce water effluent containing organic compounds which are considered harmful environmental contaminants. The discharge of these contaminants makes changes to the ecosystem of aqueous systems by reducing the concentration of dissolved oxygen in natural channels. Petrochemical plants, petroleum refineries, and textile industries are the most important sources of phenol and heavy aromatic compounds. Phenol and phenolic compounds are bio-recalcitrant toxic organic compounds which are very harmful to the environment. Based on the European Union regulation no. 80/778/EC, the maximum allowable concentration of phenolic compounds is 0.5 mg L−1 in drinking water. Accordingly, wastewater containing a high concentration of aromatic and toxic contaminants should be effectively treated before being discharged into natural channels.1–6In particular, due to non-biodegradability of phenolic compounds in aqueous solutions, conventional biological methods are inefficient for effective treatment of these compounds. In recent years, advanced oxidation processes (AOPs) have changed into an alternative solution in the wastewater treatment plants for degradation of recalcitrant organic compounds thanks to their high degradation efficiency, low-cost, fast reaction rate, and non-selective degradation. AOPs are based on production of very reactive radicals involving ozonation, H2O2/O3 combined with UV, semiconductor photocatalysis, Fenton, photo-Fenton, ultrasound irradiation and wet air oxidation.3,7–9 Amongst AOPs, heterogeneous semiconductor photocatalysis has been proven as one of the most appropriate and effective methods for degradation of recalcitrant organic contaminants in water thanks to its high performance, low material consumption, and cost-effectiveness. Recently, many semiconductors have been under usage as photocatalyst such as TiO2, ZnO, WO3, MgO, SiO2, Fe2O3, and CdS.10–16 Semiconductor photocatalysts have recently demonstrated high photocatalytic activity for decontamination of organic compounds in aqueous solutions. Typically, titania has been revealed as a promising catalyst and has been widely used in photocatalytic degradation of organic contaminants due to its electrochemical properties, low cost, availability, high stability and non-toxicity. However, pristine TiO2 has a fast electron/hole (e/h) recombination rate which restricts the photo-generated electron–holes lifetime. Further, these semiconductors have a large band gap and low efficiency in degradation of contaminants under visible light regions. Alternatively, several techniques have been chosen to improve the efficiency including metal/nonmetal doping, hetero-structures, multi-component composites using other semiconductors, architectural control, etc. Combination of wide bandgap semiconductors with narrow bandgap semiconductors and formation of type I heterojunctions can enhance the photocatalytic activity of titania.17–25
The composite of TiO2 and ZnO has shown to have a higher photocatalytic activity than pristine TiO2 and/or ZnO because of type II hetero-junction formation which inhibits the e/h recombination rate. Furthermore, the heterogeneous structure formation by two semiconductors extends the photo response of composites to visible light area.26–30
Co-adsorbents such as zeolites, carbonaceous materials, and nano-clays are another way for further enhancing the photocatalytic activity and adsorption capacitance of TiO2. Recently, graphene nanosheets have been used as an effective ESI† due to its favorable properties like solar radiation absorption, separation of efficient charge carriers, exposed reactive sites, and high surface area. Graphene has superior properties such as optical transparency, high surface area, and high electrical conductivity along with other physiochemical properties. It was shown that this support can enhance the degradation efficiency through making a hybrid by semiconductor metal oxides. Many heterogeneous nanostructure photocatalysts coupled with graphene nanosheets have been synthesized and developed in recent years.17,19,26,31–34
Photocatalytic process efficiency is significantly affected by electron–hole recombination rate which could be controlled by various parameters such as interfacial properties, electronic properties, chemical composition, and physical dimension.23 Various statements have been suggested about the characteristics of graphene in hetero-structure nanocomposites which included graphene nanosheets in their frameworks: (I) formation of Zn–O–C, Zn–C, and Ti–O–C bonds by graphene defect states improves the solar or visible light adsorption capacity of catalysts; (II) graphene can accept or donate electrons due to its high electron mobility in order to reduce the e/h recombination rate of ZnO/TiO2 nanocomposite, thus prolonging the life-time of excited electrons during the reaction; (III) graphene enhances the adsorption capacity of nanocomposites and creates more reactive sites for sorption of target contaminants because of its high BET specific surface area.23,35,36 However, graphene nanosheets are hydrophobic, making it challenging to disperse graphene in aqueous solutions for preparing homogenous solutions. Homogeneous dispersion of graphene oxide (GO) in aqueous mediums is easier than that of graphene due to its functional groups such as –OH and –COOH. Therefore, GO nanosheets are commonly used in the synthesis of photocatalytic nanocomposites. Thus, we expected that the introduction of rGO in the TiO2/ZnO framework would resolve the TiO2/ZnO restrictions and considerably enhance the photocatalytic activity of TiO2/ZnO under visible light illumination. To the best of our knowledge, many studies have explored enhanced photocatalytic activity of titania via ZnO and/or graphene. Shahbazi et al. used TiO2 nanoparticles over graphene nanosheets synthesized in hydrothermal process as a photocatalyst for degradation of phenol in aqueous media under UV irradiation.3 Raliya et al. used TiO2, ZnO, GO/TiO2, GO/ZnO, TiO2/ZnO for mineralization of methyl orange dye under visible light illumination.20 Nuengmatcha et al. evaluated the sonocatalytic performance of ZnO/G/TiO2 nanocomposite for degrading dye contaminants under ultrasonic irradiation.17 Malekshoar et al. used TiO2/graphene, ZnO/graphene and their physical mixture for degradation of phenol with sun light irradiation.26 Liu et al. synthesized ZnO/TiO2/rGo nanocomposite via microwave-assisted method and evaluated its photocatalytic performance by reduction of Cr(VI).27
Due to low quantum yield of bare TiO2 and its wide band gap value, ZnO as a coupling semiconductor material is able to suppress the electron/hole recombination rate of TiO2 and improve its photocatalytic activity. Besides, reduced graphene oxide was used for surface modification of titania and improving its adsorption as well as charge conductivity performance. To the best of our knowledge, there are limited studies which used couple of modifications for degradation of phenol and real petrochemical wastewater under visible light irradiation. In this study, catalysts were synthesized via multi-step method involving hydrothermal, solvothermal and sol–gel methods. The prepared composite was characterized and studied for phenol photocatalytic degradation under visible light illumination in aqueous solutions. The effect of different operational parameters including pH, phenol concentration, catalyst dosage, and light illumination were examined. In addition, stability of fabricated nanocomposite during reactions, mineralization rate, economic estimation of the process, possible degradation mechanism, and trapping studies were also investigated. In the end, a petrochemical wastewater was treated via the fabricated catalyst.
2 Materials and methods
2.1 Materials
GO and graphene was purchased from US Research nanomaterial (USA). Titanium(IV) butoxide (TB; 99.9%) was utilized as the precursor of TiO2. Also, zinc nitrate hexahydrate (ZN) was employed as the precursor of ZnO. Other chemicals were purchased from Merck (Germany). All materials were utilized without further purification because of their analytical grade.2.2 Real wastewater sampling
The real petrochemical wastewater was collected from wastewater effluent of Maroun Petrochemical Company, Mahshahr, Iran. The collected samples were stored in 10 L containers at 4 °C. The physiochemical features of the collected wastewater such as COD, TDS, BOD, TSS, and pH were determined based on specific standard techniques (ISO 5667-10:1992).2.3 Preparation of TiO2
For this purpose, 10 mL of TB was added to 40 mL of absolute ethanol (AE) and sonicated for 30 min (mixture 1). Another solution containing 10 mL ethanol, 80 mL deionized water (DI) and 3 mL HNO3 was added to mixture 1 dropwise under constant stirring. After 1 h of stirring, the homogeneous solution was heated at 80 °C in a hot water bath for 30 min. Then, the hot solution was allowed to cool and form the gel. Next, the gel remained still for 24 h, which was then dried in an oven at 100 °C for 8 h. At the end, the fine powder of dried gel was annealed at 400 °C for 4 h to achieve the anatase phase of TiO2(Ti).33,372.4 Preparation of ZnO
To this aim, 10 gr ZN was dissolved in 250 mL DI water and sonicated for 2 h. The prepared solution was heated at 90 °C under constant stirring for another 5 h. Next, the obtained mixture was dried at 100 °C overnight. Finally, the obtained fine powder was annealed at 600 °C for 2 h to achieve the wurtzite phase of ZnO.382.5 Preparation of rGO/ZnO/TiO2
rGO/ZnO/TiO2 (GZnTi) was synthesized through facile hydrothermal method. A suitable amount of GO (0.05, 0.075 and 0.1 gr GO for 5, 7.5 and 10 wt%, respectively) was dissolved in a mixture containing 20 mL DI water and 40 mL AE and sonicated for 1 h. Then, 0.1 g of ZnO and 0.9 g TiO2 (10% ZnO/90% TiO2) were added to the prepared mixture and sonicated for another 2 h to attain a homogeneous suspension. The attained suspension was transferred to 100 mL Teflon sealed hydrothermal autoclave and maintained at 120 °C for 3 h to develop the nanocomposite of rGO, ZnO and TiO2. Finally, the achieved composite was filtered and washed with ethanol several times and dried at room temperature. ZnO/TiO2 (ZnTi) nanocomposite was synthesized by the mentioned hydrothermal method without adding GO.392.6 Characterization
Horiba-Jobin-Yvonlabram-HR UV-VIS-NIR Raman spectrometer (λlaser = 532 nm) was used for Raman spectroscopy. Fourier transform infrared (FT-IR) spectra of the synthesized photocatalysts were evaluated using Bruker-VERTEX70 apparatus. The X-Ray Diffraction (XRD) profile of the synthesized samples was recorded by X-Ray diffractometer (Quantachrome, NOVA 2000) through graphite monochromatic CuKα irradiation (0.15406 nm wave length) within the range of 10–80° with 0.05° step size. The field emission scanning electron microscope (FESEM), Energy Dispersive X-ray (EDX) and Dot-Mapping of samples were recorded using Mira-3-Taksan operating at 15.0 kV. Brunauer–Emmett–Teller (BET) specific surface areas of the samples were determined by N2-adsorption–desorption isotherms at 77 K using Beckman-Coulter 3100 instrument. Barrett–Joyner–Halenda (BJH) model was used for determining the pore mean diameter using N2-adsorption measurement with 0.99 bar relative pressure. UV-Vis Diffuse reflectance spectroscopy (UV-VIS DRS) of specimens was examined using a SHI-MADZU spectrometer model UV-1240 (ranging from 200–900 nm with BaSO4 as reference). The electrochemical impedance spectroscopy (EIS) of the synthesized catalysts was investigated via potential-galvanostat PGSTAT302N instrument in a three-electrode-cell using saturated calomel electrode and platinum foil as the reference electrode and counter electrode, respectively. AC voltage amplitude, frequency range, and electrolyte were 10 mV, 10–100 kHz, and NaCl 3.5 wt%, respectively. The total organic carbon (TOC) of the degraded solution was studied via the DC-190 of Rosemount-Dohrmann analyzer. Thermogravimetric analysis (TGA) of the as-synthesized nanostructures was performed by a Q-600 TA-apparatus under air flow at a warming rating of 5 °C min−1 ranging from ambient temperature to 800 °C.2.7 Photocatalytic activity
To prevent any ion interference during the reaction, DI water was used for preparing all solutions. In order to evaluate the photocatalytic activity of as-synthesized photocatalysts, phenol degradation (Ph-degradation) in aqueous medium was used as the objective contaminant. In the reaction process, three visible 270.7 Cd lamps equipped with λ > 420 nm filter was utilized as the visible light source, and the experiments were performed at the ambient temperature. First, a 250 mL solution was prepared with a certain amount of phenol. Then, a specific amount of as-synthesized catalyst was added to the phenol solution. With addition of NaOH 0.5 M or HCl 0.5 M L−1, the pH of the solution was adjusted. The pH of the media was determined using S210-Std-Kit Mettler-Toledo pH-meter under 250 rpm stirring. To achieve adsorption–desorption equilibrium, the mixture was loaded on to a 250 mL reactor and stirred (at 250 rpm and 27 ± 1 °C) for 60 min in the dark. The photocatalytic reaction was initiated by exposing the prepared suspension to visible light irradiation.At specific time periods, 5 mL of the solution was sampled to determine the phenol concentration. PIT320 Universal centrifuge apparatus was used to remove the photocatalysts from the aqueous solution. The phenol concentration of the sample was calculated by UV2100 Unico UV-visible spectrophotometer to record the specific absorption at λmax = 270 nm (maximum absorption wavelength).3 The removal and mineralization efficiencies of the system were calculated using the following equations:
 | (1) |
 | (2) |
The adsorption capacity of the system was obtained through the following equation:
 | (3) |
3 Results and discussion
3.1 Characterization of photocatalysts
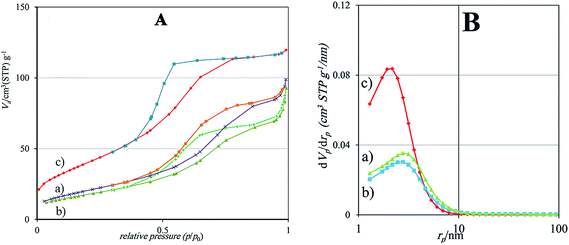
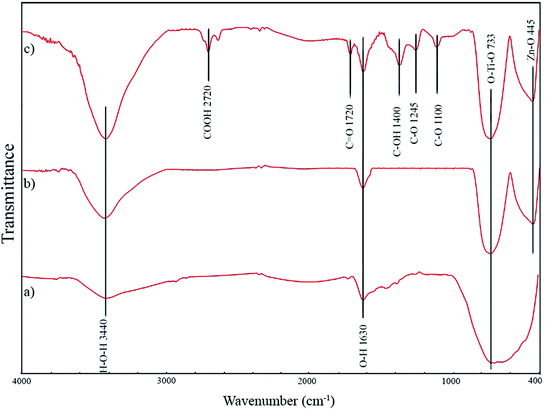
![[double bond, length as m-dash]](https://www.rsc.org/images/entities/char_e001.gif) O vibrations, O–H vibrations, C–OH stretching vibrations, C–O stretching vibration, and C–OH stretching vibration, respectively. The formation of the mentioned carbon-containing bonds in GZnTi pattern revealed existence of GO in the ZnTi nanocomposite.
O vibrations, O–H vibrations, C–OH stretching vibrations, C–O stretching vibration, and C–OH stretching vibration, respectively. The formation of the mentioned carbon-containing bonds in GZnTi pattern revealed existence of GO in the ZnTi nanocomposite.
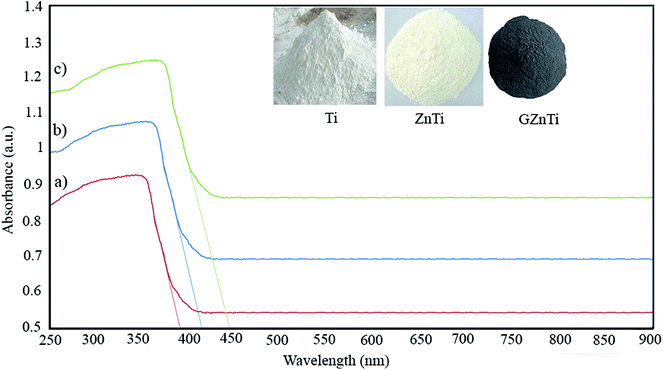
 | (4) |
| Sample | Cut of wave length (λ) (nm) | Band gap (eV) |
|---|---|---|
| Ti | 385 | 3.21 |
| ZnTi | 419 | 2.95 |
| GZnTi | 446 | 2.77 |
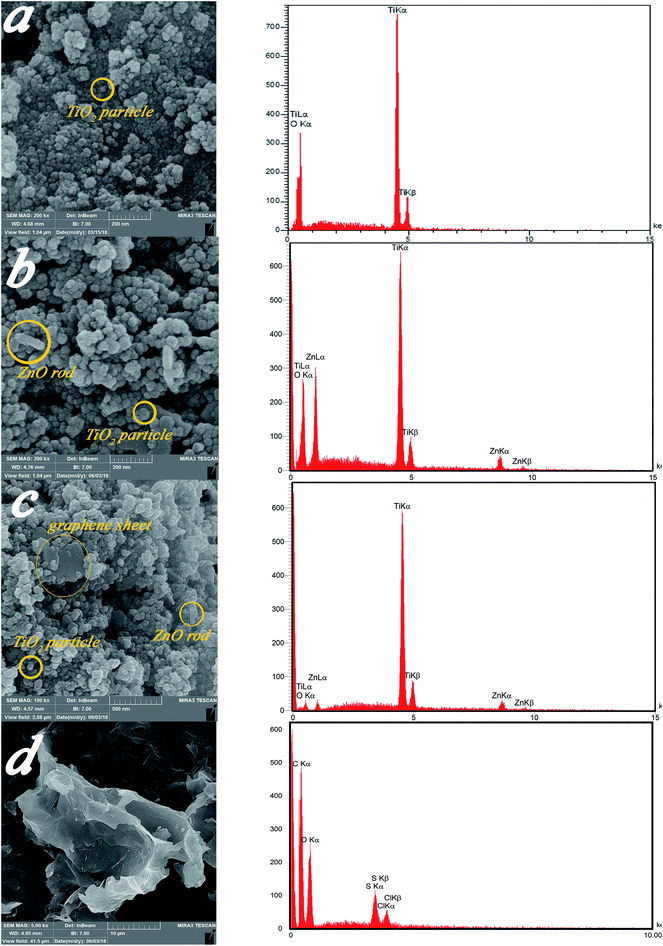 | ||
| Fig. 5 FESEM micrographs and of (a) Ti, (b) ZnTi, (c) GZnTi, and (d) GO with corresponding EDX tests. | ||
| Sample | Element | Calculated weight percent (wt%) for synthesis process | Obtained weight percent (wt%) from EDX |
|---|---|---|---|
| Ti | Ti | 59.9 | 58.29 |
| O | 40.1 | 41.71 | |
| ZnTi (10% ZnO, 90% TiO2) | Ti | 53.91 | 52.79 |
| O | 38.05 | 38.23 | |
| Zn | 8.03 | 8.98 | |
| GZnTi (7.5% rGO, 10% ZnO, 82.5% TiO2) | Ti | 49.41 | 47.64 |
| O | 35.06 | 36.12 | |
| Zn | 8.03 | 9.23 | |
| C | 7.5 | 7.01 | |
| GO | C | Not need | 59.62 |
| O | Not need | 35.72 | |
| S | Not need | 3.04 | |
| Cl | Not need | 1.63 |
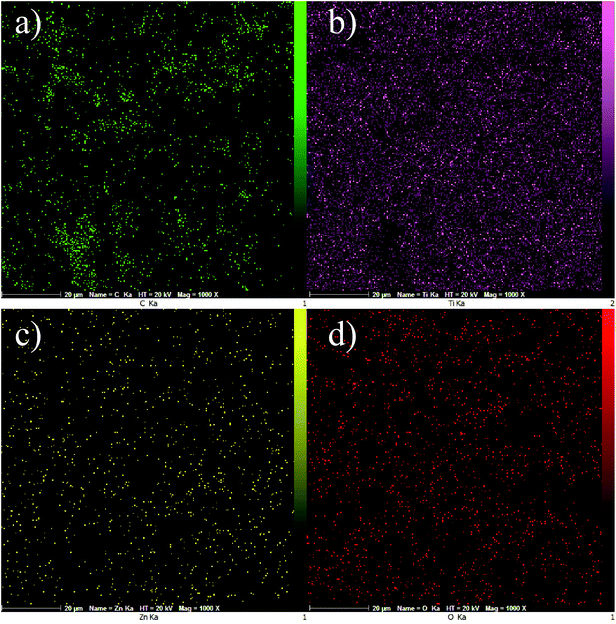
Fig. 6a–d display EDS mapping images of the GZnTi photocatalyst. The obtained findings reveal homogeneous distribution of elements on the surface of the GZnTi photocatalyst.
3.2 Photocatalyst performance
| Catalyst | Concentration (mg L−1) and volume (mL) of phenol | Catalyst amount g L−1 | Degradation (%) | Illumination time (min) | Rate constant (min−1) | Ref. |
|---|---|---|---|---|---|---|
| GO/TiO2 | 14–100 | 1.48 | 100 | 180 | — | 3 |
| rGO/TiO2 | 50–1700 | — | 96 | 180 | 0.0154 | 48 |
| Pure TiO2 | — | — | 62 | 180 | — | 48 |
| MWCNT–TiO2 | 50–800 | 1 | 96 | 300 | 0.0074 | 49 |
| Pt–ZnO | 15 | — | >95 | 540 | — | 50 |
| Fe–S–TiO2 | 20–60 | 1 | 99.4 | 600 | — | 51 |
| CNT/Ce–TiO2 | 50–500 | 0.4 | 94 | 180 | 0.0012 | 6 |
| BiPO4 (H2O2 assisted) | 50–100 | 0.5 + 60 ppm H2O2 | 100 | 240 | 0.037 | 52 |
| Fe3O4–ZnO | −200 | 0.325 | 82.8 | 150 | 0.0108 | 53 |
| ZnO | 50–200 | 1 | 69.75 | 120 | 0.015 | 54 |
| ZnO | 75–100 | 2.5 | 100 | 480 | — | 55 |
| Co–Pd/BiVO4 (air flow through the suspension) | 18.4–100 | 0.8 | 90 | 180 | 0.013 | 56 |
| BiMoO6 | 20–100 | 1 | 90 | 480 | 0.0049 | 57 |
| This study | 60–250 | 0.6 | 100 | 160 | 0.0124 |
![[thin space (1/6-em)]](https://www.rsc.org/images/entities/char_2009.gif) :
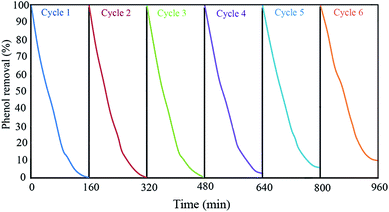
:![[thin space (1/6-em)]](https://www.rsc.org/images/entities/char_2009.gif) 1 volume ratio) to remove the phenol and its intermediate products on their pores and surfaces. Then, the mixture was dried at 80 °C for 2 h. This sequence was repeated for six times to find the Ph-degradation efficiency of each cycle. The results demonstrated in Fig. 9 indicate that the Ph-degradation efficiency was maintained within the range of 90–100% after six cycles, and showed good stability and recyclability for GZnTi. The photocatalytic activity reduction of GZnTi from 100% to 90.2% after six cycles could be explained by loss of catalyst during the washing process, shrinkage of the pore volume, and reduction of the BET specific area.19
1 volume ratio) to remove the phenol and its intermediate products on their pores and surfaces. Then, the mixture was dried at 80 °C for 2 h. This sequence was repeated for six times to find the Ph-degradation efficiency of each cycle. The results demonstrated in Fig. 9 indicate that the Ph-degradation efficiency was maintained within the range of 90–100% after six cycles, and showed good stability and recyclability for GZnTi. The photocatalytic activity reduction of GZnTi from 100% to 90.2% after six cycles could be explained by loss of catalyst during the washing process, shrinkage of the pore volume, and reduction of the BET specific area.19
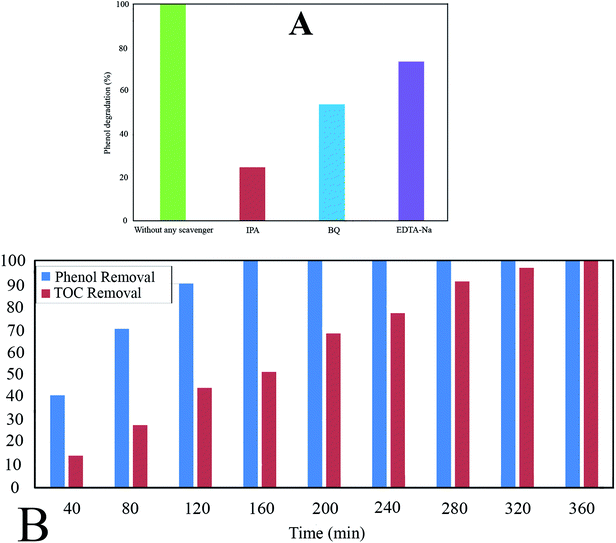
The Ph-degradation efficiency for different radical scavengers is exhibited in Fig. 10A. As can be seen, the Ph-degradation rates in the presence of ·OH, ·O2− and h+ scavengers were found to be 24.75, 53.82, and 73.65, respectively. Accordingly, the dominancy order of species was: ·OH>·O2− > h+, indicating that Ph-degradation process was mainly controlled by hydroxyl radicals.
The experimental results reveal that TOC removal rate rises to 100% after 360 min, while the Ph-degradation rate reaches 100% after 160 min (Fig. 10B). The difference between TOC and Ph-degradation can be ascribed to decomposition of phenol molecules to the intermediate by-products.
| Kinetics model | Initial concentration (ppm) | Regression coefficient (R2) | Rate constant (min−1) |
|---|---|---|---|
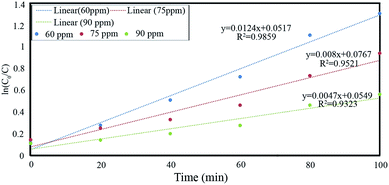
| Pseudo first order, ln[C0/C] = −kt | 60 | 0.9859 | 0.0124 |
| 75 | 0.9521 | 0.008 | |
| 90 | 0.9323 | 0.0047 |
 of the system used in this investigation could be estimated from the following equation:60
 | (5) |
 of Ph-degradation kinetic model. EEOs of photocatalysis process for various phenol concentrations of 60, 75, and 90 ppm were found to be 0.46, 0.72, and
  respectively. Accordingly, the electrical energy price is 8.22 euro cent per kW h in European Nation market in 2017 for industrial plants. Hence, the contribution to price of water treatment regarding electricity consumption rate will be estimated as 3.82, 5.92, and 10.07 euro per m3, respectively. From the obtained calculations, it could be concluded that utilization of GZnTi for photocatalytic decontamination of phenol under visible irradiation is a low-cost and effective process compared to other conventional methods.
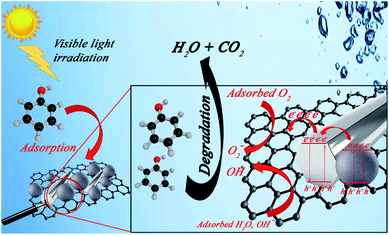 | ||
| Fig. 12 Tentative photocatalytic Ph-degradation mechanism under visible light irradiation using GZnTi. | ||
The created electrons and holes are trapped by O2 and H2O molecules, generating highly active peroxide and hydroxyl radicals, respectively. Therefore, the generated radicals attack the organic pollutants such as phenol molecules and oxidize them to intermediate by-products, which are finally mineralized to CO2 and H2O.38
| Parameter | Value range | Average |
|---|---|---|
| Total COD (mg L−1) | 1135–1684 | 1410 |
| BOD5 (mg L−1) | 60–112 | 86 |
| BOD5/COD | — | 0.061 |
| TOC (mg L−1) | 737–1043 | 890 |
| Turbidity (NTU) | 11–19 | 15 |
| TDS (mg L−1) | 1309–1851 | 1580 |
| TSS (mg L−1) | 125–198 | 162 |
| pH | 6.6–7.8 | 7.2 |
| Model | Value |
|---|---|
| PFO | |
| K1 (min−1) | 0.0217 |
| qe cal (mg g−1) | 7.62 |
| R2 | 0.9156 |
![[thin space (1/6-em)]](https://www.rsc.org/images/entities/char_2009.gif) |
|
| PSO | |
| K2 (mg g−1 min−1) | 1.6366 × 10⁻⁴ |
| qe cal (mg g−1) | 140.84 |
| R2 | 0.9513 |
![[thin space (1/6-em)]](https://www.rsc.org/images/entities/char_2009.gif) |
|
| Intra-particle diffusion | |
| Kid (mg g−1 min−0.5) | 11.162 |
| R2 | 0.8358 |
![[thin space (1/6-em)]](https://www.rsc.org/images/entities/char_2009.gif) |
|
| Freundlich | |
| N | 4.468 |
| Kf (mg g−1 (L mg−1)−1/n) | 55.37 |
| R2 | 0.8836 |
![[thin space (1/6-em)]](https://www.rsc.org/images/entities/char_2009.gif) |
|
| Langmuir | |
| qmax (mg g−1) | 121.95 |
| KL (L mg−1) | 0.322 |
| R2 | 0.9893 |
4 Conclusion
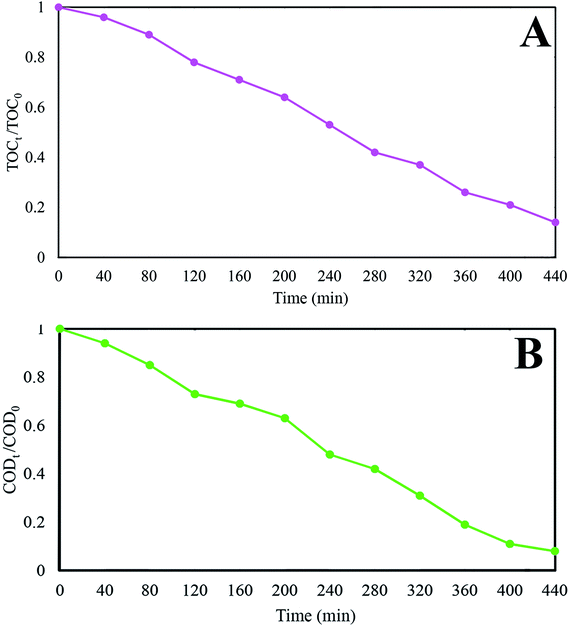
In this investigation, visible light active GZnTi ternary nanocomposites were successfully prepared with different weight ratios of GO. They were confirmed via XRD, Raman, FT-IR, BET, UV-Vis DRS, EIS, TGA, FESEM, EDX, and EDS analysis. According to the obtained findings, GO in the GZnTi nanocomposite was effectively reduced through the synthesis process. Furthermore, presence of ZnO nanorods was detected via FESEM micrographs. Compared to pure titania, within corporation of GO and ZnO, the band gap value diminished, BET surface area increased, and the recombination rate of charges dropped. The catalytic performance of as-prepared ternary nanocomposites was evaluated by Ph-degradation under visible light irradiation. According to the experiments, the GZnTi nanocomposite demonstrated complete degradation of phenol when the GO content was 7.5 wt%, pH value was 4, photocatalyst dosage was 0.6 g L−1, phenol concentration was 60 ppm, light intensity was 150 W, and reaction time was 160 min. Furthermore, based on the electrical energy consumption study, 3.81832, 5.9184, and 10.0739 euro/m3 were required for Ph-degradation with a concentration of 60, 75, and 90 ppm, respectively. In addition, quenching experiments revealed that the photocatalytic process via GZnTi catalyst was controlled by highly reactive hydroxyl radicals (·OH). In the end, real petrochemical effluent was effectively treated under visible light irradiation and optimal operational conditions. The TOCt/TOC0 and CODt/COD0 removal ratio was reduced to 14% and 8% after 440 min. Therefore, the obtained results suggest that GZnTi has excellent photocatalytic abilities under visible light for decontamination of non-biodegradable compounds and real effluents.Conflicts of interest
There are no conflicts to declare.References
- A. A. Isari, A. Payan, M. Fattahi, S. Jorfi and B. Kakavandi, Photocatalytic degradation of rhodamine B and real textile wastewater using Fe-doped TiO2 anchored on reduced graphene oxide (Fe-TiO2/rGO): characterization and feasibility, mechanism and pathway studies, Appl. Surf. Sci., 2018, 462, 549–564, DOI:10.1016/j.apsusc.2018.08.133.
- A. Payan, M. Fattahi, S. Jorfi, B. Roozbehani and S. Payan, Synthesis and characterization of titanate nanotube/single-walled carbon nanotube (TNT/SWCNT) porous nanocomposite and its photocatalytic activity on 4-chlorophenol degradation under UV and solar irradiation, Appl. Surf. Sci., 2018, 434, 336–350, DOI:10.1016/j.apsusc.2017.10.149.
- R. Shahbazi, A. Payan and M. Fattahi, Preparation, Evaluations and Operating Conditions Optimization of Nano TiO2 over Graphene Based Materials as the Photocatalyst for Degradation of Phenol, J. Photochem. Photobiol., A, 2018, 364, 564–576, DOI:10.1016/j.jphotochem.2018.05.032.
- N. Gholami, B. Ghasemi, B. Anvaripour and S. Jorfi, Enhanced photocatalytic degradation of furfural and a real wastewater using UVC/TiO2 nanoparticles immobilized on white concrete in a fixed-bed reactor, J. Ind. Eng. Chem., 2018, 62, 291–301, DOI:10.1016/j.jiec.2018.01.007.
- H. Znad, K. Abbas, S. Hena and M. R. Awual, Synthesis a novel multilamellar mesoporous TiO2/ZSM-5 for photo-catalytic degradation of methyl orange dye in aqueous media, J. Environ. Chem. Eng., 2018, 6, 218–227, DOI:10.1016/j.jece.2017.11.077.
- N. Shaari, S. H. Tan and A. R. Mohamed, Synthesis and characterization of CNT/Ce-TiO2 nanocomposite for phenol degradation, J. Rare Earths, 2012, 30, 651–658, DOI:10.1016/S1002-0721(12)60107-0.
- S. Jorfi, S. Pourfadakari and B. Kakavandi, A new approach in sono-photocatalytic degradation of recalcitrant textile wastewater using MgO @ zeolite nanostructure under UVA irradiation, Chem. Eng. J., 2018, 343, 95–107, DOI:10.1016/j.cej.2018.02.067.
- I. Oller, S. Malato and J. A. Sánchez-pérez, Science of the total environment combination of advanced oxidation processes and biological treatments for wastewater decontamination – a review, Sci. Total Environ., 2011, 409, 4141–4166, DOI:10.1016/j.scitotenv.2010.08.061.
- M. Antonopoulou, E. Evgenidou, D. Lambropoulou and I. Konstantinou, A review on advanced oxidation processes for the removal of taste and odor compounds from aqueous media, Water Res., 2014, 53, 215–234, DOI:10.1016/j.watres.2014.01.028.
- C. chun Pei, K. K. S. Lo and W. W.-F. Leung, Titanium-Zinc-Bismuth Oxides-Graphene Composite Nanofibers as High-Performance Photocatalyst for Gas Purification, Sep. Purif. Technol., 2017, 184, 205–212, DOI:10.1016/j.seppur.2017.04.016.
- M. Aslam, M. T. Qamar, A. U. Rehman, M. T. Soomro, S. Ali, I. M. I. Ismail and A. Hameed, The evaluation of the photocatalytic activity of magnetic and non-magnetic polymorphs of Fe2O3 in natural sunlight exposure: a comparison of photocatalytic activity, Appl. Surf. Sci., 2018, 451, 128–140, DOI:10.1016/j.apsusc.2018.04.219.
- J. T. Adeleke, T. Theivasanthi, M. Thiruppathi, M. Swaminathan, T. Akomolafe and A. B. Alabi, Photocatalytic degradation of methylene blue by ZnO/NiFe2O4 nanoparticles, Appl. Surf. Sci., 2018, 455, 195–200, DOI:10.1016/j.apsusc.2018.05.184.
- B. Chai, C. Liu, J. Yan, Z. Ren and Z. jun Wang, In situ synthesis of WO3 nanoplates anchored on g-C3N4 Z-scheme photocatalysts for significantly enhanced photocatalytic activity, Appl. Surf. Sci., 2018, 448, 1–8, DOI:10.1016/j.apsusc.2018.04.116.
- J. Chen, J. Xiong, Y. Song, Y. Yu and L. Wu, Synthesis of nitrosobenzene via photocatalytic oxidation of aniline over MgO/TiO2 under visible light irradiation, Appl. Surf. Sci., 2018, 440, 1269–1276, DOI:10.1016/j.apsusc.2018.01.228.
- Z. Bian, J. Zhu, F. Cao, Y. Huo, Y. Lu and H. Li, Solvothermal synthesis of well-defined TiO2 mesoporous nanotubes with enhanced photocatalytic activity, Chem. Commun., 2010, 46, 8451–8453, 10.1039/c0cc02998j.
- W. Han, L. Ren, X. Qi, Y. Liu, X. Wei, Z. Huang and J. Zhong, Synthesis of CdS/ZnO/graphene composite with high-efficiency photoelectrochemical activities under solar radiation, Appl. Surf. Sci., 2014, 299, 12–18, DOI:10.1016/j.apsusc.2014.01.170.
- P. Nuengmatcha, S. Chanthai, R. Mahachai and W. Oh, Dyes and pigments sonocatalytic performance of ZnO/graphene/TiO2 nanocomposite for degradation of dye pollutants (methylene blue, texbrite BAC-L, texbrite BBU-L and texbrite NFW-L) under ultrasonic irradiation, Dyes Pigm., 2016, 134, 487–497, DOI:10.1016/j.dyepig.2016.08.006.
- A. Albert and R. Saleh, Synthesis , characterization and photocatalytic performance of ZnO/TiO2 and ZnO/TiO2/CuO nanocomposite, Mater. Sci. Forum, 2015, 827, 67–72, DOI:10.4028/www.scientific.net/MSF.827.67.
- A. Taufik, A. Albert and R. Saleh, Sol-gel synthesis of ternary CuO/TiO2/ZnO nanocomposites for enhanced photocatalytic performance under UV and visible light irradiation, J. Photochem. Photobiol., A, 2017, 344, 149–162, DOI:10.1016/j.jphotochem.2017.05.012.
- R. Raliya, C. Avery, S. Chakrabarti and P. Biswas, Photocatalytic degradation of methyl orange dye by pristine titanium dioxide, zinc oxide, and graphene oxide nanostructures and their composites under visible light irradiation, Appl. Nanosci., 2017, 7, 253–259, DOI:10.1007/s13204-017-0565-z.
- M. Y. Rafiq, F. Iqbal, F. Aslam, M. Bilal, N. Munir, I. Sultana, F. Ashraf, F. Manzoor, N. Hassan and A. Razaq, Fabrication and characterization of ZnO/MnO2 and ZnO/TiO2 flexible nanocomposites for energy storage applications, J. Alloys Compd., 2017, 729, 1072–1078, DOI:10.1016/j.jallcom.2017.09.253.
- Y. Chang, J. Guo and C. Chen, Double-sided plasmonic Au nanoparticles on Cu-doped ZnO/ZnO heterostructures with enhanced photocatalytic activity, Mater. Lett., 2017, 209, 60–63, DOI:10.1016/j.matlet.2017.07.107.
- X. Li, R. Shen, S. Ma, X. Chen and J. Xie, Graphene-based heterojunction photocatalysts, Appl. Surf. Sci., 2017, 430, 53–107, DOI:10.1016/j.apsusc.2017.08.194.
- Y. Liu, Y. Shi, X. Liu and H. Li, A facile solvothermal approach of novel Bi2S3/TiO2/RGO composites with excellent visible light degradation activity for methylene blue, Appl. Surf. Sci., 2017, 396, 58–66, DOI:10.1016/j.apsusc.2016.11.028.
- G. Tian, Y. Chen, J. Zhou, C. Tian, R. Li, C. Wang and H. Fu, In situ growth of Bi2MoO6 on reduced graphene oxide nanosheets for improved visible-light photocatalytic activity, CrystEngComm, 2014, 16, 842–849, 10.1039/c3ce41999a.
- G. Malekshoar, K. Pal, Q. He, A. Yu and A. K. Ray, Enhanced Solar Photocatalytic Degradation of Phenol with Coupled Graphene-Based Titanium Dioxide and Zinc Oxide, Ind. Eng. Chem. Res., 2014, 53, 18824–18832, DOI:10.1021/ie501673v.
- X. Liu, L. Pan, T. Lv and Z. Sun, Investigation of photocatalytic activities over ZnO-TiO2-reduced graphene oxide composites synthesized via microwave-assisted reaction, J. Colloid Interface Sci., 2013, 394, 441–444, DOI:10.1016/j.jcis.2012.11.047.
- V. Lachom, P. Poolcharuansin and P. Laokul, Preparation, Characterizations and Photocatalytic Activity of a ZnO/TiO2 Nanocomposite sensor, Smart Mater. Struct., 2017, 26, 0–28, DOI:10.1088/1361-665X/aa8886.
- W. Li, X. Liu and H. Li, Hydrothermal synthesis of graphene/Fe3+-doped TiO2 nanowire composites with highly enhanced photocatalytic activity under visible light irradiation, J. Mater. Chem. A, 2015, 3, 15214–15224, 10.1039/c5ta00763a.
- X. Zhang, J. Wang, W. Hu, K. Zhang, B. Sun, G. Tian, B. Jiang, K. Pan and W. Zhou, Facile Strategy to Fabricate Uniform Black TiO2 Nanothorns/Graphene/Black TiO2 Nanothorns Sandwichlike Nanosheets for Excellent Solar-Driven Photocatalytic Performance, ChemCatChem, 2016, 8, 3240–3246, DOI:10.1002/cctc.201600934.
- J. Qin, X. Zhang, C. Yang, M. Cao, M. Ma and R. Liu, ZnO microspheres-reduced graphene oxide nanocomposite for photocatalytic degradation of methylene blue dye, Appl. Surf. Sci., 2016, 392, 196–203, DOI:10.1016/j.apsusc.2016.09.043.
- M. Zamani, M. Rostami, M. Aghajanzadeh, H. Kheiri Manjili, K. Rostamizadeh and H. Danafar, Mesoporous titanium dioxide@ zinc oxide–graphene oxide nanocarriers for colon-specific drug delivery, J. Mater. Sci., 2018, 53, 1634–1645, DOI:10.1007/s10853-017-1673-6.
- M. Sohail, H. Xue, Q. Jiao, H. Li, K. Khan and Y. Zhao, Synthesis of well-dispersed TiO2@reduced graphene oxide (rGO) nanocomposites and their photocatalytic properties, Mater. Res. Bull., 2017, 90, 125–130, DOI:10.1016/j.materresbull.2017.02.025.
- S. Zhu, Y. Dong, X. Xia, X. Liu and H. Li, Synthesis of Mo-doped TiO2 nanowires/reduced graphene oxide composites with enhanced photodegradation performance under visible light irradiation, RSC Adv., 2016, 6, 23809–23815, 10.1039/c5ra24164b.
- Q. Xiang, D. Lang, T. Shen and F. Liu, Graphene-modified nanosized Ag3PO4 photocatalysts for enhanced visible-light photocatalytic activity and stability, Appl. Catal., B, 2015, 162, 196–203, DOI:10.1016/j.apcatb.2014.06.051.
- Y. Chen, G. Tian, G. Mao, R. Li, Y. Xiao and T. Han, Facile synthesis of well-dispersed Bi2S3 nanoparticles on reduced graphene oxide and enhanced photocatalytic activity, Appl. Surf. Sci., 2016, 378, 231–238, DOI:10.1016/j.apsusc.2016.03.194.
- M. S. Takriff, M. M. Ba-abbad, A. A. H. Kadhum, A. B. Mohamad and K. Sopian, Solar Photocatalytic Degradation of 2,4-Dichlorophenol by TiO2 Nanoparticle Prepared by Sol-Gel Method, Adv. Mater. Res., 2011, 233–235, 3032–3035, DOI:10.4028/www.scientific.net/AMR.233-235.3032.
- P. Nuengmatcha, S. Chanthai, R. Mahachai and W.-C. Oh, Visible light-driven photocatalytic degradation of rhodamine B and industrial dyes (texbrite BAC-L and texbrite NFW-L) by ZnO-graphene-TiO2 composite, J. Environ. Chem. Eng., 2016, 4, 2170–2177, DOI:10.1016/j.jece.2016.03.045.
- N. Yang, Y. Liu, H. Wen, Z. Tang, H. Zhao, Y. Li and D. Wang, Photocatalytic properties of graphdiyne and graphene modified TiO2: from theory to experiment, ACS Nano, 2013, 7, 1504–1512, DOI:10.1021/nn305288z.
- V. Iliev, D. Tomova and L. Bilyarska, Promoting the oxidative removal rate of 2,4-dichlorophenoxyacetic acid on gold-doped WO3/TiO2/reduced graphene oxide photocatalysts under UV light irradiation, J. Photochem. Photobiol., A, 2018, 351, 69–77, DOI:10.1016/j.jphotochem.2017.10.022.
- W. Li, F. Wang, S. Feng, J. Wang, Z. Sun, B. Li, Y. Li, J. Yang, A. A. Elzatahry, Y. Xia and D. Zhao, Sol-gel design strategy for ultradispersed TiO2 nanoparticles on graphene for high-performance lithium ion batteries, J. Am. Chem. Soc., 2013, 135, 18300–18303, DOI:10.1021/ja4100723.
- M. Jabeen, M. Ishaq, W. Song, L. Xu, I. Maqsood and Q. Deng, UV-Assisted Photocatalytic Synthesis of ZnO-Reduced Graphene Oxide Nanocomposites with Enhanced Photocatalytic Performance in Degradation of Methylene Blue, ECS J. Solid State Sci. Technol., 2017, 6, M36–M43, DOI:10.1149/2.0231704jss.
- P. Nuengmatcha, S. Chanthai, R. Mahachai and W. C. Oh, Visible light-driven photocatalytic degradation of rhodamine B and industrial dyes (texbrite BAC-L and texbrite NFW-L) by ZnO-graphene-TiO2 composite, J. Environ. Chem. Eng., 2016, 4, 2170–2177, DOI:10.1016/j.jece.2016.03.045.
- M. Maleki and M. Haghighi, Sono-dispersion of CuS-CdS over TiO2 in one-pot hydrothermal reactor as visible-light-driven nanostructured photocatalyst, J. Mol. Catal. A: Chem., 2016, 424, 283–296, DOI:10.1016/j.molcata.2016.08.036.
- N. Prabhakarrao, M. R. Chandra and T. S. Rao, Synthesis of Zr doped TiO2/reduced graphene oxide (rGO) nanocomposite material for efficient photocatalytic degradation of Eosin Blue dye under visible light irradiation, J. Alloys Compd., 2017, 694, 596–606, DOI:10.1016/j.jallcom.2016.09.329.
- A. Khataee, B. Kayan, P. Gholami, D. Kalderis and S. Akay, Sonocatalytic degradation of an anthraquinone dye using TiO2-biochar nanocomposite, Ultrason. Sonochem., 2017, 39, 120–128, DOI:10.1016/j.ultsonch.2017.04.018.
- M. Ahmadi, B. Kakavandi, N. Jaafarzadeh and A. Akbar Babaei, Catalytic ozonation of high saline petrochemical wastewater using PAC@FeIIFe2IIIO4: optimization, mechanisms and biodegradability studies, Sep. Purif. Technol., 2017, 177, 293–303, DOI:10.1016/j.seppur.2017.01.008.
- H. Adamu, P. Dubey and J. A. Anderson, Probing the role of thermally reduced graphene oxide in enhancing performance of TiO2 in photocatalytic phenol removal from aqueous environments, Chem. Eng. J., 2016, 284, 380–388, DOI:10.1016/j.cej.2015.08.147.
- W. Wang, P. Serp, P. Kalck and J. L. Faria, Visible light photodegradation of phenol on MWNT-TiO2 composite catalysts prepared by a modified sol-gel method, J. Mol. Catal. A: Chem., 2005, 235, 194–199, DOI:10.1016/j.molcata.2005.02.027.
- N. Morales-Flores, U. Pal and E. Sánchez Mora, Photocatalytic behavior of ZnO and Pt-incorporated ZnO nanoparticles in phenol degradation, Appl. Catal., A, 2011, 394, 269–275, DOI:10.1016/j.apcata.2011.01.011.
- Y. Niu, M. Xing, J. Zhang and B. Tian, Visible light activated sulfur and iron co-doped TiO2 photocatalyst for the photocatalytic degradation of phenol, Catal. Today, 2013, 201, 159–166, DOI:10.1016/j.cattod.2012.04.035.
- Y. Liu, Y. Zhu, J. Xu, X. Bai, R. Zong and Y. Zhu, Degradation and mineralization mechanism of phenol by BiPO4 photocatalysis assisted with H2O2, Appl. Catal., B, 2013, 142–143, 561–567, DOI:10.1016/j.apcatb.2013.05.049.
- X. Feng, H. Guo, K. Patel, H. Zhou and X. Lou, High performance, recoverable Fe3O4-ZnO nanoparticles for enhanced photocatalytic degradation of phenol, Chem. Eng. J., 2014, 244, 327–334, DOI:10.1016/j.cej.2014.01.075.
- H. Benhebal, M. Chaib, T. Salmon, J. Geens, A. Leonard, S. D. Lambert, M. Crine and B. Heinrichs, Photocatalytic degradation of phenol and benzoic acid using zinc oxide powders prepared by the sol-gel process, Alexandria Eng. J., 2013, 52, 517–523, DOI:10.1016/j.aej.2013.04.005.
- S. K. Pardeshi and A. B. Patil, A simple route for photocatalytic degradation of phenol in aqueous zinc oxide suspension using solar energy, Sol. Energy, 2008, 82, 700–705, DOI:10.1016/j.solener.2008.02.007.
- K. Zhang, Y. Liu, J. Deng, S. Xie, X. Zhao, J. Yang, Z. Han and H. Dai, Co–Pd/BiVO4: high-performance photocatalysts for the degradation of phenol under visible light irradiation, Appl. Catal., B, 2018, 224, 350–359, DOI:10.1016/j.apcatb.2017.10.044.
- W. Yin, W. Wang and S. Sun, Photocatalytic degradation of phenol over cage-like Bi2MoO6 hollow spheres under visible-light irradiation, Catal. Commun., 2010, 11, 647–650, DOI:10.1016/j.catcom.2010.01.014.
- M. Adams, I. Campbell, C. McCullagh, D. Russell, D. W. Bahnemann and P. K. J. Robertson, From ideal reactor concepts to reality: the novel drum reactor for photocatalytic wastewater treatment, Int. J. Chem. React. Eng., 2013, 11, 621–632, DOI:10.1515/ijcre-2012-0012.
- E. B. Simsek, B. Kilic, M. Asgin and A. Akan, photocatalytic performance for bisphenol-A, ibuprofen and flurbiprofen, J. Ind. Eng. Chem., 2017, 59, 115–126, DOI:10.1016/j.jiec.2017.10.014.
- A. R. Khataee, M. Zarei and R. Ordikhani-Seyedlar, Heterogeneous photocatalysis of a dye solution using supported TiO2 nanoparticles combined with homogeneous photoelectrochemical process: molecular degradation products, J. Mol. Catal. A: Chem., 2011, 338, 84–91, DOI:10.1016/j.molcata.2011.01.028.
- F. J. Beltrán, M. González and J. F. González, Industrial wastewater advanced oxidation part 1. UV radiation in the presence and absence of hydrogen peroxide, Water Res., 1997, 31, 2405–2414, DOI:10.1016/S0043-1354(97)00077-8.
- S. Jorfi, B. Kakavandi, H. R. Motlagh, M. Ahmadi and N. Jaafarzadeh, A novel combination of oxidative degradation for benzotriazole removal using TiO2 loaded on FeIIFe2IIIO4@C as an efficient activator of peroxymonosulfate, Appl. Catal., B, 2017, 219, 216–230, DOI:10.1016/j.apcatb.2017.07.035.
- S. Jorfi, G. Barzegar, M. Ahmadi, R. Darvishi Cheshmeh Soltani, N. Alah Jafarzadeh Haghighifard, A. Takdastan, R. Saeedi and M. Abtahi, Enhanced coagulation-photocatalytic treatment of acid red 73 dye and real textile wastewater using UVA/synthesized MgO nanoparticles, J. Environ. Manage., 2016, 177, 111–118, DOI:10.1016/j.jenvman.2016.04.005.
- B. Kakavandi, M. Jahangiri-Rad, M. Rafiee, A. R. Esfahani and A. A. Babaei, Development of response surface methodology for optimization of phenol and p-chlorophenol adsorption on magnetic recoverable carbon, Microporous Mesoporous Mater., 2016, 231, 192–206, DOI:10.1016/j.micromeso.2016.05.033.
- E. Karimi Pasandideh, B. Kakavandi, S. Nasseri, A. H. Mahvi, R. Nabizadeh, A. Esrafili and R. Rezaei Kalantary, Silica-coated magnetite nanoparticles core-shell spheres (Fe3O4@SiO2) for natural organic matter removal, J. Environ. Health Sci. Eng., 2016, 14, 1–13, DOI:10.1186/s40201-016-0262-y.
- A. J. Jafari, B. Kakavandi, R. R. Kalantary, H. Gharibi, A. Asadi, A. Azari, A. A. Babaei and A. Takdastan, Application of mesoporous magnetic carbon composite for reactive dyes removal: Process optimization using response surface methodology, Korean J. Chem. Eng., 2016, 33, 2878–2890, DOI:10.1007/s11814-016-0155-x.
- A. A. Babaei, B. Kakavandi, M. Rafiee, F. Kalantarhormizi, I. Purkaram, E. Ahmadi and S. Esmaeili, Comparative treatment of textile wastewater by adsorption, Fenton, UV-Fenton and US-Fenton using magnetic nanoparticles-functionalized carbon (MNPs@C), J. Ind. Eng. Chem., 2017, 56, 163–174, DOI:10.1016/j.jiec.2017.07.009.
- M. Ahmadi, M. Hazrati Niari and B. Kakavandi, Development of maghemite nanoparticles supported on cross-linked chitosan (γ-Fe2O3@CS) as a recoverable mesoporous magnetic composite for effective heavy metals removal, J. Mol. Liq., 2017, 248, 184–196, DOI:10.1016/j.molliq.2017.10.014.
Footnote |
| † Electronic supplementary information (ESI) available. See DOI: 10.1039/c8ra07936f |
| This journal is © The Royal Society of Chemistry 2018 |

