 Open Access Article
Distance-regulating surface plasmon catalyzed coupling reaction of p-nitrophenyl disulfide
Long Yua,
Shiwei Wuac,
Yu Liua,
Peng Song *b and
Lixin Xia
 *a
*a
aCollege of Chemistry, Liaoning University, Shenyang 110036, China. E-mail: lixinxia@lnu.edu.cn
bCollege of Physical, Liaoning University, Shenyang 110036, China. E-mail: songpeng@lnu.edu.cn
cExperimental Center of Shenyang Normal University, Shenyang 110034, China
First published on 18th October 2018
Abstract
In this study, we attempted to regulate the intermolecular distance of PNTP molecules on the surface of silver foil by breaking the S–S bond of NPDS. Though changing the laser wavelength and power, SERS conditions, the Raman spectra of NPDS and PNTP with different concentrations were compared. We found that, under SERS conditions, NPDS converted more efficiently than PNTP to DMAB at low-concentration with low-power and low-energy irradiation. The results indicate that the distance between molecules plays a significant role in the reaction of PNTP to form DMAB.
1 Introduction
In the past decade, the development of surface-enhanced Raman spectroscopy (SERS) has provided an effective means to study single-molecule behavior.1–14 Researchers in plasma chemistry have also applied the average enhancement effect of SERS to the theoretical analysis of hot particles with particle enhancement and particle coupling hotspots. Plasma excitation not only drives chemical reactions, but also cleaves specific chemical bonds using hot electrons as nanometer scissors. There were a number of similar reports published in 2010 and 2011 on the production of p,p′-dimercaptoazobenzene (DMAB) from p-nitrothiophenol (PNTP) under SERS conditions confirmed by plasmon-assisted catalytic reactions.10–13 In addition, there are many reports on the factors affecting the formation of DMAB from PNTP by surface plasma catalysis.14–19 The factors explored in these reports include liquid phase pH, solvent, laser wavelength and laser power. However, the influence of intermolecular distance on plasmon-assisted catalysis under SERS conditions has rarely been reported.Based on the above considerations, we chose p-nitrophenyl disulfide (NPDS) and PNTP molecules for the regulation of intermolecular distances in this study. The NPDS will dissociate from the surface of the silver foil to form PNTP molecules, which combine with silver to form PNTP-Ag.20–22 The PNTP-Ag formed from NPDS is produced after cleavage of the disulfide bond, bringing the distance between two PNTP-Ag molecules closer (the distance of a molecular bond), therefore regulation of the intermolecular distance is achieved. In addition, comparative experiments on concentration, wavelength, and power were conducted. The experimental results showed that the close distance between the PNTP-Ag molecules was beneficial in the plasmon-assisted catalytic reaction, and that reduction of the intermolecular distance improved the efficiency of the coupling reaction.
2 Materials and experimental methods
Chemical reagents, including NPDS, PNTP, absolute ethanol and silver foil (>99.99%), were analytically pure and used without further treatment or purification. All solutions were prepared using absolute ethanol.The ethanol solution of the test sample was dropped onto 0.3 × 0.3 mm silver foil, dried, and subjected to Raman testing. The experimental conditions were 532 and 633 nm light sources, and the center point was 1300 cm−1 for 1 s. All samples were analyzed using a Renishaw in Via confocal Raman spectrometer (UK).
3 Results and discussion
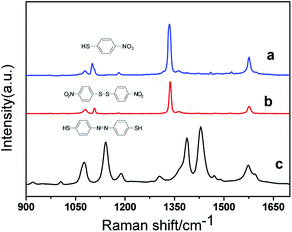
Fig. 1 compares the normal Raman spectra of NPDS, PNTP and DMAB (formed from PNTP) solid powder samples over the range of 900–1700 cm−1. The spectrum of PNTP (Fig. 1(a)) contains three characteristic Raman peaks at 1099, 1336, and 1574 cm−1. The peak at 1336 cm−1 has been confirmed to be due to vibration of the nitro group and the peak at 1099 cm−1 is considered to be due to vibration of the sulfur–carbon bond. The peak at 1574 cm−1 is assigned to vibration of the carbon–carbon skeleton in the benzene ring.23,24 It can be seen that the Raman spectra of NPDS (Fig. 1(b)) and PNTP (Fig. 1(a)) are very similar, and the same three peaks appear at almost the same Raman shifts. This is a consequence of the very similar molecular structures of PNTP and NPDS. After cleavage of the S–S bond in NPDS, combination with hydrogen forms two PNTP molecules. In the spectrum of DMAB (Fig. 1(c)) there are three strong peaks at 1140, 1390, and 1432 cm−1. The Raman peaks at 1140 and 1198 cm−1 are due to C–H bending and C–N stretching vibrational modes. The peak at 1140 cm−1 has a greater contribution from the C–N stretching vibration, so the intensity of the peak is larger. The peaks at 1390 and 1432 cm−1 are mainly due to N![[double bond, length as m-dash]](https://www.rsc.org/images/entities/char_e001.gif) N stretching and in-plane stretching of the benzene ring.25–34
N stretching and in-plane stretching of the benzene ring.25–34
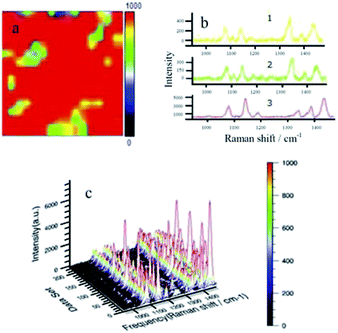
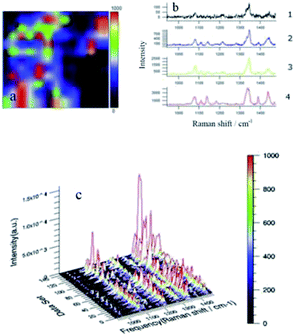
Fig. 2(a) is a surface scan image of the Raman peak at 1432 cm−1 using software provided by Raman spectroscopy. It can clearly be seen that most of the image is displayed in red, with small amounts of green and yellow appearing locally (plaques, which indicate a significant response in most areas of the face sweep). Fig. 2(b1) shows that the three typical peaks of the yellow region are 1140, 1390, and 1432 cm−1, corresponding to DMAB, but the peak intensities are weak (<400) indicating that the N![[double bond, length as m-dash]](https://www.rsc.org/images/entities/char_e001.gif) N coupling reaction does occur. Fig. 2(b2) shows the spectrum of the green area. Compared to the yellow area, the intensities of the three characteristic peaks are similar, and there are many peaks and burrs. Fig. 2(b3) shows the spectrum of the red area. Compared to the yellow and green areas, the spectrum is much smoother, representing the three typical peaks due to DMAB, and the nitro peak at 1336 cm−1 is almost absent, indicating that the reaction of NPDS is more extensive. Fig. 2(c) shows a 3D image of the Raman spectrum of all points in the surface sweep of the silver foil. From this graph, it is more easily observed that the NPDS reaction is more extensive, the baseline is smooth, and the characteristic peaks are clear. The peak height is uniform and evenly arranged in a mountain shape with a maximum peak height of about 6000 a.u.
N coupling reaction does occur. Fig. 2(b2) shows the spectrum of the green area. Compared to the yellow area, the intensities of the three characteristic peaks are similar, and there are many peaks and burrs. Fig. 2(b3) shows the spectrum of the red area. Compared to the yellow and green areas, the spectrum is much smoother, representing the three typical peaks due to DMAB, and the nitro peak at 1336 cm−1 is almost absent, indicating that the reaction of NPDS is more extensive. Fig. 2(c) shows a 3D image of the Raman spectrum of all points in the surface sweep of the silver foil. From this graph, it is more easily observed that the NPDS reaction is more extensive, the baseline is smooth, and the characteristic peaks are clear. The peak height is uniform and evenly arranged in a mountain shape with a maximum peak height of about 6000 a.u.
Analysis of Fig. 2 revealed that a hot spot was formed when the laser irradiated the silver nanoparticles and the magnetic field was enhanced. The NPDS was converted to DMAB under laser irradiation. However, due to the unevenness of the surface of the silver film, NPDS may be dispersed and accumulated locally on the silver film during evaporation of the solvent. The yellow, green and red areas appearing in the figure are caused by different local concentrations of NPDS. The concentration of NPDS on the silver foil protrusions is lower. The large red region is a flat area, which indicates that the conversion of NPDS to DMAB is affected by the concentration in agreement with previous reports.
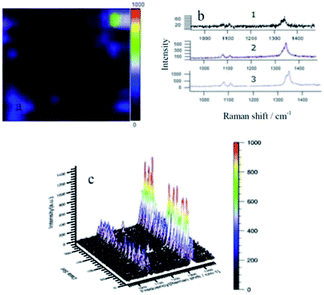
In Fig. 3(a) the entire area is dominated by dark tones, with a small number of blue and dark purple patches that are caused by high and low areas of the silver film. Fig. 3(b) shows normal Raman spectra of representative points in each color region of the mapping graph. Fig. 3(b1) is the Raman spectrum of black representative points in the sweep area, in which the entire trace has many burrs and the peak intensity is extremely low. The only Raman peak, representing the nitro group, appeared at 1336 cm−1 at low intensity (<60). None of the three Raman characteristic peaks of DMAB were present, indicating that reaction did not occur. Fig. 3(b2) is a spectrum of representative points of the dark purple areas. The trace contrasts with the black region in that it is relatively smooth. The nitro peak at 1336 cm−1 is still evident, while two small peaks appearing at around 1100 cm−1 are considered to be due to vibration of the S–C bond. Fig. 3(b3) is a spectrum of representative points of the light blue region. The trace is smoother than those from the black and dark purple regions, and the peak intensity is further amplified, but there are still no other characteristic peaks. This indicates that PNTP is not converted to DMAB. Fig. 3(c) is a three-dimensional (3D)Raman spectrum of all points in the sweep area. It is apparent that there are no other peaks in the entire sweeping area. Only a row of higher intensity nitro peaks appeared at 1336 cm−1, and two rows of low intensity S–C bond vibration peaks appeared at 1100 cm−1.
From analysis of Fig. 3, PNTP is not converted to DMAB under laser irradiation, even though the concentration of PNTP is 100 times higher than that of NPDS. This suggests that cleavage of the S–S bond of NPDS results in a close distance between adjacent PNTP molecules, which has a greater influence on the reaction than simply increasing the PNTP concentration.
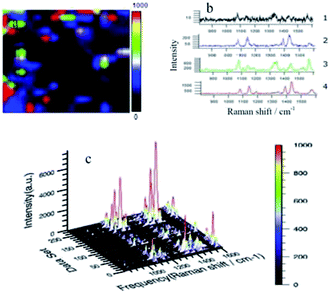
In Fig. 4(a), the black area is significantly reduced compared with Fig. 3(a) over the whole area, and bright areas of blue, green and red are clearly increased. This indicates that changing the wavelength from 633 to 532 nm promotes the reaction. Fig. 4(b1) is the Raman spectrum of black representative points in the sweep area. The spectrum appears as an irregular curve, with no obvious Raman characteristic peaks, and the peak intensity is very low. Fig. 4(b3) is a spectrum of representative points of the green areas. Compared with the blue region (Fig. 4(b2)), the curve is smoother and noise interference is reduced. In addition to the typical peaks seen in the blue region, a more pronounced nitro peak at 1336 cm−1 is present, and the peak intensity is further enhanced. Fig. 4(b4) is a spectrum of representative points of the red areas. Compared with the green region (Fig. 4(b3)), the curve is smoother, peak shape and peak position are clearer, and the nitro peak at 1336 cm−1 almost disappears. The three typical peaks for DMAB at 1140, 1390 and 1432 cm−1 are more obvious, indicating greater conversion of PNTP to DMAB in the red region. From this graph, it is apparent that there is greater conversion of PNTP, the baseline is smooth and the characteristic peaks are clear, with the highest peak intensity of about 7000 a.u.
In Fig. 4, the laser wavelength was changed from 633 to 532 nm. At higher laser energy, the conversion of PNTP to DMAB was significantly improved compared with Fig. 3. The result shows that a laser wavelength of 532 nm promotes the reaction more than a wavelength of 633 nm. However, compared with Fig. 2, the reaction of NPDS at 633 nm is still better, which once again demonstrates that regulation of the intermolecular distance has a great impact on the reaction.
Fig. 5 shows the Raman spectrum of PNTP on a silver foil surface at a concentration of 10−3 M, a wavelength of 633 nm and a laser power of 0.5%. Fig. 5(a) is a surface scan image of the Raman peak at 1432 cm−1 using software provided by Raman spectroscopy. The black area is significantly reduced over the entire area compared to Fig. 3 and 4, while the three bright blue, green and red regions occupy most of the area. Fig. 5(b1) is a spectrum of representative points of the black areas. The entire spectrum contains only two weak peaks, at 1080 and 1336 cm−1, and the peak intensity over the whole spectrum is extremely weak. It was concluded that hardly any reaction occurred. Fig. 5(b2) is a spectrum of representative points from the blue areas. The peaks at 1080 and 1336 cm−1 are clearer, while the three typical peaks for DMAB at 1140, 1390 and 1432 cm−1 are also present. This indicates that reaction occurred in this region, but the weak peak intensity suggests that the reaction was not extensive. Fig. 5(b3) is a spectrum of representative points from the green areas. Compared to the blue region, the trace is smoother. The three typical DMAB peaks are present, and their intensities are much higher than in the blue region, indicating more reaction. Fig. 5(b4) is a spectrum of representative points from the red areas. The peak shape of the red region is sharper and smoother, and the peak intensities are increased, indicating that the reaction is further enhanced.
From the analysis of Fig. 5, compared to a power of 1% (Fig. 1), increasing the power to 5% enhanced conversion of PNTP to DMAB, and was more effective than the higher energy wavelength of 532 nm (Fig. 4). However, compared to low-concentration, low-power reaction of NPDS (Fig. 1), there is still a gap. Reaction of NPDS occurs over the whole region at low concentration and low power, while the wavelength is the same, and the intensity is far superior to the high-concentration, high-power experiment in Fig. 5. It is clear that control of the intermolecular distance is a major factor influencing the reaction.
4 Conclusions
In this study, we have systematically investigated the effect of distance factors on the plasmon catalyzed coupling reaction of PNTP on the surface of silver. Distance regulation of the coupling reaction was achieved by judicious selection of the reactants. The effects of SERS on the regulatory factors were investigated, as well as other factors affecting the plasmon catalyzed coupling reaction, such as concentration, power, and wavelength of the laser irradiation. The results showed that, of the many influencing factors, the distance between molecules had the greatest influence on the auxiliary catalytic reaction. The reduction of the intermolecular distance effectively increased the efficiency of the coupling reaction.Conflicts of interest
There are no conflicts to declare.Acknowledgements
This work was financially supported by the National Natural Science Foundation of China (Grant no. 11544015), the Innovative Talent Support Program of Liaoning Province (Grant no. LR2017062), the Liaoning Provincial Department of Education Project (Grant no. LFW201710), the Natural Science Foundation of Liaoning Province (Grant no. 201602345), and the Shenyang Natural Science Foundation of China (F15-199-1-04). Liaoning Provincial Department of Education Project (Grant no. L2015200).Notes and references
- J. G. Wang, W. H. Lin, X. F. Xu, F. C. Ma and M. T. Sun, Chem. Rec., 2018, 18, 481–490 CrossRef CAS PubMed.
- M. T. Sun, p. J. Wang, Q. Li, F. C. Ma and H. X. Xu, Light: Sci. Appl., 2013, 2, e112 CrossRef CAS.
- Z. Q. Tian, R. A. Bin and D. Y. Wu, J. Phys. Chem. B, 2002, 106, 9463–9483 CrossRef CAS.
- H. Y. Wu, Y. H. Lai, M. S. Hsieh, S. D. Lin, Y. C. Li and T. W. Lin, Adv. Mater. Interfaces, 2014, 1, 1400119 CrossRef.
- T. T. Tasi, T. W. Lin, L. D. Shao and H. H. Shen, RSC Adv., 2016, 6, 29453–29459 RSC.
- T. W. Lin, T. T. Tasi, P. L. Chang and H. Y. Cheng, ACS Appl. Mater. Interfaces, 2016, 8, 8315–8322 CrossRef CAS PubMed.
- E. Cao, M. T. Sun, Y. Z. Song and W. J. Liang, Nanotechnology, 2018, 29, 372001 CrossRef PubMed.
- S. W. Wu, Y. Liu, C. Q. Ma, J. Wang, Y. Zhang, P. Song and L. X. Xia, Langmuir, 2018, 34, 7240–7247 CrossRef CAS PubMed.
- S. W. Hla and K. H. Rieder, Annu. Rev. Phys. Chem., 2003, 54, 307 CrossRef CAS PubMed.
- E. Betzig and J. K. Trautman, Science, 1992, 257, 189–195 CrossRef CAS PubMed.
- C. J. Chen and R. M. Osgood, Phys. Rev. Lett., 1983, 50, 1705–1708 CrossRef CAS.
- H. Wang and N. J. Halas, Nano Lett., 2006, 6, 2945–2948 CrossRef CAS PubMed.
- J. F. Li, Y. F. Huang, Y. Ding, Z. L. Yang, S. B. Li, X. S. Zhou, F. R. Fan, W. Zhang, Z. Y. Zhou, D. Y. Wu, B. Ren, Z. L. Wang and Z. Q. Tian, Nature, 2010, 464, 392–395 CrossRef CAS PubMed.
- Y. F. Huang, H. P. Zhu, G. K. Liu, D. Y. Wu, B. Ren and Z. Q. Tian, J. Am. Chem. Soc., 2010, 132, 9244–9246 CrossRef CAS PubMed.
- Z. L. Zhang, S. X. Sheng, R. M. Wang and M. T. Sun, Anal. Chem., 2016, 88, 9328–9332 CrossRef CAS PubMed.
- J. L. Wang, I. De Freitas, T. Alves, R. A. Ando, Z. B. Fang and P. Camargo, Chemistry, 2017, 23, 7185–7190 CrossRef CAS PubMed.
- Y. Yin, P. Miao, Y. M. Zhang, J. C. Han, X. H. Zhang, Y. Gong, L. Gu, C. Y. Xu, T. Yao and P. Xu, Adv. Funct. Mater., 2017, 27, 1606694 CrossRef.
- Y. Z. Huang, Y. R. Fang, Z. L. Yang and M. T. Sun, J. Phys. Chem. C, 2010, 114, 18263 CrossRef CAS.
- D. Y. Wu, X. M. Liu, Y. F. Huang, B. Ren, X. Xu and Z. Q. Tian, J. Am. Chem. Soc., 2009, 113, 18212–18222 CAS.
- L. X. Xia, C. Q. Ma, J. Wang, S. W. Wu, Y. Liu, Q. Zhang and P. Song, Chem. Commun., 2017, 53, 9582–9585 RSC.
- L. Cui, X. Ren, X. Z. Yang, P. J. Wang, Y. Q. Qu, W. J. Liang and M. T. Sun, J. Raman Spectrosc., 2016, 47, 877–883 CrossRef CAS.
- W. H. Lin, Y. Q. Cao, P. J. Wang and M. T. Sun, Langmuir, 2017, 33, 12102–12107 CrossRef CAS PubMed.
- W. Lin, X. Ren, L. Cui, H. Zong and M. Sun, Appl. Mater. Today, 2018, 11, 189–192 CrossRef.
- Q. Q. Ding, M. D. Chen, Y. Z. Li and M. T. Sun, Sci. Rep., 2015, 5, 10269 CrossRef CAS PubMed.
- E. Cao, X. Guo, L. Q. Zhang, Y. Shi, W. H. Lin, X. C. Liu, Y. R. Fang, L. Y. Zhou, Y. H. Sun and Y. Z. Song, Adv. Mater. Interfaces, 2017, 4, 1700869 CrossRef.
- J. Wang, J. C. Dong, J. Yang, Y. Wang, C. J. Zhang, M. M. Xu, B. W. Mao, J. L. Yao, J. F. Li and Z. Q. Tian, Electrochem. Commun., 2017, 78, 16–20 CrossRef CAS.
- Y. J. Qi, Y. J. Hu, M. Xie, D. Xing and H. M. Gu, J. Raman Spectrosc., 2011, 42, 1287–1293 CrossRef CAS.
- X. R. Tian, L. Chen, H. X. Xu and M. T. Sun, RSC Adv., 2012, 2, 8289–8292 RSC.
- Y. Fang, Z. Zhang and M. Sun, Rev. Sci. Instrum., 2016, 87, 033104 CrossRef PubMed.
- Z. L. Zhang, P. Xu, X. Z. Yang, W. J. Liang and M. T. Sun, J. Photochem. Photobiol., C, 2016, 27, 100–112 CrossRef CAS.
- J. L. Wang, R. A. Ando and P. H. Camargo, Angew. Chem., 2015, 54, 6909 CrossRef CAS PubMed.
- L. Papa, I. C. D. Freitas, R. S. Geonmonond, C. B. D. Aquino, J. C. Pieretti, S. H. Domingues, R. A. Ando and P. H. C. Camargo, J. Mater. Chem. A, 2017, 5, 11720–11729 RSC.
- H. Feilchenfeld and M. J. Weaver, J. Phys. Chem., 2002, 93, 4276–4282 CrossRef.
- Y. R. Fang, Y. Z. Li, H. X. Xu and M. T. Sun, Langmuir, 2010, 26, 7737–7746 CrossRef CAS PubMed.
| This journal is © The Royal Society of Chemistry 2018 |

