DOI:
10.1039/C8RA07759B
(Paper)
RSC Adv., 2018,
8, 41920-41937
Synthesis of a biodegradable interpenetrating polymer network of Av-cl-poly(AA-ipn-AAm) for malachite green dye removal: kinetics and thermodynamic studies
Received
18th September 2018
, Accepted 29th November 2018
First published on 14th December 2018
Abstract
This paper deals with the synthesis of a biodegradable interpenetrating polymer network (IPN) from the natural polysaccharide aloe vera (Av), acrylamide (AAm) and acrylic acid (AA), and its evaluation as a dye removal device. In the synthesis of Av-cl-poly(AA-ipn-AAm), ammonium persulfate (APS) was used as an initiator, N,N′-methylene bisacrylamide (MBA) as a cross-linker, AA and AAm as primary and secondary monomers, respectively. Soil burial and composting methods were used to study the biodegradability of the synthesized IPN and the results showed 94% degradation within 70 days using the composting method and 86% degradation within 77 days using the soil burial method. Biodegradation was confirmed by Fourier transform infrared spectroscopy (FTIR) and scanning electron microscopy (SEM) techniques. The synthesized IPN was used as a device for the removal of malachite green (MG) dye from aqueous solution. The maximum MG removal capacity of the synthesized IPN was found to be 97.3% under the optimal conditions (i.e. time = 180 min., pH = 4.5, adsorbent dose = 5 g L−1). The adsorption kinetics of malachite green molecules onto synthesized IPN was studied and compared using pseudo-first-order and pseudo-second-order models and we found that the adsorption process is better represented by the pseudo-second-order model. The different adsorption isotherm models like Langmuir, Freundlich, Dubinin–Radushkevich, Temkin, Redlich–Peterson and Sips isotherms were studied. The best-fitting isotherm model for the present experiment is the Langmuir model.
1. Introduction
Different pollutants like noxious metal ions, dyes, phenols, insect repellents, which are used in agricultural practices and aromatic compounds present in wastewater affect our environment and have a detrimental effect on aquatic animals as well as human beings. The use of synthetic dyes is increasing with the advancement in industrialization and urbanization. Most of the dyes are harmful and oncogenic, causing a harsh ecological impact. Industrial wastewater treatment is therefore of utmost importance in saving our environment1,2 since these dyes not only have a negative effect on human beings and animals but also affect symbiotic processes by disturbing photosynthetic activity.3
Researchers all over the world are interested in the use of economical and eco-friendly sorbents for the removal of harmful dyes from aqueous solution. There are different methods like adsorption, coalescence, membrane separation, oxidation, photocatalytic dilapidation, electrochemical processes and deterioration by microorganisms in the presence or absence of oxygen, which have been employed for the removal of dyes from water. However, adsorption is the most operative and viable process for wastewater treatment because of its great efficacy, easy procedure and non-susceptibility to harmful pollutants.4 There are several adsorbents that are used for the removal of harmful dyes from the aqueous effluents, for example, silica, fly ash, waste banana pith, orange peel, palm fruit bunch, etc. However, no kinetic model has been used to study sorption processes in all these adsorbents, since the sorption process is complicated and is categorized into two main types: physisorption and chemisorption. Physisorption involves weak intermolecular forces like van der Waals and hydrogen bonding interactions between adsorbate and adsorbent. In the chemisorption process, the electrons are covalently bonded or exchanged between adsorbate and adsorbent.5
Hydrogels based on acrylic acid and sodium alginate in the presence of a crosslinker and initiator have been synthesized and used for removing methylene blue dye from aqueous solution.6 A guar gum, acrylic acid and aniline-based IPN was prepared and assessed for its conductivity, antibacterial and dye adsorption properties and also for the removal of methylene blue dye from wastewater.7 Hydrogels based on poly(methacrylic acid), N,N-methylenebisacrylamide and 2,2-azobis-[2-(2-imidazolin-2-yl)propane]dihydrochloride were synthesized were used for the removal of basic yellow 28.8
Poly(acrylic acid-acrylamide) hydrogel was synthesized by the frontal polymerization technique and was used for the removal of crystal violet and basic magenta dyes.9 The removal of crystal violet dye from its aqueous solution with the help of sodium dodecyl sulphate-treated NiFe2O4 magnetic nanoparticles and its adsorption kinetics has been studied in accordance with the pseudo-second-order model.10
Cempedak durian peel was considered to be a worthy adsorbent for acid blue 25 and the effects of various parameters such as contact time, pH, ionic strength, initial concentration and temperature were investigated; the different functional groups present in the cempedak durian peel were characterized using FTIR.11
Artocarpus odoratissimus leaves were investigated and considered to be an active sorbent for the exclusion of noxious crystal violet, malachite green and methylene blue dyes, and analysis was carried out using the Langmuir, Freundlich, Temkin, Dubinin–Radushkevich, Redlich–Peterson and Sips isotherm models.12–15 It was reported that the peels of breadnut, (Artocarpus camansi) and bitter gourd (Momordica charantia) were used as potent adsorbents in the sorption of methylene blue and crystal violet dyes.16,17 The biosorption of methylene blue and methyl violet 2B on breadfruit (Artocarpus altilis) peel and its core was studied and it exhibited 80% dye removal; the Langmuir adsorption isotherm model was best fitted for this.18,19 Adsorption kinetics is significant in the treatment of wastewater as it provides information about the reaction pathways and adsorption mechanisms. Kinetics also describes the solution uptake rate, which indicates the residence time of adsorbate uptake at the interface of the solid and solution.20–22
IPNs are cross-linked, three-dimensional networks of polymeric materials with different functional groups and have high water-swelling characteristics.23 IPNs are superior to hydrogels as they are formed from two different polymeric chains having different characteristics, which enhance the swelling capacity, have better mechanical properties and are stable at high temperature and in a wide pH range. The functional groups present in IPN interact with metal ions/dye molecules, which proves them to be efficient adsorbents; the structure of IPN can be flexibly designed and the properties can be adjusted by altering the type and number of functional groups according to the usage and requirement.24 In the last few years, the development of novel sorbents capable of removing dyes, organic or heavy metal pollutants from wastewaters has been an intensive and popular research field. Various studies have been devoted to the adsorption of cationic dyes by anionic IPN containing weakly acidic or strongly charged groups. The combination of electrostatic interactions with hydrophobic interactions is usually the driving force in the case of cationic organic species.21
Aloe vera (Av) is a wonder drug used by tribal communities but is also used for food, cosmetics, Ayurveda, homeopathic and allopathic medicines.22 Av-based hydrogels have been prepared and characterized for application in the treatment of several types of wounds.23 It has also been evaluated as a natural flocculant24 as well as a drug carrier.25
The present study deals with the synthesis of an interpenetrating polymer network of Av, AA and AAm using APS as an initiator and MBA as a cross-linker. Aloe vera is used as the backbone instead of other polysaccharides because it has high water swelling efficiency, it can be easily grafted with different vinyl monomers and does not have any harsh impact on human health. The vinyl monomers, AA and AAm, enhance the adsorption efficiency of the synthesized IPN. The biodegradability of the synthesized IPN has been studied through the soil burial and composting method. This candidate polymer has been evaluated as a device for dye sorption and is one of the most eco-friendly methods for dye adsorption.
2. Experimental
2.1. Materials and methods
Av was purchased from Kshipra Biotech Pvt. Ltd. APS was received from Avantor Performance Material, India Ltd. MBA, MG dye, AA and AAm were purchased from (Loba Chemie laboratory reagents and fine chemicals).
2.2. Instrumental analysis
IPN synthesis and its biodegradability were confirmed by different techniques including SEM and FTIR. Thermal stability and crystallinity were determined by TGA and XRD, respectively. FTIR spectra of the backbone and synthesized IPN were recorded on a Perkin Elmer spectrophotometer using KBr pellets. Scanning electron micrographs (SEMs) of the backbone and IPN were obtained on JSM 6100. Weighing was done on an electronic balance (LIBROR AEG-220, Shimadzu). The pH of solutions was adjusted using HCl and NaOH.
2.3. Synthesis of Av-AA-co-AAm based IPN [Av-cl-poly(AA-ipn-AAm)]
AA was grafted onto Av in an aqueous medium using APS as an initiator and MBA as a cross-linker. To get the graft copolymer Av (1 g) was taken in a reaction flask containing 4 mL of distilled water and was stirred thoroughly. APS (0.438 × 10⁻² mol L−1) was added followed by the drop by drop addition of AA (1.45 × 10⁻² mol L−1) and MBA (1.1 × 10⁻² mol L−1) to the reaction mixture. The reaction was carried out at 50 °C and pH 7. Stirring was continued until a homogeneous mixture was obtained. The graft copolymer was extracted using slightly hot distilled water and was dried in a hot air oven at 60 °C. The synthesized product was then taken in a flask having a known amount of distilled water, then AAm and AP were added and the mixture kept for 24 h. After 24 h, MBA was added with constant stirring. The product was washed with distilled water and dried in a hot air oven. The sample of known weight was immersed in distilled water and after every 2 h interval, the weight gain of the swollen sample was noted. The percentage swelling (Ps) of the IPN was calculated from the following equation:26,27| |
 | (1) |
where Ws and Wd are the weights of the swollen and dry polymer, respectively.
2.4. Batch adsorption study
Batch experiments were carried out to study the dye adsorption by adding 0.05 g of synthesized IPN and 20.0 mL of (100 ppm) MG dye solution to a 100 mL flask. This flask was agitated at 250 rpm in an orbital shaker. The effect of different parameters like adsorbent dosage, initial dye concentration, contact time, pH and temperature were studied. The dye removal was studied using a UV-Vis spectrophotometer at wavelength λmax of 615 nm. All the dye removal experiments were carried out in triplicate with a blank sample to avoid handling errors. The amount of MG dye adsorbed by the synthesized IPN at equilibrium, qe (mg g−1) was calculated using the equation given below:1,27| |
 | (2) |
where Ci is the initial dye concentration (mg L−1) and Ce is the dye concentration (mg L−1) at equilibrium, respectively; m is the mass of the adsorbent (g) taken and V is the volume of the dye solution (L).
The percentage removal (% R) of the dye was calculated using the equation as follows:
| |
 | (3) |
2.5. Error analysis
The values of the coefficient of determination (R2), the kinetics and adsorption isotherm models were obtained from the experimental data. The value of qe (qe,cal) was predicted from the formulae of different kinetics or isotherm models. The experimental and predicted values of qe were fitted into the equations of various error analysis functions and the smallest value showed the least error. Four types of error analysis (sum of absolute error, chi-square test, average relative error and Marquardt's percent deviation error) were calculated using the equation given below:28,29| |
 | (4) |
| |
 | (5) |
| |
 | (6) |
| |
 | (7) |
N and p are the number of data points in the experiment and the number of parameters of the kinetics, respectively.
2.6. Biodegradation study of the synthesized interpenetrating polymer network
Biodegradation is governed by various factors including the availability of functional groups, which increases hydrophilicity, size, density and molecular weight of the polymer, the number of crystalline and amorphous regions, structural complexity, types of bonds, molecular composition and the form of polymer film, powder and pellet.30
The biodegradability of synthesized IPN was studied through the composting and soil burial method. Compost was collected from the industrial sewerage effluent discharge of NIT Jalandhar, and soil was collected from the garden of the NIT Jalandhar campus. The compost and soil were contained in separate pots. The synthesized IPN samples (1 g) were buried in 3 cm apart in the pot containing compost and soil. All the samples were properly labelled on the outside of the pots. Compost contains large amounts of microbial flora, so the microbial species in the compost were regularly fed with discharge wastewater effluent for the proper growth of the microorganisms and fresh water was used for the soil burial method. The aqueous levels of the pots were maintained such that water just reached the base of the pot and care was taken that effluent was not leached out from the pot. Wastewater effluent was supplemented daily to the dried compost due to evaporation. The pots were covered with aluminum foil and maintained at ambient temperature. The weight of each sample was taken by removing samples at an interval of 7 days, followed by rinsing with water and drying at 50 °C. Percentage degradation (% D) in the form of % wt. loss as a function of the number of days was determined as follows:
| |
 | (8) |
where
Wi = initial weight of the sample;
Wf = final weight of the sample.
31
3. Results and discussion
3.1. Synthesis of Av-cl-poly(AA-ipn-AAm)
Av underwent graft copolymerization with AA in the presence of APS as an initiator. MBA was used as the cross-linker, leading to the formation of Av-cl-poly(AA). The different reaction parameters were pre-optimized with respect to percentage swelling and are given in Table 1. IPN Av-cl-poly(AA-ipn-AAm) was synthesized, and the solvent and secondary monomer (AAm) were optimized with respect to percentage swelling. The AAm concentration decides the rate of reaction as well as swelling efficiency. As the weight ratio of the AAm to Av-cl-poly(AA) increased, the interpenetration of the AAm to Av-cl-poly(AA) also increased, leading to enhanced swelling; when it attained equilibrium maximum swelling was obtained. As shown in Fig. 1a, the maximum percentage swelling (Ps 427%) was obtained at a concentration of 2.81 × 10⁻² mol L−1 of AAm. On further increasing the AAm concentration, no penetration of the AAm occurred and the AAm molecules were homopolymerized and removed from the solution by a simple extraction method; thus, a further increase in the AAm concentration did not increase the percentage swelling and in the case of solvent, maximum Ps (578%) was observed with 25 mL. This can be explained on the basis that the OH− ion concentration was initially sufficient to propagate the polymerization reaction until the optimum concentration was reached, but with the further increase in the amount of solvent (Fig. 1b), the OH− concentration increased causing the termination of the polymerization reaction.
Table 1 Optimization of different reaction parameters for the synthesis of Av-cl-poly(AA)
| S. no |
Av |
Solvent (mL) |
Acrylic acid (mol L−1) |
Cross-linker (mol L−1) |
Initiator (mol L−1) |
Time (min) |
pH |
Temperature (°C) |
Weight obtained (g) |
Percentage swelling (Ps) |
| 1 |
1 g |
4 mL |
10.9284 |
0.1622 |
0.0986 |
30 |
7 |
40 |
2.8537 |
717 |
| 2 |
1 g |
4 mL |
10.9284 |
0.1622 |
0.0986 |
60 |
7 |
40 |
3.1067 |
874 |
| 3 |
1 g |
4 mL |
10.9284 |
0.1622 |
0.0986 |
90 |
7 |
40 |
2.7789 |
812 |
| 4 |
1 g |
4 mL |
10.9284 |
0.1622 |
0.0986 |
120 |
7 |
40 |
2.7693 |
512 |
| 5 |
1 g |
4 mL |
10.9284 |
0.1622 |
0.0986 |
150 |
7 |
40 |
3.127 |
450 |
| 6 |
1 g |
4 mL |
10.9284 |
0.1622 |
0.0986 |
20 |
7 |
40 |
2.8261 |
918 |
| 7 |
1 g |
4 mL |
10.9284 |
0.1622 |
0.0986 |
20 |
7 |
40 |
3.1334 |
730 |
| 8 |
1 g |
4 mL |
10.9284 |
0.1622 |
0.0986 |
20 |
7 |
40 |
2.904 |
678 |
| 9 |
1 g |
4 mL |
10.9284 |
0.1622 |
0.0986 |
20 |
7 |
40 |
2.7801 |
615 |
| 10 |
1 g |
4 mL |
10.9284 |
0.1622 |
0.0986 |
20 |
7 |
40 |
2.8764 |
518 |
| 11 |
1 g |
4 mL |
10.9284 |
0.1622 |
0.0986 |
20 |
3 |
40 |
2.8632 |
498 |
| 12 |
1 g |
4 mL |
10.9284 |
0.1622 |
0.0986 |
20 |
5 |
40 |
3.078 |
570 |
| 13 |
1 g |
4 mL |
10.9284 |
0.1622 |
0.0986 |
20 |
7 |
40 |
3.0473 |
734 |
| 14 |
1 g |
4 mL |
10.9284 |
0.1622 |
0.0986 |
20 |
9 |
40 |
2.9605 |
529 |
| 15 |
1 g |
4 mL |
10.9284 |
0.1622 |
0.0986 |
20 |
11 |
40 |
2.9422 |
483 |
| 16 |
1 g |
4 mL |
10.9284 |
0.1622 |
0.0219 |
20 |
7 |
40 |
2.1776 |
559 |
| 17 |
1 g |
4 mL |
10.9284 |
0.1622 |
0.0438 |
20 |
7 |
40 |
2.1219 |
937 |
| 18 |
1 g |
4 mL |
10.9284 |
0.1622 |
0.0657 |
20 |
7 |
40 |
139.23 |
886 |
| 19 |
1 g |
4 mL |
10.9284 |
0.1622 |
0.0877 |
20 |
7 |
40 |
192.72 |
846 |
| 20 |
1 g |
4 mL |
10.9284 |
0.1622 |
0.1095 |
20 |
7 |
40 |
196.26 |
611 |
| 21 |
1 g |
4 mL |
10.9284 |
0.1622 |
0.0438 |
20 |
7 |
40 |
2.4177 |
1176 |
| 22 |
1 g |
6 mL |
10.9284 |
0.1622 |
0.0438 |
20 |
7 |
40 |
3.0445 |
1070 |
| 23 |
1 g |
8 mL |
10.9284 |
0.1622 |
0.0438 |
20 |
7 |
40 |
2.5787 |
918 |
| 24 |
1 g |
10 mL |
10.9284 |
0.1622 |
0.0438 |
20 |
7 |
40 |
3.0256 |
875 |
| 25 |
1 g |
12 mL |
10.9284 |
0.1622 |
0.0438 |
20 |
7 |
40 |
3.0435 |
573 |
| 26 |
1 g |
4 mL |
10.9284 |
0.0811 |
0.0438 |
20 |
7 |
40 |
2.438 |
388 |
| 27 |
1 g |
4 mL |
10.9284 |
0.1135 |
0.0438 |
20 |
7 |
40 |
2.7498 |
811 |
| 28 |
1 g |
4 mL |
10.9284 |
0.1459 |
0.0438 |
20 |
7 |
40 |
2.832 |
673 |
| 29 |
1 g |
4 mL |
10.9284 |
0.1784 |
0.0438 |
20 |
7 |
40 |
2.7463 |
530 |
| 30 |
1 g |
4 mL |
10.9284 |
0.2108 |
0.0438 |
20 |
7 |
40 |
2.8264 |
485 |
| 31 |
1 g |
4 mL |
6.9734 |
0.1135 |
0.0438 |
20 |
7 |
40 |
1.9735 |
676 |
| 32 |
1 g |
4 mL |
10.9284 |
0.1135 |
0.0438 |
20 |
7 |
40 |
2.6737 |
798 |
| 33 |
1 g |
4 mL |
14.5712 |
0.1135 |
0.0438 |
20 |
7 |
40 |
3.4709 |
852 |
| 34 |
1 g |
4 mL |
18.2139 |
0.1135 |
0.0438 |
20 |
7 |
40 |
3.6126 |
759 |
| 35 |
1 g |
4 mL |
21.8567 |
0.1135 |
0.0438 |
20 |
7 |
40 |
4.3639 |
633 |
| 36 |
1 g |
4 mL |
21.8567 |
0.1135 |
0.0438 |
20 |
7 |
30 |
2.3258 |
769 |
| 37 |
1 g |
4 mL |
21.8567 |
0.1135 |
0.0438 |
20 |
7 |
40 |
2.6734 |
839 |
| 38 |
1 g |
4 mL |
21.8567 |
0.1135 |
0.0438 |
20 |
7 |
50 |
2.9239 |
879 |
| 39 |
1 g |
4 mL |
21.8567 |
0.1135 |
0.0438 |
20 |
7 |
60 |
2.8632 |
841 |
| 40 |
1 g |
4 mL |
21.8567 |
0.1135 |
0.0438 |
20 |
7 |
70 |
2.6453 |
812 |
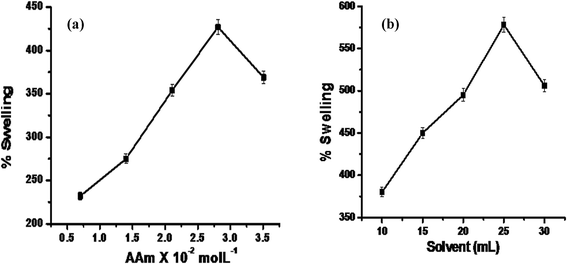 |
| | Fig. 1 (a) The effects of AAm concentration and (b) solvent on the percentage swelling (Ps) of the synthesized IPN. | |
3.1.1. Mechanism of IPN synthesis. The mechanism of IPN synthesis is given in Scheme 1. Persulphate ions from ammonium persulfate generated SO4−* anionic radicals, which assisted in the abstraction of hydrogen atoms from OH groups present on the backbone. These became active sites capable of radically initiating the polymerization of AA, resulting in graft copolymerization with AAm and thus leading to the formation of Av-cl-pol(AA-ipn-AAm).31
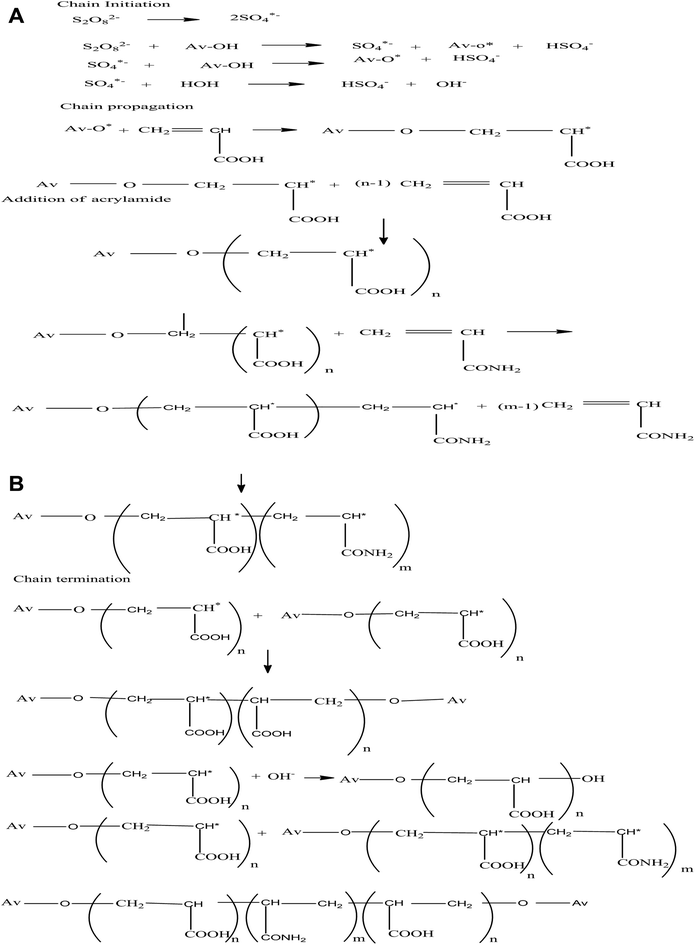 |
| | Scheme 1 Representation of the mechanism of the synthesis of Av-cl-poly(AA-ipn-AAm). | |
3.2. Characterization
The synthesized IPN was characterized through different techniques like FTIR and SEM to study the morphological effects on Av after interpenetration and crosslinking. Thermal stability was studied using TGA.
3.2.1. SEM. The surface morphology of the AA and IPN were studied by the scanning electron microscopy (SEM) technique. SEM images of both samples showed morphological variations. Highly porous structures are seen in IPN, which represent the regions of water permeation and interaction sites of external stimuli with the hydrophilic groups of the grafted polymer.Additional irregular and coarse surfaces were observed in Av-cl-poly(AA-ipn-AAm) in SEM results. These certainly reveal the morphological dissimilarities brought about by the chemical alteration of the backbone by grafting, crosslinking and interpenetration of the polymeric chain in Av as shown in Fig. 2a and 2b, due to the incorporation of covalent bonds between different polymeric chains on crosslinking with N,N-methylene bis acrylamide. The synthesized IPN had a porous structure. These pores might be the regions of water permeation and interaction sites of external stimuli.
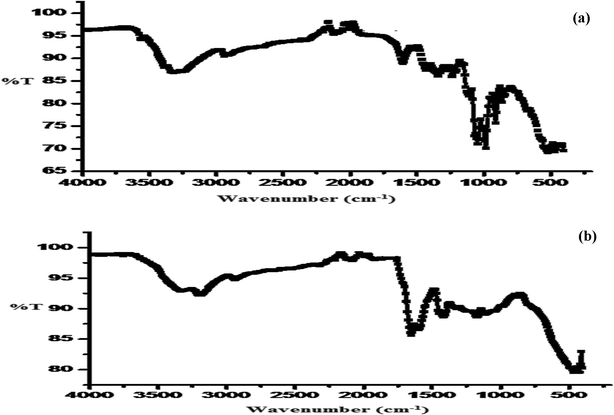 |
| | Fig. 2 (a) FTIR spectra of Av and (b) Av-cl-poly(AA-ipn-AAm). | |
3.2.2. FTIR (Fourier transform infrared spectroscopy). The broad peak observed in the IR spectrum of Av at about 3325 cm−1 is due to the O–H stretching of the intermolecular hydrogen-bonded OH group. The peak at 2915 cm−1 is due to the C–H stretching of the methyl group, that at 2101 cm−1 is due to the C![[triple bond, length as m-dash]](https://www.rsc.org/images/entities/char_e002.gif) C stretching of the monosubstituted group, and that at 1237 cm−1 is due to the C–C deformation in the methyl group (Fig. 3a). On the other hand, the IR spectrum of Av-cl-poly(AA-ipn-AAm) showed a peak at 3327 cm−1 due to the intermolecular hydrogen-bonded OH group. The intense absorption band at 2942 cm−1 is due to the C–H stretching of the CH2 group, the peak at 2323 cm−1 is due to the N–H stretching of the secondary amide group, 1651 cm−1 is due to the C
C stretching of the monosubstituted group, and that at 1237 cm−1 is due to the C–C deformation in the methyl group (Fig. 3a). On the other hand, the IR spectrum of Av-cl-poly(AA-ipn-AAm) showed a peak at 3327 cm−1 due to the intermolecular hydrogen-bonded OH group. The intense absorption band at 2942 cm−1 is due to the C–H stretching of the CH2 group, the peak at 2323 cm−1 is due to the N–H stretching of the secondary amide group, 1651 cm−1 is due to the C![[double bond, length as m-dash]](https://www.rsc.org/images/entities/char_e001.gif) O stretching of tertiary amides, 1418 cm−1 is due to the C–H deformation of the methyl group and 1110 cm−1 is due to C–C stretching (Fig. 3b).
O stretching of tertiary amides, 1418 cm−1 is due to the C–H deformation of the methyl group and 1110 cm−1 is due to C–C stretching (Fig. 3b).
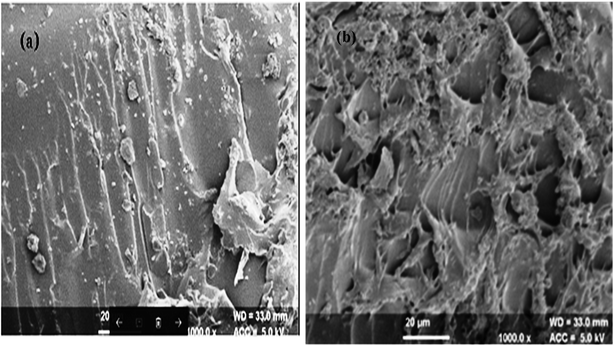 |
| | Fig. 3 (a) SEM of Av and (b) Av-cl-poly(AA-ipn-AAm). | |
3.2.3. TGA of Av and Av-cl-poly(AA-ipn-AAm). Thermogravimetric analysis was used to measure the effect of temperature on synthesized IPN, it represents the stoichiometric decomposition reaction of particular substances exhibiting the mass of sample lost at different stages. It involves the burning of the sample, thereby forming combustion products. TGA of Av was conducted by taking 5.2 mg of sample. Av melts up to 310 °C and the decomposition takes place in several steps. In the first step, the volatile components like moisture, solvent or monomer are lost at 110 °C. This stage is followed by the pyrolysis of the polymer at 205 °C. At 280 °C, the atmosphere was switched from N2 to O2, which resulted in the combustion of carbon black additives. Some of the inorganic components remained behind as residue at 310 °C. The evaluation of the pyrolysis weight loss of polymer content in various steps is as follows: first step, 24.4%; second step, 46.2%; third step, 28.9%.TGA of Av-cl-poly(AA-ipn-AAm) was done by taking 5.0 mg of the synthesized IPN. The decomposition of IPN occurred up to 390 °C. In the first stage of the TGA of IPN, the volatile components like moisture, solvent or monomer were lost up to 110 °C, followed by the second step involving the pyrolysis of polymer up to 240 °C, at which decomposition takes place to release carbon monoxide. In the third step, further combustion of carbon takes place up to 370 °C. At 370 °C, the atmosphere was switched from N2 to O2, which resulted in the combustion of carbon black additives. Some of the inorganic components remained behind as residue up to 390 °C. The evaluation of the pyrolysis weight loss of the polymer content in various steps is as follows: first step, 25.4%; second step, 22.4%; third step, 48.6% (Table 2, Fig. 4a and b). This shows that grafting and crosslinking of Av with (AAm)-MBA increases the thermal stability of the synthesized IPN.32,33
Table 2 TGA of Av and Av-cl-poly(AA-ipn-AAm)
| Sample Code |
Thermogravimetric analysis |
| First stage decomposition (°C), pyrolysis weight loss of polymer content (%) |
Second stage decomposition (°C), pyrolysis weight loss of polymer content (%) |
Third stage decomposition (°C), pyrolysis weight loss of polymer content (%) |
| Av |
110 °C, 24.4% |
110–205 °C, 46.2% |
205–280 °C, 28.9% |
| IPN |
110 °C, 23.4% |
110–205 °C, 22.4% |
205–280 °C, 28.9% |
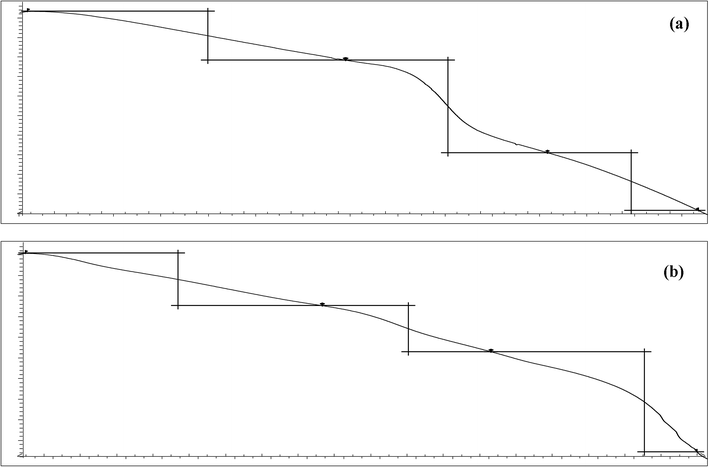 |
| | Fig. 4 TGA of (a) Av and (b) Av-cl-poly(AA-ipn-AAm). | |
3.2.4. XRD of Av and Av-cl-poly(AA-ipn-AAm). It is evident from Fig. 5a and b that compared to Av, the Av-cl-poly(AA-ipn-AAm) showed higher intensity peaks and the coherence length was found to be 0.986 Å, whereas it was 0.542 Å for Av. Higher coherence length indicates an increase in anisotropy with the alignment of different polysaccharide chains, poly(AA) chains and poly(AAm) chains along with cross-linking and interactions in comparison to the backbone.33
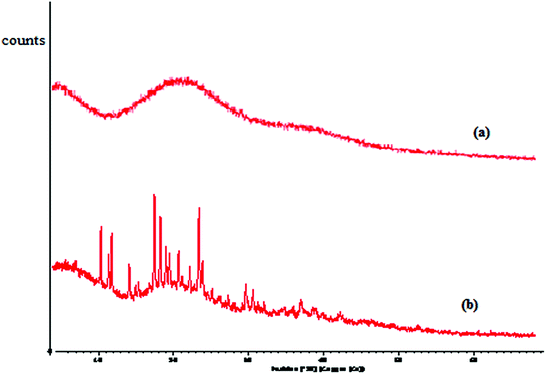 |
| | Fig. 5 XRD of (a) Av and (b) Av-cl-poly(AA-ipn-AAm). | |
The coherence length of the samples was calculated by using the Scherrer equation:
L = 0.9λ/β1/2X![[thin space (1/6-em)]](https://www.rsc.org/images/entities/char_2009.gif) cos cos![[thin space (1/6-em)]](https://www.rsc.org/images/entities/char_2009.gif) θ θ |
where
λ = wavelength,
θ = diffraction angle,
L = coherence length and
β1/2 = full width at half maximum.
3.3. Biodegradation study using the composting and soil burial method
The biodegradability of the synthesized IPN Av-cl-poly(AA-ipn-AAm) and Av was investigated through the composting and soil burial method. The evaluation of the biodegradability of the Av-cl-poly(AA-ipn-AAm) and Av was conducted by considering three different stages of the biodegradation. The end of the first week was considered the first stage of biodegradation. The end of the sixth week was considered the second stage of biodegradation and the third stage was after the completion of the 11 weeks. It was found that Av was completely degraded in the 2nd and 3rd weeks in the composting and soil burial methods, respectively. Initially, in both cases, biodegradation occurred slowly but was later increased in composting as compared to soil because in the initial stage, the microflora acted on the surface of the synthesized IPN; when the surface was eroded then degradation was increased to a greater pace. The results showed 94% degradation of the IPN within 60–80 days in the composting method and 86% degradation was seen in the case of the soil burial method after 11 weeks (Table 3). The biodegradation may occur due to the presence of different strains of the microorganism in the compost and soil. This enzymatic, chemical and physical degradation may lead to the alteration of the physicochemical properties of the IPN. The biodegradation was slower in the case of the soil burial method as compared to the composting method. This could be due to the fact that soil has less microbial colonies as compared to compost.15 Morphological and chemical modification of the synthesized IPN due to biodegradation was studied using SEM and FTIR.31–34
Table 3 Biodegradation studies of IPN using the composting and soil burial methods
| Biodegradation studies of IPN using compositing and soil burial methods |
| Sample code |
Percentage lost at different time interval (days) |
| Av-cl-poly(AA-IPN-AM) compositing method |
7 |
14 |
21 |
28 |
35 |
42 |
49 |
56 |
63 |
70 |
| 7 |
15 |
23 |
30 |
41 |
48 |
59 |
66 |
81 |
94 |
| Av-cl-poly(AA-IPN-AM) soil burial method |
5 |
11 |
20 |
29 |
36 |
45 |
55 |
64 |
75 |
86 |
3.3.1. SEM of different biodegradation stages under the composting and soil burial methods. The changes at the morphological level in different stages of the biodegradation of the synthesized IPN were revealed through the SEM studies. SEM images of different biodegradation stages of Av-cl-poly(AA-ipn-AAm) through the soil burial and composting methods are shown in Fig. 6a–g. Different stages of the biodegradation were reasonably manifested from the SEM results. Fig. 6a shows the SEM image of the synthesized IPN.
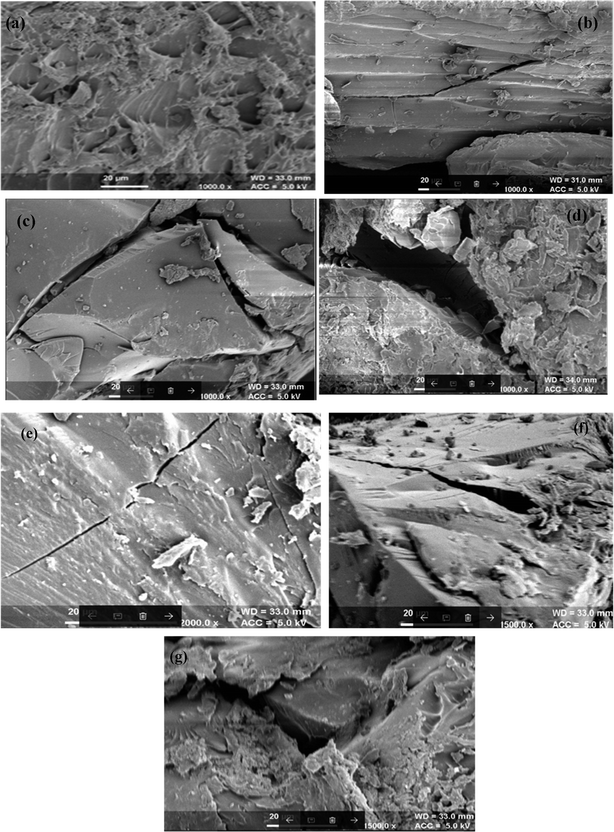 |
| | Fig. 6 SEM of (a) Av-cl-poly(AA-ipn-AAm), (b) Av-cl-poly(AA-ipn-AAm) biodegradation-I, (c) Av-cl-poly(AA-ipn-AAm) biodegradation-II, (d) Av-cl-poly(AA-ipn-AAm) biodegradation-III using the composting method, (e) Av-cl-poly(AA-ipn-AAm) biodegradation-I, (f) Av-cl-poly(AA-ipn-AAm) biodegradation-II and (g) Av-cl-poly(AA-ipn-AAm) biodegradation-III using the soil burial method. | |
In the first stage of the biodegradation, there were external cracks in both the composting and soil burial samples (Fig. 6b and e). The size of these cracks increased as the time of biodegradation increased. Large cracks and deep pits are clearly seen in the second stage of biodegradation (Fig. 6c and f). The results showed the complete disintegration of the samples in the third stage of biodegradation (Fig. 6d and g) in both composting and soil burial methods. Thus, SEM results clearly revealed that the synthesized IPN is biodegradable.32,33
3.3.2. FTIR analysis of different biodegradation stages under the composting and soil burial method. FT-IR spectra of different biodegradation stages of Av-cl-poly (AA-ipn-AAm) were recorded (Fig. 5a–f). Av-cl-poly(AA-ipn-AAm) (Fig. 7a) had peaks at 3327 cm−1 (OH stretching of the intermolecular H bonded OH group), 3187 cm−1 (due to the broad O–H stretching of the COOH group), 2942 cm−1 (C–H stretching of the methyl group), 1651 cm−1 (C![[double bond, length as m-dash]](https://www.rsc.org/images/entities/char_e001.gif) O stretching of the tertiary amide group), 1418 cm−1 (due to C–H deformation of the methyl group) and 463 cm−1 due to the presence of the pyranose ring. There was a decline in the intensity of the peaks of the degraded samples as compared to the synthesized IPN and there was also a loss of some peaks in the degraded IPN. The intensities of the peaks initially observed at 3327 cm−1, 2942 cm−1 and 1651 cm−1 were found to be decreased at biodegradation stage-I (Fig. 7b and e), due to the beginning of the breaking down of the cross-linked network. However, the degradation of individual compounds like Av, poly(AA-ipn-AAm) and MBA started in biodegradation stage-II (Fig. 7c and f). In the third stage of biodegradation, most of the FTIR peaks initially observed in the FT-IR spectrum of Av-cl-poly (AA-ipn-AAm) were shifted (Fig. 7d and g). Thus, FT-IR confirmed that the grafted chains of poly (AA-ipn-AAm) and Av were completely biodegraded within three weeks.33,35
O stretching of the tertiary amide group), 1418 cm−1 (due to C–H deformation of the methyl group) and 463 cm−1 due to the presence of the pyranose ring. There was a decline in the intensity of the peaks of the degraded samples as compared to the synthesized IPN and there was also a loss of some peaks in the degraded IPN. The intensities of the peaks initially observed at 3327 cm−1, 2942 cm−1 and 1651 cm−1 were found to be decreased at biodegradation stage-I (Fig. 7b and e), due to the beginning of the breaking down of the cross-linked network. However, the degradation of individual compounds like Av, poly(AA-ipn-AAm) and MBA started in biodegradation stage-II (Fig. 7c and f). In the third stage of biodegradation, most of the FTIR peaks initially observed in the FT-IR spectrum of Av-cl-poly (AA-ipn-AAm) were shifted (Fig. 7d and g). Thus, FT-IR confirmed that the grafted chains of poly (AA-ipn-AAm) and Av were completely biodegraded within three weeks.33,35
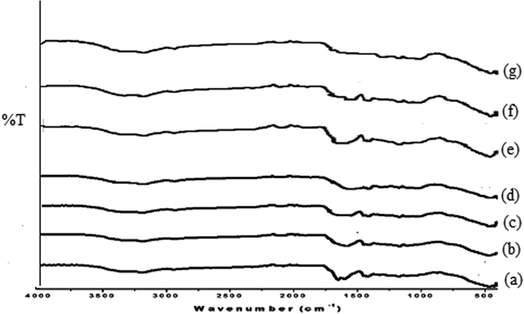 |
| | Fig. 7 FTIR spectra of (a) Av-cl-poly (AA-ipn-AAm), (b) Av-cl-poly(AA-ipn-AAm) biodegradation-I, (c) Av-cl-poly(AA-ipn-AAm) biodegradation-II, (d) Av-cl-poly(AA) biodegradation-III using the soil burial method; (e) Av-cl-poly(AA-ipn-AAm) biodegradation-I, (f) Av-cl-poly(AA-ipn-AAm) biodegradation-II and (g) Av-cl-poly(AA); biodegradation-III using the composting method. | |
3.4. The effects of different parameters on dye removal
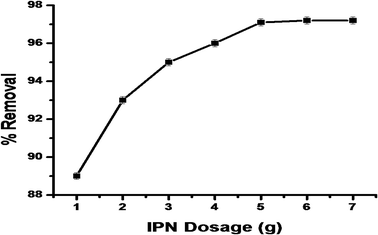
3.4.1. The effect of synthesized IPN dosage on dye removal. The effect of synthesized IPN dosage on MG dye (10 ppm) removal was studied with different doses (1–7 g L−1) of IPN, as presented in Fig. 8. The results showed that dye removal increased with the increase in the dosage level. The maximum dye removal was found to be 97.1% with 5 g L−1 and remained constant with further increase in the adsorbent dose (Fig. 8). This is because as the adsorbent dose increased, there was an increase in the surface area for the adsorption of the MG dye from the solution, thus an increase in the dye removal.36
 |
| | Fig. 8 The effect of IPN dosage on MG dye removal. | |
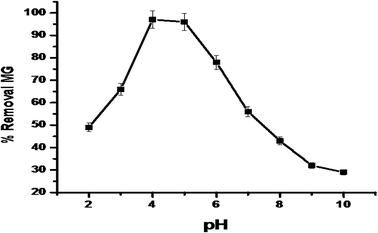
3.4.2. The effects of pH and point of zero charge. It is important to know the range of pH that did not degrade or lead to the loss of the colour intensity of the MG dye. The solution of MG dye (10 ppm) was prepared and adjusted from pH 2.0–10.37,38pH plays an important role in adsorption studies because the pH of the aqueous solution can lead to the protonation or deprotonation of the functional groups on the adsorption surface. pH also plays an important role in the electrostatic interaction between the dye molecules and adsorbent. The maximum dye removal was observed at pH 4.5 (Fig. 9), which may be due to the fact that MG dye molecules exist in monomeric form at pH 4.5, leading to the easy penetration of the adsorbent by the dye molecules. The dye removal was less at higher pH, which may be due to the fact that MG molecules exist in zwitterionic form and this leads to the aggregation and formation of large molecules. The entry of large molecules is restricted in the small pore size of the adsorbent and thus there is a decrease in dye adsorption. The point of zero charge for synthesized IPN is pH 6.2, while it is (predominantly) positively charged if the solution pH is less than 6.2 and negatively charged if the pH is higher than 6.2. At pH greater than 5, the MG molecules exist in cationic form, which leads to the lower adsorption due to electrostatic repulsion forces.33–41 The pH of dye solution after adsorption was found to be 6.4.
 |
| | Fig. 9 The effect of pH on MG dye adsorption by synthesized IPN. | |
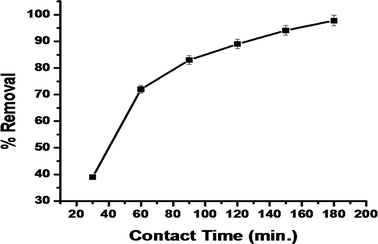
3.4.3. The effect of contact time. It is important to ensure complete equilibrium between the dye molecules and the adsorbate surface, so the contact time for maximum dye adsorption (97.84%) was optimized. It was found from the results that the dye removal was initially slow and later it rapidly increased; equilibrium was finally attained at 180 min (97.24%) (Fig. 10).
 |
| | Fig. 10 The effect of contact time on MG dye adsorption by synthesized IPN. | |
The slow adsorption of the dye in the initial stage (within 2 h) was due to the slow swelling of the adsorbent at this stage, which further led to slower adsorption. The high availability of the adsorption sites increased the adsorption (after 2 h) and subsequently, the adsorption slowed down due to the attainment of equilibrium and the depletion of the adsorption sites.41 For complete equilibrium between the dye molecules and adsorbent surface, the contact time was optimized to get the maximum dye adsorption. It was found that dye removal was initially slow, then the adsorption rapidly increased and equilibrium was finally attained at 180 min (Fig. 10).
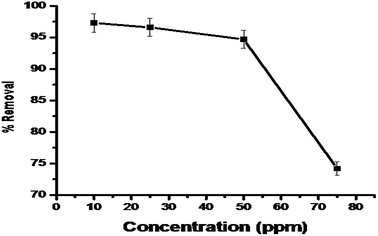
3.4.4. The effect of dye concentration. The initial concentration of the dye also impacted the removal of the dye; different concentrations of dye were taken (10–80 ppm) to study the effect on percentage dye removal. It is clear from the results that maximum dye removal was found (97.3%) using 10 ppm (Fig. 11).
 |
| | Fig. 11 The effect of initial dye concentration on MG dye adsorption by synthesized IPN. | |
3.5. Adsorption kinetics
The kinetics of the adsorbent for the treatment of dye was studied. There are different types of kinetic models explaining the mechanism by which dyes are adsorbed. The kinetics of the dye adsorption is important in determining the efficiency of the process. The pseudo-first-order, pseudo-second-order, Weber–Morris intraparticle diffusion and Boyd models were used for characterizing the kinetics data. The pseudo-first-order equation is expressed as follows:| |
 | (9) |
where qe and qt are the amount of dye adsorbed (mg g−1) at initial time t and at equilibrium, respectively. k1 is the pseudo-first-order rate constant (min−1) and t is the time taken (min). The values are derived from the linear plot of ln(qe − qt) vs. t.
The pseudo-first-order equation differs from the actual equation in two ways: qe does not represent the actual number of available sites and log![[thin space (1/6-em)]](https://www.rsc.org/images/entities/char_2009.gif) qe is not always equal to the intercept of the plot (log
qe is not always equal to the intercept of the plot (log![[thin space (1/6-em)]](https://www.rsc.org/images/entities/char_2009.gif) qe − qt) vs. t.
qe − qt) vs. t.
The pseudo-second-order equation for the chemisorption kinetics is represented as
| |
 | (10) |
where
k2 is the pseudo-second-order rate constant (g mg
−1 min
−1) and it is calculated from the plot of
t/
qt vs. t.
The parameters of the kinetics are summarised in Table 4. The most important determinant that defines the best fitting model for the experimental data is R2. It is quite clear from the results that the value of R2 for pseudo-second-order (0.991, Fig. 10b) is higher as compared to the pseudo-first order (0.968, Fig. 12a) and the values of error functions like χ2, EABS, ARE and MSDP were lower for the pseudo-second-order model as compared to the pseudo-first-order model, which indicated the lower experimental error. The calculated and experimental values of adsorption were very close for the pseudo-second-order. Therefore, based on this forgone discussion, it can be concluded that the pseudo-second-order model was best fit to the experimental data, thus the adsorption process may be of the chemisorption type.
Table 4 Pseudo first order and pseudo second order kinetics, intra particle diffusion constants and Boyd model
| Pseudo first order |
| Conc. (ppm) |
K1 (min−1) |
qe,cal (mg g−1) |
qexp (mg g−1) |
R2 |
χ2 |
EABS |
ARE |
MSDP |
| 25 |
0.0403 |
0.54 |
0.61 |
0.953 |
63 |
96 |
46 |
56 |
| 50 |
0.0567 |
0.89 |
0.82 |
0.962 |
92 |
143 |
37 |
68 |
| 75 |
0.0539 |
0.32 |
0.25 |
0.968 |
126 |
187 |
42 |
62 |
| Pseudo second order kinetics |
| Conc. (ppm) |
k2 (g mg−1 h−1) |
qe,cal (mg g−1) |
qexp (mg g−1) |
R2 |
χ2 |
EABS |
ARE |
MSDP |
| 25 |
0.558 |
0.68 |
0.56 |
0.982 |
12 |
32 |
14 |
21 |
| 50 |
0.776 |
0.94 |
0.87 |
0.991 |
7 |
28 |
8 |
14 |
| 75 |
0.501 |
0.39 |
0.26 |
0.987 |
6 |
21 |
6 |
16 |
| Intra-particle diffusion |
| Concentration (ppm) |
Kp (mg g−1 h−1/2) |
C |
R2 |
| 25 |
0.469 |
0.41 |
0.968 |
| 50 |
0.562 |
0.62 |
0.986 |
| 75 |
0.332 |
0.34 |
0.964 |
| Boyd model |
| Concentration (ppm) |
Slope |
Intercept |
R2 |
| 25 |
0.016 |
0.072 |
0.942 |
| 50 |
0.014 |
0.124 |
0.951 |
| 75 |
0.015 |
0.179 |
0.959 |
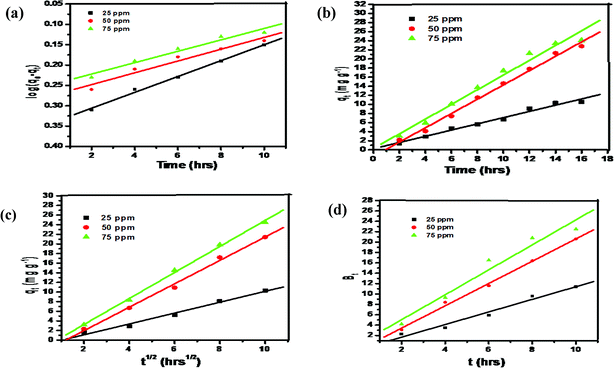 |
| | Fig. 12 (a) Pseudo first order, (b) pseudo second order, (c) intra particle diffusion and (d) Boyd plot. | |
The diffusion mechanism can be described by the Weber–Morris intra-particle diffusion and it is expressed by the equation given below:
where
k3 and
C are the intra-particle diffusion rate constant (mg g
−1 min
−1/2) and intercept, respectively. The
C and
k3 parameters were determined from the linear plot of
qt vs. t1/2.
The diffusion process may be of three different types: fast external diffusion, steady surface adsorption and slow equilibrium. At the initial stage of adsorption, there is fast external diffusion, which was not observed in Fig. 12b. This is followed by the surface adsorption intra-particle diffusion step, shown as the first linear region in the figure, which is followed by the constant equilibrium step, shown as the second linear region in the Fig. 12c. As per the Weber–Morris model, if the diffusion mechanism is controlled by the intraparticle diffusion, the intercept C should cross the origin. It is quite clear from the result (Table 4) that intercepts are non-zero, meaning that intraparticle diffusion is not the rate limiting step.41–44
The diffusion mechanism was studied using the Boyd model and the equation is expressed as follows:
| | |
Bt = −0.4977 − ln(1 − F)
| (12) |
Bt is the mathematical function of
F and is equivalent to the
qt/
qe.
In the Boyd model, if the linear plot of Bt vs. t crosses the origin, then the diffusion process is controlled by particle diffusion and if it does not cross the origin, then the diffusion process is by film diffusion. It is clear from the results (Fig. 12d and Table 4) that the intercepts are non-zero, thus suggesting that the diffusion process is governed by film diffusion.41–50
3.6. Adsorption isotherm models
The adsorption isotherm is a curve that describes the retention phenomena and mobility of substances from the porous medium to aquatic environments in a solid phase at constant pH and temperature. Adsorption equilibrium is achieved when the phase containing the adsorbate has been in contact with the adsorbent for an adequate time, with the concentration of the adsorbate in the bulk solution changing with the interface concentration. The mathematical correlation, like modelling analysis and operational design, is depicted by graphically expressing the solid-phase against its residual concentration. Physicochemical parameters with thermodynamic assumptions give an idea about the adsorption mechanism, the degree of affinity of the adsorbent and surface properties (Fig. 13).
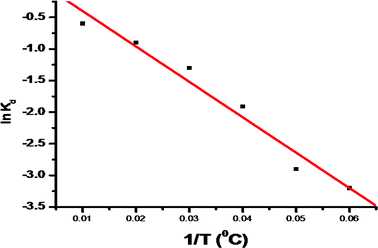 |
| | Fig. 13 The plot of ln![[thin space (1/6-em)]](https://www.rsc.org/images/entities/char_2009.gif) Kd vs. 1/T for the evaluation of standard enthalpy and entropy changes. Kd vs. 1/T for the evaluation of standard enthalpy and entropy changes. | |
There are many equilibrium isotherm models (Langmuir, Freundlich, Temkin, Toth, Brunauer–Emmett–Teller, Koble–Corrigan, Redlich–Peterson, Sips, Hill, Flory–Huggins, Khan and Radke–Prausnitz isotherm) that are used for kinetics considerations and adsorption equilibrium.42–51
3.6.1. Two parameter isotherms.
Langmuir isotherm model. This model was originally developed to study the gas-solid-phase adsorption onto activated carbon and this empirical model assumes monolayer adsorption on a finite number of definite sites, which are equivalent, with no lateral interactions and steric hindrance. The Langmuir isotherm generally refers to the homogeneous adsorption with no transmigration of the adsorbate. It is characterized graphically by a plateau and shows that when equilibrium is attained, once a molecule occupies a site, no further adsorption can take place. Langmuir theory also indicates that with an increase in distance, there is a rapid decrease in the attractive forces between the inter-molecules. The Langmuir equation is expressed as follows:| |
 | (13) |
where kL is the Langmuir adsorption constant (L mg−1) and qm is the maximum monolayer adsorption capacity of the adsorbent (mg g−1).The essential characteristic of the Langmuir model is the separation factor (RL), which is a dimensionless constant. The separation factor indicates that if the isotherm is favourable, (0 < RL< 1), linear (RL = 1), unfavourable (RL > 1) or irreversible (RL = 0).
| |
 | (14) |
where
Co is the highest initial dye concentration.
Freundlich isotherm model. This is the earliest known model, which describes the non-ideal and reversible adsorptions that are not restricted to the formation of a monolayer. This model assumes multilayer adsorption with the non-uniform distribution of adsorption heat and affinities over the heterogeneous surface. The Freundlich equation is expressed as follows:| |
 | (15) |
where nF is the Freundlich constant indicating the favourability of the adsorption process, which is favourable if 1 < nF < 10. kF (mg1−1/n L1/n g−1) is the adsorption capacity of the adsorbent.
Dubinin–Radushkevich (D–R) isotherm model. D–R is an empirical model, which typically considers the adsorption of subcritical vapours onto the porous solid. It is used to express the adsorption mechanism with a Gaussian energy distribution on a heterogeneous surface. The D–R isotherm is a temperature dependent isotherm model and assumes that the adsorbent surface is heterogeneous and the equation is expressed as follows:| |
ln![[thin space (1/6-em)]](https://www.rsc.org/images/entities/char_2009.gif) qe = ln qe = ln![[thin space (1/6-em)]](https://www.rsc.org/images/entities/char_2009.gif) qm − kDε2 qm − kDε2
| (16) |
| |
 | (17) |
where kD (mol2 kJ−2), ε and R (8.314 × 10⁻³ kJ mol−1 K−1) are the D–R constant and D–R isotherm constant and gas constant, respectively. qm (mg g−1) and T (K) are the saturation capacity and temperature, respectively. The kD is used to obtain the mean free energy, i.e. E (kJ mol−1) using the equation given below:| |
 | (18) |
Temkin isotherm model. This isotherm is the early model, which describes the hydrogen adsorption onto platinum electrodes in an acidic solution. This isotherm tells about the interaction between adsorbate and adsorbent. It is a two-parameter model, which considers the uniform distribution of energy. It is assumed that in the layer, the heat of adsorption of all the molecules decreases linearly rather than logarithmically. The Temkin equation is expressed as follows:| |
 | (19) |
where kT is the equilibrium binding constant and b (kJ mol−1) is the Temkin isotherm constant.
3.6.2. Three parameter isotherms.
Redlich–Peterson (R–P) isotherm model. The R–P isotherm is attributed to both Langmuir and Freundlich isotherms, which incorporate three parameters into an empirical equation. To represent the adsorption equilibria over a wide range of concentrations, this model is dependent on the concentration in the numerator and an exponential function in the denominator to represent the adsorption equilibria over a large range of pH. This model is applicable to both homogeneous and heterogeneous systems. The R–P equation is expressed as follows:| |
 | (20) |
where kR (L g−1) and aR (L mg−1) are the R–P constants. β is the R–P exponent.
Sips isotherm model. This model is a combination of the Langmuir and Freundlich expressions, used for the heterogeneous adsorption system. This isotherm overcomes the limitation of an increase in the concentration of adsorbate associated with the Freundlich isotherm. It predicts a monolayer adsorption capacity characteristic of the Langmuir isotherm at high concentration, and at low adsorbate concentration it is reduced to the Freundlich isotherm. The equation parameters are generally governed by operating conditions like temperature, pH and concentration. The equation is expressed as follows:| |
 | (21) |
where kS (Lg−1) and kLF are the Sips constant and Sips exponent, respectively.The parameters of the Langmuir, Freundlich, D–R, Temkin, R–P and Sips isotherm models were obtained from the linear plots of Ce/qe vs. Ce, ln![[thin space (1/6-em)]](https://www.rsc.org/images/entities/char_2009.gif) qe vs. ln
qe vs. ln![[thin space (1/6-em)]](https://www.rsc.org/images/entities/char_2009.gif) Ce, ln
Ce, ln![[thin space (1/6-em)]](https://www.rsc.org/images/entities/char_2009.gif) qe vs. ε2, qe vs. ln
qe vs. ε2, qe vs. ln![[thin space (1/6-em)]](https://www.rsc.org/images/entities/char_2009.gif) Ce, ln[(kR(Ce/qe) − 1] vs. ln
Ce, ln[(kR(Ce/qe) − 1] vs. ln![[thin space (1/6-em)]](https://www.rsc.org/images/entities/char_2009.gif) Ce and ln[qe/(qm − qe)] vs. ln
Ce and ln[qe/(qm − qe)] vs. ln![[thin space (1/6-em)]](https://www.rsc.org/images/entities/char_2009.gif) Ce, respectively46–50 (Table 5).
Ce, respectively46–50 (Table 5).
Table 5 Parameters of isotherm models for the adsorption of malachite green dye using synthesized IPN
| Langmuir isotherm |
| Temperature (°C) |
kL (L mg−1) |
qmax cal (mg g−1) |
R2 |
| 25 |
0.862 |
1.21 |
0.994 |
| 50 |
0.955 |
1.12 |
0.997 |
| 75 |
0.767 |
1.54 |
0.982 |
| Freundlich isotherm |
| Temperature (°C) |
kF (mg g−1) |
N |
R2 |
| 25 |
1.189 |
1.14 |
0.991 |
| 50 |
1.316 |
1.36 |
0.989 |
| 75 |
1.376 |
1.47 |
0.978 |
| Dubinin–Radushkevich isotherm |
| Temperature (°C) |
kD (mol2 kJ−2) |
E (kJ mol−1) |
R2 |
| 25 |
2.561 |
0.389 |
0.783 |
| 50 |
3.421 |
0.289 |
0.672 |
| 75 |
4.762 |
0.326 |
0.746 |
| Temkin isotherm |
| Temperature (°C) |
b (kJ mol−1) |
kT (L g−1) |
R2 |
| 25 |
98.4 |
0.464 |
0.89 |
| 50 |
81.8 |
0.578 |
0.92 |
| 75 |
78.2 |
0.325 |
0.95 |
| Redlich–Peterson isotherm |
| Temperature (°C) |
aR (L mg−1) |
β |
R2 |
| 25 |
0.49 |
0.66 |
0.93 |
| 50 |
0.42 |
0.75 |
0.94 |
| 75 |
1.18 |
0.68 |
0.89 |
| Sips isotherm model |
| Temperature (°C) |
kS (L mg−1) |
qm (mg g−1) |
R2 |
| 25 |
0.872 |
1.36 |
0.962 |
| 50 |
0.986 |
1.18 |
0.965 |
| 75 |
0.852 |
1.24 |
0.953 |
The value of R2 was compared for all the models and it was observed that the Langmuir model had the highest R2 value, suggesting that the experimental data is best represented by the Langmuir model. The results from the Langmuir model specify that on the surface of the adsorbent, there is a homogeneous distribution of adsorption sites and therefore, there is the formation of a single layer of dye molecules on the IPN surface.
3.7. Thermodynamics studies and activation energy
The thermodynamics studies provide information about the effect of temperature on the adsorption process and were conducted at temperatures ranging from 20 to 70 °C. The following equations were used for obtaining the thermodynamic parameters.51–53| |
ΔG° = −RT![[thin space (1/6-em)]](https://www.rsc.org/images/entities/char_2009.gif) ln ln![[thin space (1/6-em)]](https://www.rsc.org/images/entities/char_2009.gif) kD kD
| (23) |
| |
 | (24) |
The temperature effect on the thermodynamic constant can be calculated using the following equation:
| |
 | (25) |
On integration and rearrangement, the equation becomes
| |
 | (26) |
where Δ
H°, Δ
G° and Δ
S° are the change in enthalpy, Gibbs free energy and the change in entropy, respectively.
kD and
T (K) are the distribution coefficient for adsorption and temperature, respectively.
qe and
Ce (mg L
−1) are the concentration of dye adsorbed by the adsorbent and dye remaining in the solution at equilibrium, respectively.
R (J mol
−1 K
−1) is the gas constant.
Kd was obtained from dye adsorption at different concentrations at different temperatures. The results of ln
![[thin space (1/6-em)]](https://www.rsc.org/images/entities/char_2009.gif) Kd vs.
Kd vs. 1/
T (
Fig. 11) prove that the dye removal decreases as the temperature increases, thus indicating the exothermic nature of dye removal. The value of Δ
G° is positive at all temperatures and it decreases with increasing temperature (
Table 6). This shows that the dye removal process is not spontaneous and the dye removal is higher at low temperatures. The negative value of Δ
H° confirms that the dye removal process is exothermic in nature.
52–55
Table 6 Thermodynamic analysis at different temperaturesa
| Temperature (°C) |
ln![[thin space (1/6-em)]](https://www.rsc.org/images/entities/char_2009.gif) kd kd |
ΔG° (kJ mol−1) |
ΔH° (kJ mol−1) |
ΔS° (J mol−1 K−1) × 10−2 |
R2 |
| Where, kd = thermodynamics equilibrium constant; ΔG° = Gibbs function; ΔH° = standard enthalpy change and ΔS° = standard entropy change. |
| 20 |
−0.49 |
1.24 |
−3.62 |
−1.64 |
0.982 |
| 30 |
−0.56 |
1.33 |
|
|
0.986 |
| 40 |
−0.63 |
1.49 |
|
|
0.988 |
| 50 |
−0.71 |
1.64 |
|
|
0.979 |
| 60 |
−0.77 |
1.75 |
|
|
0.983 |
| 70 |
−0.82 |
1.86 |
|
|
0.986 |
4. Conclusion
A noble IPN was synthesized using the natural polysaccharide, Av, as the backbone, APS as the initiator, MBA as the cross-linker, AA and AAm as primary and secondary monomers, respectively. The biodegradability of the synthesized IPN was investigated through soil burial and composting methods and it is clear from the results that the synthesized IPN is biodegradable by natural microorganisms. The synthesized IPN was also used for the removal of MG dye from aqueous solution and was found to remove 97.3% of MG dye. The synthesized device is very effective for MG dye adsorption from aqueous solution. The adsorption of MG dye on the synthesized sample followed the Langmuir and Freundlich isotherms. The kinetics of adsorption followed a pseudo-second-order rate equation. The Langmuir isotherm model was found to be the best-fitting model for the present experimental data. MG dye removal decreased as the temperature increased, suggesting that the adsorption process was exothermic. Thus, the synthesized IPN was found to be an efficient, cost-effective and environmentally friendly adsorbent for the removal of MG dye from aqueous solution.
Conflicts of interest
There are no conflicts to declare.
Acknowledgements
One of the Author Vishal Rehani is grateful to IKG Punjab Technical University for providing an opportunity to carry out research work and authorities of National Institute of Technology, Jalandhar for providing necessary laboratory facilities and infrastructure to carry out the present work.
References
- Saruchi and V. Kumar, Adsorption kinetics and isotherms for the removal of rhodamine B dye and Pb2+ ions from aqueous solutions by a hybrid ion-exchanger, Arabian J. Chem., 2016 DOI:10.1016/j.arabjc.2016.11.009.
- V. P. Mahida and M. P. Patel, Removal of some most hazardous cationic dyes using novel poly (NIPAAm/AA/N-allylisatin) nanohydrogel, Arabian J. Chem., 2016, 9, 430–442 CrossRef CAS.
- S. Thakura, S. Pandeya and O. Arotibaa, Sol-gel derived xanthan gum/silica nanocomposite—a highly efficient cationic dyes adsorbent in aqueous system, Int. J. Biol. Macromol., 2017, 103, 596–604 CrossRef PubMed.
- B. Mua and A. Wanga, Adsorption of dyes onto palygorskite and its composites, J. Environ. Chem. Eng., 2016, 4, 1274–1294 CrossRef.
- V. Bekiari and P. Lianos, Poly (sodium acrylate) hydrogels as potential pH-sensitive sorbents for the removal of organic and inorganic pollutant from water, Global NEST J., 2010, 12, 262–269 Search PubMed.
- S. Thakura, S. Pandeya and O. Arotibaa, Development of a sodium alginate-based organic/inorganic superabsorbent composite hydrogel for adsorption of methylene blue, Carbohydr. Polym., 2016, 153, 34–46 CrossRef PubMed.
- R. Sharma, B. S. Kaith, S. Kalia, D. Pathania, A. Kumar, N. Sharma, R. Street and C. Schauer, Biodegradable and conducting hydrogels based on Guar gum polysaccharide for antibacterial and dye removal applications, J. Environ. Manage., 2015, 162, 37–45 CrossRef CAS PubMed.
- V. Panic, Z. Madzarevic, T. Husovic and S. Velickovic, Poly(methacrylic acid) based hydrogels as sorbents for removal of cationic dye basic yellow 28: Kinetics, equilibrium study and image analysis, Chem. Eng. J., 2013, 217, 192–204 CrossRef CAS.
- S. Li, H. Zhang, J. Feng, R. Xu and X. Liu, Facile preparation of poly (acrylic acid–acrylamide) hydrogels by frontal polymerization and their use in removal of cationic dyes from aqueous solution, Desalination, 2011, 280, 95–102 CrossRef CAS.
- N. Alizadeh and M. Mahjoub M, Removal of crystal violet dye from aqueous solution using surfactant modified NiFe2O4 as nanoadsorbent, isotherms, thermodynamics and kinetics studies, J. Nanoanalysis, 2017, 4, 8–19 Search PubMed.
- M. Dahri, L. Lim, N. Priyantha and C. Chan, Removal of Acid Blue 25 Using Cempedak Durian Peel From Aqueous Medium: Isotherm, Kinetics and Thermodynamics Studies, Int. Food Res. J., 2016, 23, 1154–1163 CAS.
- L. Lim, N. Priyantha, H. Cheng and N. Zaidi, Adsorption characteristics of Artocarpus odoratissimus leaf toward removal of toxic crystal violet dye: isotherm, thermodynamics and regeneration studies, Journal of Environment and Biotechnology Research, 2016, 4, 32–40 Search PubMed.
- N. Zaidi, L. Lim, A. Usman and M. Kooh M, Efficient adsorption of malachite green dye using Artocarpus odoratissimus leaves with artificial neural network modelling, Desalin. Water Treat., 2018, 101, 313–324 CrossRef.
- L. Lim, N. Priyantha, C. Ing, M. Dahri, D. Tennakoon, T. Zehra and M. Suklueng, Artocarpus odoratissimus skin as a potential low-cost biosorbent for the removal of methylene blue and methyl violet 2B, Desalin. Water Treat., 2015, 53, 1–13 CrossRef.
- H. Chieng, L. Lim and N. Priyantha, Enhancement of crystal violet dye adsorption on Artocarpus camansi peel through sodium hydroxide treatment, Desalin. Water Treat., 2017, 58, 320–331 CrossRef CAS.
- L. Lim and N. Priyantha, Potential use of Momordica charantia (bitter gourd) waste as a low-cost adsorbent to remove toxic crystal violet dye, Desalin. Water Treat., 2017, 82, 121–130 CrossRef.
- N. Priyantha, L. Lim, D. Tennakoon, E. Liaw, C. Ing and A. Liyandeniya, Biosorption of cationic dyes on breadfruit (Artocarpus altilis) peel and core, Appl. Water Sci., 2018, 8, 37 CrossRef.
- L. Lim, N. Priyantha, Y. Chen and N. Zaidi, Effective removal of methyl violet dye using pomelo leaves as a new low-cost adsorbent, Desalin. Water Treat., 2018, 110, 264–274 CrossRef.
- P. K. Sahu, D. D. Giri, R. Singh, P. Pandey, S. Gupta, A. K. Shrivastava, A. Kumar and K. D. Pandey, Pharmacol. Pharm., 2013, 4, 599–610 CrossRef CAS.
- R. F. Pereira, A. Mendes and P. J. Bartolo, Novel Alginate/Aloe Vera Hydrogel Blends as Wound Dressings for the Treatment of Several Types of Wounds, Chem. Eng. Trans., 2013, 32, 1009–1014 Search PubMed.
- N. Yewegnon, E. A. Irma, S. Philippe, A. Abdoukarim, Y. A. K. Alassane, A. C. Pascal, M. Daouda and S. K. C. Dominique, Evaluation of Aloe Vera Leaf Gel as a Natural Flocculant: Phytochemical Screening and Turbidity Removal Trials of Water by Coagulation Flocculation, Res. J. Recent Sci., 2016, 5, 9–15 Search PubMed.
- O. Khyati, S. Vranda, S. Gupta and S. R. Suseem, Formulation and evaluation of hydrogel with ascorbic acid using aloe vera gel powder as a drug carrier, Innovare Journal of sciences, 2013, 1, 18–20 Search PubMed.
- Y. S. Ho, C. C. Chiang and Y. C. Hsu, Sorption kinetics for dye removal from aqueous solution using activated clay, Sep. Sci. Technol., 2001, 36(11), 2473–2488 CrossRef CAS.
- T. R. Hoare and D. S. Kohane, Hydrogels in drug delivery: progress and challenge, Polymer, 2008, 49, 1993–2007 CrossRef CAS.
- Y. Wang, W. W. Wanga and A. AiqinWanga, Efficient adsorption of methylene blue on an alginate-based nanocomposite hydrogel enhanced by organo-illite/smectite clay, Chem. Eng. J., 2013, 228, 132–139 CrossRef CAS.
- J. Arutchelvi, M. Sudhakar, A. Arkatkar, M. Doble, S. Bhaduri and P. V. Uppara, Biodegradation of polyethylene and polypropylene, Indian J. Biotechnol., 2008, 7, 9–22 CAS.
- Saruchi, B. S. Kaith, V. Kumar and R. Jindal, Biodegradation study of enzymatically catalyzed interpenetrating polymer network: evaluation of agrochemical release and impact on soil fertility, Biotechnol. Rep., 2016, 9, 74–81 CrossRef CAS PubMed.
- M. Chigondo, H. K. Paumo, M. Bhaumik, K. Pillay and A. Maity, Rapid high adsorption performance of hydrous cerium magnesium oxides for removal of fluoride from water, J. Mol. Liq., 2018 DOI:10.1016/j.molliq.2018.06.015.
- A. Alvarez, L. H. Velazquez-Jimenez, L. P. Chazaro-Ruiz, P. E. Diaz-Flores and J. R. Rangel-Mendez, F− removal in water by a hybrid adsorbent lanthanum-carbon, J. Colloid Interface Sci., 2015, 455, 194–202 CrossRef.
- A. Albertsson, C. Anderson and S. Karlsson, The mechanism of biodegradation of polyethylene, Polym. Degrad. Stab., 1987, 18, 73–87 CrossRef CAS.
- A. S. Sarc, Redox polymerization, Prog. Polym. Sci., 1999, 24, 1149–1204 CrossRef.
- Saruchi, B. S. Kaith, R. Jindal and V. Kumar, Biodegradation of gum tragacanth acrylic acid based hydrogel and its impact on soil fertility, Polym. Degrad. Stab., 2015, 115, 24–31 CrossRef CAS.
- Saruchi, B. S. Kaith, R. Jindal, G. S. Kapur and V. Kumar, Synthesis, characterization and evaluation of gum tragacanth and acrylic acid based hydrogel for sustained calcium chloride release – enhancement of water-holding capacity of soil, J. Chin. Adv. Mater. Soc., 2014, 2(1), 40–52 CrossRef.
- H. Mittal, V. Kumar, Saruchi and S. S. Ray, Adsorption of methyl violet from aqueous solution using gum xanthan/Fe3O4 based nanocomposite hydrogel, Int. J. Biol. Macromol., 2016, 89, 1–11 CrossRef CAS PubMed.
- M. Ghaedi, N. Zeinali, A. M. Ghaedi, M. Teimuori and J. Tashkhourian, Artificial neural network-genetic algorithm based optimization for the adsorption of methylene blue and brilliant green from aqueous solution by graphite oxide nanoparticle, Spectrochim. Acta, Part A, 2014, 125, 264–277 CrossRef CAS PubMed.
- M. Ghaedi, A. M. Ghaedi, M. Hossainpour, A. Ansari, M. H. Habibi and A. R. Asghari, Least square-support vector (LS-SVM) method for modeling of methylene blue
dye adsorption using copper oxide loaded on activated carbon: kinetic and isotherm study, J. Ind. Eng. Chem., 2014, 20(4), 1641–1649 CrossRef CAS.
- H. Mittal, A. Maity and S. S. Ray, The adsorption of Pb2+ and Cu2+ onto gum ghatti-grafted poly(acrylamide-co-acrylonitrile) biodegradable hydrogel: isotherms and kinetic models, J. Phys. Chem. B, 2015, 119(5), 2026–2039 CrossRef CAS PubMed.
- S. Ghorai, A. Sarkar, M. Raoufi, A. B. Panda, H. Schonherr and S. Pal, Enhanced Removal of Methylene Blue and Methyl Violet Dyes from Aqueous Solution Using a Nanocomposite of Hydrolyzed Polyacrylamide Grafted Xanthan Gum and Incorporated Nanosilica, ACS Appl. Mater. Interfaces, 2014, 6(7), 4766–4777 CrossRef CAS PubMed.
- B. S. Kaith, Saruchi, R. Jindal and M. S. Bhatti, Screening and RSM optimization for synthesis of a gum tragacanth–acrylic acid based device for in situ controlled cetirizine dihydrochloride release, Soft Matter, 2012, 8, 2286–2293 RSC.
- M. Ghaedi, A. Ansari, M. H. Habibi and A. R. Asghari, Removal of malachite green from aqueous solution by zinc oxide nanoparticle loaded on activated carbon: kinetics and isotherm study, J. Ind. Eng. Chem., 2014, 20(1), 17–28 CrossRef CAS.
- V. K. Gupta, D. Patania, S. Agarwal and S. Sharma, Removal of Cr(VI) onto Ficus carica biosorbent from water, Environ. Sci. Pollut. Res., 2013, 20, 2632–2644 CrossRef CAS PubMed.
- M. K. Dahri, M. R. R. Kooh and L. B. L. Lim, Water remediation using low cost adsorbent walnut shell for removal of malachite green: equilibrium, kinetics, thermodynamic and regeneration studies, J. Environ. Chem. Eng., 2014, 2(3), 1434–1444 CrossRef CAS.
- V. K. Gupta, D. Patania, S. Agarwal and S. Sharma, Removal of Cr(VI) onto Ficus carica biosorbent from water, Environ. Sci. Pollut. Res., 2013, 20, 2632–2644 CrossRef CAS PubMed.
- I. Langmuir, The adsorption of gases on plane surfaces of glass, mica and platinum, J. Am. Chem. Soc., 1918, 40, 1361–1403 CrossRef CAS.
- D. G. Kinniburgh, General purpose adsorption isotherms, Environ. Sci. Technol., 1986, 20, 895–904 CrossRef CAS PubMed.
- M. Dogan, M. Alkan, A. Turkyilmaz and Y. Ozdemir, Kinetics and mechanism of removal of methylene blue by adsorption onto perlite, J. Hazard. Mater., 2004, 109, 141–148 CrossRef CAS PubMed.
- M. Roosta, M. Ghaedi, A. Daneshfar, R. Sahraei and A. Asghari, Optimization of the ultrasonic assisted removal of methylene blue by gold nanoparticles loaded on activated carbon using experimental design methodology, Ultrason. Sonochem., 2014, 21(1), 242–252 CrossRef CAS PubMed.
- M. Ghaedi, A. M. Ghaedi, E. Negintaji, A. Ansari and F. Mohammadi, Artificial neural network – imperialist competitive algorithm based optimization for removal of sunset yellow using Zn(OH)2 nanoparticles-activated carbon, J. Ind. Eng. Chem., 2014, 20(6), 4332–4343 CrossRef CAS.
- H. L. Chieng, L. B. L. Lim and N. Priyantha, Sorption characteristics of peat from Brunei Darussalam for the removal of rhodamine B dye from aqueous solution: adsorption isotherms, thermodynamics, kinetics and regeneration studies, Desalin. Water Treat., 2015, 55, 664–677 CrossRef CAS.
- O. Hamdaoui and E. Naffrechoux, Modeling of adsorption isotherms of phenol and chlorophenols onto granular activated carbon part II. Models with more than two parameter, J. Hazard. Mater., 2007, 147, 401–411 CrossRef CAS PubMed.
- M. S. Chiou and H. Y. Li, Equilibrium and kinetic modeling of adsorption of reactive dye on cross-linked chitosan beads, J. Hazard. Mater., 2002, 93, 233–248 CrossRef CAS.
- H. I. Chieng, L. B. L. Lim and N. Priyantha, Enhancing adsorption capacity of toxic malachite green dye through chemically modified breadnut peel: equilibrium, thermodynamics, kinetics and regeneration studies, Environ. Technol., 2015, 36(1), 86–97 CrossRef CAS PubMed.
- O. S. Bello, M. A. Ahmad and B. Semire, Scavenging malachite green dye from aqueous solutions using pomelo (Citrus grandis) peels: kinetic, equilibrium and thermodynamic studies, Desalin. Water Treat., 2015, 56(2), 647–658 Search PubMed.
- L. B. L. Lim, N. Priyantha and N. H. M. Mansor, Utilizing Artocarpus altilis(breadfruit) skin for the removal of malachite green: isotherm, kinetics, regeneration, and column studies, Desalin. Water Treat., 2016, 57(35), 16601–16610 CrossRef CAS.
- M. R. R. Kooh, M. K. Dahri and L. B. L. Lim, The removal of rhodamine B dye from aqueous solution using Casuarina equisetifolia needles as adsorbent, Cogent Environ. Sci., 2016, 2457, 1–14 Search PubMed.
|
| This journal is © The Royal Society of Chemistry 2018 |
Click here to see how this site uses Cookies. View our privacy policy here.  Open Access Article
 *d
*d


![[triple bond, length as m-dash]](https://www.rsc.org/images/entities/char_e002.gif) C stretching of the monosubstituted group, and that at 1237 cm−1 is due to the C–C deformation in the methyl group (Fig. 3a). On the other hand, the IR spectrum of Av-cl-poly(AA-ipn-AAm) showed a peak at 3327 cm−1 due to the intermolecular hydrogen-bonded OH group. The intense absorption band at 2942 cm−1 is due to the C–H stretching of the CH2 group, the peak at 2323 cm−1 is due to the N–H stretching of the secondary amide group, 1651 cm−1 is due to the C
C stretching of the monosubstituted group, and that at 1237 cm−1 is due to the C–C deformation in the methyl group (Fig. 3a). On the other hand, the IR spectrum of Av-cl-poly(AA-ipn-AAm) showed a peak at 3327 cm−1 due to the intermolecular hydrogen-bonded OH group. The intense absorption band at 2942 cm−1 is due to the C–H stretching of the CH2 group, the peak at 2323 cm−1 is due to the N–H stretching of the secondary amide group, 1651 cm−1 is due to the C![[double bond, length as m-dash]](https://www.rsc.org/images/entities/char_e001.gif) O stretching of tertiary amides, 1418 cm−1 is due to the C–H deformation of the methyl group and 1110 cm−1 is due to C–C stretching (Fig. 3b).
O stretching of tertiary amides, 1418 cm−1 is due to the C–H deformation of the methyl group and 1110 cm−1 is due to C–C stretching (Fig. 3b).
![[thin space (1/6-em)]](https://www.rsc.org/images/entities/char_2009.gif) cos
cos![[thin space (1/6-em)]](https://www.rsc.org/images/entities/char_2009.gif) θ
θ![[double bond, length as m-dash]](https://www.rsc.org/images/entities/char_e001.gif) O stretching of the tertiary amide group), 1418 cm−1 (due to C–H deformation of the methyl group) and 463 cm−1 due to the presence of the pyranose ring. There was a decline in the intensity of the peaks of the degraded samples as compared to the synthesized IPN and there was also a loss of some peaks in the degraded IPN. The intensities of the peaks initially observed at 3327 cm−1, 2942 cm−1 and 1651 cm−1 were found to be decreased at biodegradation stage-I (Fig. 7b and e), due to the beginning of the breaking down of the cross-linked network. However, the degradation of individual compounds like Av, poly(AA-ipn-AAm) and MBA started in biodegradation stage-II (Fig. 7c and f). In the third stage of biodegradation, most of the FTIR peaks initially observed in the FT-IR spectrum of Av-cl-poly (AA-ipn-AAm) were shifted (Fig. 7d and g). Thus, FT-IR confirmed that the grafted chains of poly (AA-ipn-AAm) and Av were completely biodegraded within three weeks.33,35
O stretching of the tertiary amide group), 1418 cm−1 (due to C–H deformation of the methyl group) and 463 cm−1 due to the presence of the pyranose ring. There was a decline in the intensity of the peaks of the degraded samples as compared to the synthesized IPN and there was also a loss of some peaks in the degraded IPN. The intensities of the peaks initially observed at 3327 cm−1, 2942 cm−1 and 1651 cm−1 were found to be decreased at biodegradation stage-I (Fig. 7b and e), due to the beginning of the breaking down of the cross-linked network. However, the degradation of individual compounds like Av, poly(AA-ipn-AAm) and MBA started in biodegradation stage-II (Fig. 7c and f). In the third stage of biodegradation, most of the FTIR peaks initially observed in the FT-IR spectrum of Av-cl-poly (AA-ipn-AAm) were shifted (Fig. 7d and g). Thus, FT-IR confirmed that the grafted chains of poly (AA-ipn-AAm) and Av were completely biodegraded within three weeks.33,35

![[thin space (1/6-em)]](https://www.rsc.org/images/entities/char_2009.gif) qe is not always equal to the intercept of the plot (log
qe is not always equal to the intercept of the plot (log![[thin space (1/6-em)]](https://www.rsc.org/images/entities/char_2009.gif) qe − qt) vs. t.
qe − qt) vs. t.


![[thin space (1/6-em)]](https://www.rsc.org/images/entities/char_2009.gif) qe = ln
qe = ln![[thin space (1/6-em)]](https://www.rsc.org/images/entities/char_2009.gif) qm − kDε2
qm − kDε2


![[thin space (1/6-em)]](https://www.rsc.org/images/entities/char_2009.gif) qe vs. ln
qe vs. ln![[thin space (1/6-em)]](https://www.rsc.org/images/entities/char_2009.gif) Ce, ln
Ce, ln![[thin space (1/6-em)]](https://www.rsc.org/images/entities/char_2009.gif) qe vs. ε2, qe vs. ln
qe vs. ε2, qe vs. ln![[thin space (1/6-em)]](https://www.rsc.org/images/entities/char_2009.gif) Ce, ln[(kR(Ce/qe) − 1] vs. ln
Ce, ln[(kR(Ce/qe) − 1] vs. ln![[thin space (1/6-em)]](https://www.rsc.org/images/entities/char_2009.gif) Ce and ln[qe/(qm − qe)] vs. ln
Ce and ln[qe/(qm − qe)] vs. ln![[thin space (1/6-em)]](https://www.rsc.org/images/entities/char_2009.gif) Ce, respectively46–50 (Table 5).
Ce, respectively46–50 (Table 5).![[thin space (1/6-em)]](https://www.rsc.org/images/entities/char_2009.gif) ln
ln![[thin space (1/6-em)]](https://www.rsc.org/images/entities/char_2009.gif) kD
kD


![[thin space (1/6-em)]](https://www.rsc.org/images/entities/char_2009.gif) Kd vs. 1/T (Fig. 11) prove that the dye removal decreases as the temperature increases, thus indicating the exothermic nature of dye removal. The value of ΔG° is positive at all temperatures and it decreases with increasing temperature (Table 6). This shows that the dye removal process is not spontaneous and the dye removal is higher at low temperatures. The negative value of ΔH° confirms that the dye removal process is exothermic in nature.52–55
Kd vs. 1/T (Fig. 11) prove that the dye removal decreases as the temperature increases, thus indicating the exothermic nature of dye removal. The value of ΔG° is positive at all temperatures and it decreases with increasing temperature (Table 6). This shows that the dye removal process is not spontaneous and the dye removal is higher at low temperatures. The negative value of ΔH° confirms that the dye removal process is exothermic in nature.52–55
![[thin space (1/6-em)]](https://www.rsc.org/images/entities/char_2009.gif) kd
kd


