 Open Access Article
Reutilization of nanosecond pulse laser energy and its performance in single particle triggered LIBS
Pingwei Zhou ,
Yu Zhu,
Shengfu Li and
Li-guo Zhu*
Institute of Fluid Physics, China Academy of Engineering Physics, Mianyang, Sichuan 621900, P. R. China. E-mail: zhuliguo@tsinghua.org.cn
First published on 17th December 2018
Abstract
A method that can reutilize the energy of a nanosecond pulse laser beam and its performance in single particle triggered laser induced breakdown spectroscopy (LIBS) were studied. The propagation direction of the laser beam (Nd-YAG laser, 1064 nm, 9 ns and 0–80 mJ) was changed in an appropriate way and the energy overlapped at one point in space. In this setup, the energy used to break down pure air was reduced by 25% and the emission intensity of air plasma improved by 220% under the same pulse energy. Besides, the plasma temperature estimated by the relative line-to-continuum intensity ratio was improved by almost 900 K at 20 mJ. Furthermore, this method was applied in single particle triggered LIBS. NaCl particles with a diameter of ∼10 μm were used as the target sample and the scattered light of an 808 nm continuous laser beam was employed as a trigger signal to trigger the Nd-YAG laser. The emission line intensity of Na element was enhanced by 200%. This method can not only improve the emission intensity of a gas sample but can also be applied to single particle samples and has great significance in the application of ns-LIBS and the research and development of portable LIBS equipment.
1. Introduction
Laser induced breakdown spectroscopy (LIBS) is a powerful element analysis technique, based on the spectral analysis of characteristic emission from micro-plasma generated by the interaction between a focused high-energy laser beam and the sample.1–8 LIBS is a versatile tool in that it can determine the elemental composition of matter in any phase (solid, liquid, and gas). Some special samples like aerosols or particles in flames can also be detected by LIBS.9–13 Due to its attractive advantages, including real-time monitoring, fast response and no sample preparation, LIBS exhibits great potential in nuclear reaction detection, space exploration, environmental monitoring, archaeological verification, mining, etc. However, the sensitivity and accuracy of LIBS are still unsatisfactory, which is a great block to its continued development.Nanosecond laser is widely used in the LIBS technique due to its large adjustable range of energy, good pulse stability and long lifetime. Its acceptable cost and excellent mechanical stability make nanosecond laser more popular as a pump source in LIBS equipment. In order to improve the sensitivity and accuracy of nanosecond LIBS (ns-LIBS), many methods have been developed, such as dual-pulse excitation, spatial confinement, microwave-assisted LIBS flame-enhanced LIBS,14–22 etc. In these methods, dual-pulse excitation plays an important role and has proved to be a very effective way to improve the analytical performance of ns-LIBS. However, most of these methods require the introduction of new devices and suffer from system complexity or operation inconvenience. Some easy techniques that can enhance optical emission may have great significance in the application of ns-LIBS.
The confinement of a continuous wave to improve light–matter interaction has been widely studied,23 but few researchers have considered the short pulsed laser beam. It is widely known that light travels 0.3 m in 1 ns, and this means that the energy of a 1 ns pulse laser can be distributed by 0.3 m in space. When the propagation direction of the pulse laser is changed in an appropriate way, the energy can be overlapped at one point, and at this point, the energy will be larger than that at any other point in the optical path. In this work, the above method was used to improve the performance of LIBS using a single pulse nanosecond laser beam. Using this method, a lower energy can be used to breakdown pure air and generate plasma and the emission intensity of air plasma can be enhanced by two times under the same pulse energy. When using this method in single particle triggered LIBS, a higher emission intensity can be measured under a lower pulse energy. The advantage of this method is that when the pulse energy is not sufficient to generate the plasma, the overlapped point can reach the threshold, which cannot be achieved by any other methods. Furthermore, this method has great significance in the application of ns-LIBS and the research and development of portable LIBS equipment.
2. Experimental setup
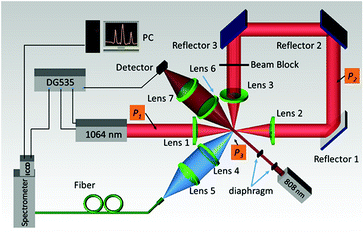
A schematic diagram of the single particle triggered LIBS setup used in this work is shown in Fig. 1. A Q-switched Nd:YAG laser (Beamtech Optronics, Lapa series, pulse duration of 9 ns) operating at 1064 nm and 20 Hz was used. The laser beam was focused by a plano-convex lens (Lens 1) with a focus length f = 50 mm and an approximate focus spot diameter of 25 μm. Subsequently, the laser beam was collimated by another plano-convex lens (Lens 2), and the propagation direction was changed by reflector 1, 2 and 3, then focused by a plano-convex lens (Lens 3) at the same point as the focus spot of Lens 1. The distance of the optical path from the focus point of lens 1 to that of lens 3 is about 0.6 m, which equals 2 ns of laser in a time scale. The luminescence emission from the plasma was collected by a pair of fused quartz lenses with the same focus length f = 50 mm and focused onto a UV fusing quartz fiber (200 μm) that was matched to a 0.75 meter Czerny–Turner spectrometer (Andor Technology, Shamrock 750). An intensified charge-coupled device (ICCD) (Andor Technology, iStar 334T) was equipped to analyse the spectra. The ICCD was sequentially triggered by the laser system, the ICCD detector start signal integration had a delay time of 0 ns relative to the laser beam and the gate time was set to 1 μs. When the setup worked in the triggered pattern, the Q-switched Nd:YAG laser and the ICCD were sequentially triggered by a digital delay generator (Stanford Research Systems, DG535), and the DG535 was triggered by the scattering signal generated when a single particle passed through an 808 nm continued laser beam (5 mW, 200 μm × 2 mm). The distance of the center of the 808 nm continued laser beam and the focus point of the 1064 nm pulsed laser beam was adjusted to be 500 μm, and the delay time from the scattering signal to the pulsed laser beam was set to be 247 μs to ensure that the pulsed laser has the right effect on the single particle.3. Results and discussion
3.1. The spectra of plasma
In this experiment, we found that there is a part of the pulsed laser beam that can pass through the air plasma and cannot be utilized again in the process of air plasma generation. If this part of the laser beam was reflected in an appropriate way and then focused again right at the position of the air plasma, the wasted energy can be reutilized. In this method, the emission spectra of air plasma generated by a single pulse laser beam was investigated and are shown in Fig. 2. The red line shows the spectra recorded using the LIBS setup shown in Fig. 1 without a beam block, and the blue line shows the situation when the beam block was used to prevent the propagation of the leftover pulse laser beam. We defined the former case to be reutilized-single-pulse LIBS (RUSP-LIBS) and the latter one to be single-pulse LIBS (SP-LIBS). Generally, the spectra consist of continuous spectra [Bremsstrahlung emission (free–free transitions) and radiative recombination (free-bound transitions)] and a series of nitrogen and oxygen lines, e.g., N I at 742.3, 744.1, 746.8, and 868.0 nm, N II at 463.0, 500.5, 567.9, and 594.2 nm, O I at 777.2, 822.7, and 844.6 nm, H I at 656.2 nm, etc. In Fig. 2, it is easy to find the continuous spectra and the special line spectra both for RUSP-LIBS and SP-LIBS. When the single pulsed energy is adjusted to be 20 mJ, both the continuous emission intensity and the line emission intensity of RUSP-LIBS are stronger in contrast to that of SP-LIBS. As the single pulsed energy increases from 20 mJ to 38 mJ, the emission intensity of RUSP-LIBS is always stronger than that of SP-LIBS, but the gap between them becomes smaller. As the single pulsed energy further increases up to 48 mJ and 56 mJ, there is no obvious distinction between the spectra of RUSP-LIBS and SP-LIBS. Besides, the breakdown threshold of air in this LIBS setup was also measured, which reduced by 25% from 16 mJ in SP-LIBS to 12 mJ in RUSP-LIBS. This can be attributed to the stronger energy intensity at the focus point in RUSP-LIBS in contrast to that in SP-LIBS.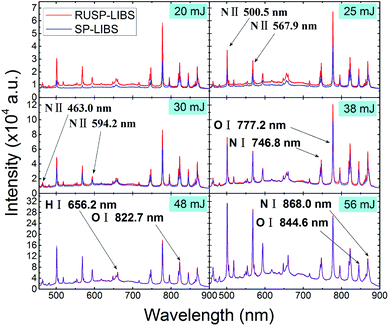 | ||
| Fig. 2 The emission spectra of air plasma generated by a 1064 nm pulse laser in RUSP-LIBS (red line) and SP-LIBS (blue line) under pulsed energy of 20, 25, 30, 38, 48 and 56 mJ, respectively. | ||
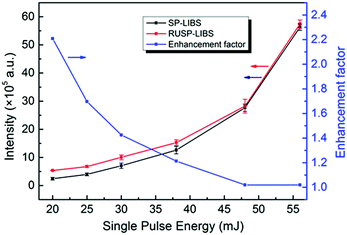
To better understand the influence of RUSP-LIBS, we removed the continuous spectra and only compare the emission line intensity. The enhancement factors at each wavelength under different single pulse energies were calculated and are shown in Fig. 3. Obviously, the enhancement factor reached the maximum value at 20 mJ, and then reduced with increasing energy, finally becoming almost 1 at 48 and 56 mJ. Furthermore, the enhancement factor of N II is much bigger than that of N I under a low pulse energy such as 20 mJ or 25 mJ. Subsequently, the integrated emission intensity from 450 nm to 900 nm both in RUSP-LIBS and SP-LIBS was calculated. As shown in Fig. 4, the integrated emission intensity increased gradually, but the enhancement factor reduced with the increase of single pulse energy. The enhancement factor reached its maximum at 20 mJ, but it was negligible at 48 and 56 mJ. Because when the single pulse energy is set to be 20 mJ, the air plasma is weak, and the absorption is also weak, the utilization efficiency is low enough in SP-LIBS so that a large part of the energy passes through the air plasma, and this energy can be reutilized in RUSP-LIBS to improve the utilization efficiency. But, with the increase of single pulse energy, the air plasma gets stronger, and the absorption also gets stronger, the utilization efficiency increases in SP-LIBS, the amount of energy passing through the air plasma becomes lower, and the difference between RUSP-LIBS and SP-LIBS gradually becomes inconspicuous.
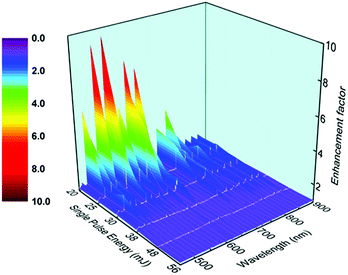 | ||
| Fig. 3 The enhancement factor at each wavelength of the emission intensity in RUSP-LIBS compared to that in SP-LIBS under a single pulsed energy of 20, 25, 30, 38, 48 and 56 mJ, respectively. | ||
3.2. The electron temperature
The influence of the plasma temperature was studied to understand the increase of line emission intensity obtained in RUSP-LIBS. Under the assumption of a local thermodynamic equilibrium (LTE), the population densities of atomic or ionic electronic states are described by Boltzmann distributions and the electron temperature Te can be assumed to be equal to the excitation temperature Texc. Therefore, Te can be estimated by the relative line-to-continuum intensity ratio, and the equation for the method is given by:24,25where Cr = 2 × 10⁵; εl and εc are the line emission coefficient and the continuum coefficient, respectively; the εl/εc ratio can be calculated from the integrated line intensity and continuum intensity for a certain bandwidth (Δλ); Akigk is the Einstein transition probability weighted by the upper energy level degeneracy; Ui is the partition function for the ion, which is a weak function of temperature; λc and λl are the continuum wavelength and center wavelength of the spectral line in nm units, respectively, and it is assumed that λc very nearly equals λl; Ei and Ek are the ionization potential and the upper level energy, respectively; ΔEi is the decrease of the ionization potential of atoms in the presence of a field of ions and it is small enough to be insignificant; ξ and G are the free-bound continuum correction factor and the free–free Gaunt factor, respectively, and for nitrogen, we have used ξ = 1.8 and G = 1.1 obtained for argon;24 the constants h, c and k are the Planck constant, the speed of light and the Boltzmann constant, respectively.
In this work, the N II 594.2 nm line to continuum ratio was used to deduce the electron temperature. Since only the time-integrated emission was measured with a delay time of 0 ns and a gate time of 1 μs, the time-averaged electron temperature during the first 1 μs was obtained. Furthermore, the difference in the air plasma generation process between RUSP-LIBS and SP-LIBS is right in this duration. Fig. 5 shows the evolution of the electron temperature as a function of single pulse energy both in RUSP-LIBS and SP-LIBS. Fig. 5 shows that the electron temperature both in RUSP-LIBS and SP-LIBS becomes higher as the single pulse energy increases. The electron temperature was 8050 K in RUSP-LIBS at 20 mJ, which is 12% higher than the value of 7178 K in SP-LIBS. When the single pulse energy was adjusted to be 25 and 30 mJ, the electron temperature was 8143 K and 8282 K in RUSP-LIBS, which are 5.7% and 2% higher than that in SP-LIBS. As the single pulse energy was increased up to 38, 48 and 56 mJ, the electron temperature in RUSP-LIBS was almost equal to that in SP-LIBS. The upward trend in electron temperature can be found to strongly correspond with the emission intensity and the enhancement factor discussed in Section 3.1.
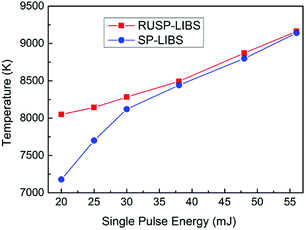 | ||
| Fig. 5 The electron temperature as a function of single pulse energy in RUSP-LIBS compared to that in SP-LIBS. | ||
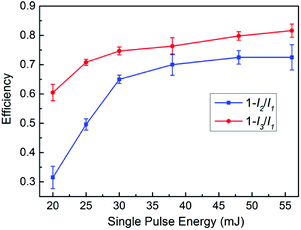
The whole energy of a single pulse laser beam can be separated into three parts in the generation process of air plasma: the first part of the energy provides the ionization energy of air, holds up the air plasma, and finally converts to the continuous emission and emission of the nitrogen and oxygen lines; the second part of the energy can pass through the air plasma, and then be measured by an energy meter at the end of the propagation direction; the third part of the energy is scattered by the air plasma, or absorbed and reflected by the optics elements such as the lens and reflectors. In this work, we use the whole energy and the second part of the energy to calculate the energy utilization efficiency in the air plasma generation process. The energy of the single pulse laser beam at position 1 (P1) and position 3 (P3) in RUSP-LIBS and at position 1 (P1) and position 2 (P2) in SP-LIBS, P1, P2 and P3, are pointed out in Fig. 1. As shown in Fig. 6, the utilization efficiency in RUSP-LIBS is always higher than that in SP-LIBS. The difference is relatively great at its maximum from 32.3% to 60.5% (increasing by 87.3%) at 20 mJ, then it reduces at 25 and 30 mJ, and finally becomes steady at 38, 48 and 56 mJ. Furthermore, the trend of utilization efficiency strongly corresponds to the emission intensity and the enhancement factor discussed in the Section 3.1.
3.3. Single particle triggered LIBS
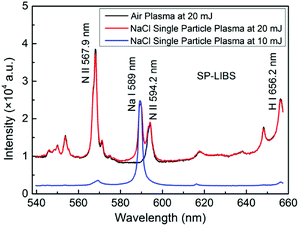
The advantage of RUSP-LIBS in contrast to SP-LIBS was investigated in Section 3.1 and 3.2, and the experimental results indicate that RUSP-LIBS can reduce the breakdown threshold of a gas sample or enhance the emission intensity under the same pulse energy compared to SP-LIBS. In this section, the performance of single particle triggered RUSP-LIBS was investigated using a NaCl particle. Firstly, the value of single pulse energy was studied using a NaCl particle with a diameter of ∼100 μm in SP-LIBS. The energy was adjusted to be 20 mJ and 10 mJ, which are higher and lower than the breakdown threshold of air, respectively. Fig. 7 shows the emission spectra of pure air plasma at 20 mJ (black line), NaCl single particle plasma in air at 20 mJ (red line) and NaCl single particle plasma in air at 10 mJ (blue line). The emission spectra of the NaCl particle at 20 mJ contain the emission line of Na element and the air plasma emission. In this situation, the emission line of Na element is obscured in the emission spectra of air plasma and is not obvious. The situation is different in the spectra of the NaCl particle at 10 mJ, which contain a prominent emission line of Na element and a very small contribution of the emission spectra of the air plasma background. So, in single particle triggered LIBS, when the pulse energy is adjusted to be under the breakdown threshold of air, the emission spectra of the single particle plasma become clearer and contain little air plasma emission background, which can be insignificant.Based on the experimental results, the single pulse energy was adjusted to be 10 mJ, and a NaCl particle with a diameter of ∼10 μm, which is less than the size of focus point, was used. The emission line of Na element (588.9 nm and 589.6 nm) was measured both in RUSP-LIBS and SP-LIBS. As shown in Fig. 8, the particular emission line of Na element can be obviously seen in both cases, and the emission intensity in RUSP-LIBS was about 2 times higher than that in SP-LIBS. Besides, the signal to noise ratio (SNR) was also calculated to be 67 in RUSP-LIBS, which is 31% higher than the value of 51 in SP-LIBS. It must be pointed out that when using a NaCl particle with a diameter of ∼100 μm, the emission intensity was almost the same in both RUSP-LIBS and SP-LIBS. Because the size of the NaCl particle is larger than the focus point, the energy of the laser beam is almost completely absorbed by the NaCl particle. In this situation, little energy of the laser beam can pass through the plasma and be reutilized. The above results indicated that the emission intensity and SNR can also be improved in single particle triggered RUSP-LIBS when the diameter of the particle is less than the size of the focus point of the laser beam.
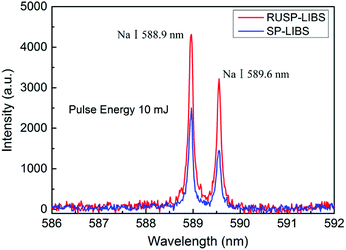 | ||
| Fig. 8 The Na element emission spectra of the plasma of a NaCl single particle (∼10 μm) in pure air under the pulse energy of 10 mJ in RUSP-LIBS compared to that in SP-LIBS. | ||
4. Conclusions
In this work, a method that can reutilize the energy of a nanosecond pulse laser beam was described wherein the propagation direction of the laser beam was changed in an appropriate way and the energy overlapped at one point in space. In this method, the energy used to break down pure air was reduced by 25% and the emission intensity of air plasma improved by 220% under the same pulse energy. Besides, the plasma temperature estimated by the relative line-to-continuum intensity ratio was improved by almost 900 K at 20 mJ. Furthermore, this method was applied in single particle triggered LIBS. When the single pulse energy was lower than the breakdown threshold of air, the emission spectra contain a small amount of air plasma background. Subsequently, the emission line intensity of Na element in the spectrum of the NaCl particle with a diameter of ∼10 μm was enhanced by 200%. This indicated that the method can not only improve the emission intensity of a gas sample but can also be applied to single particle samples. Besides, the lower single pulse energy and the higher emission intensity have great significance in the application of ns-LIBS and the research and development of portable LIBS equipment.Conflicts of interest
There are no conflicts to declare.Acknowledgements
This work was supported by the National Key R&D Program (No. 2017YFC1200400 and 2016YFC1202600), the National Natural Science Foundation of China (No. 61605189), and the Developmental Foundation of Institute of Fluid Physics (No. SFZ20150302).Notes and references
- Z. Q. Hao, L. Liu, M. Shen, X. Y. Yang, K. H. Li, L. B. Guo, X. Y. Li, Y. F. Lu and X. Y. Zeng, Opt. Express, 2016, 24(23), 26521–26528 CrossRef CAS PubMed.
- C. G. Parigger, Spectrochim. Acta, Part B, 2013, 79–80, 4–16 CrossRef CAS.
- F. C. De Lucia Jr, R. S. Harmon, K. L. McNesby, R. J. Winkel Jr and A. W. Miziolek, Appl. Opt., 2003, 42(30), 6148–6152 CrossRef.
- V. Sturm and R. Noll, Appl. Opt., 2003, 42(30), 6221–6225 CrossRef CAS PubMed.
- Y. Zhao, L. Zhang, S. X. Zhao, Y. F. Li, Y. Gong, L. Dong, W. G. Ma, W. B. Yin, S. C. Yao, J. D. Lu, L. T. Xiao and S. T. Jia, Front. Phys., 2016, 11(6), 217–230 Search PubMed.
- F. C. De Lucia Jr, J. L. Gottfried and A. W. Miziolek, Opt. Express, 2009, 17(2), 419–425 CrossRef.
- X. K. Shen, J. Sun, H. Ling and Y. F. Lu, Appl. Phys. Lett., 2007, 91(8), 081501 CrossRef.
- F. Hilbk-Kortenbruck, R. Noll, P. Wintjens, H. Falk and C. Becker, Spectrochim. Acta, Part B, 2001, 56(6), 933–945 CrossRef.
- C. M. Davies, H. H. Telle and A. W. Williams, Anal. Bioanal. Chem., 1996, 355(7–8), 895–899 CrossRef CAS PubMed.
- M. Corsi, G. Cristoforetti, M. Hidalgo, S. Legnaioli, V. Palleschi, A. Salvetti, E. Tognoni and C. Vallebona, Appl. Opt., 2003, 42(30), 6133–6137 CrossRef CAS.
- X. K. Shen, H. Wang, Z. Q. Xie, Y. Gao, H. Ling and Y. F. Lu, Appl. Opt., 2009, 48(13), 2551–2558 CrossRef CAS.
- R. E. Neuhauser, U. Panne and R. Niessner, Anal. Chim. Acta, 1999, 392(1), 47–54 CrossRef CAS.
- Z. H. Tian, M. R. Dong, S. S. Li and J. D. Lu, Spectrochim. Acta, Part B, 2017, 136, 8–15 CrossRef CAS.
- L. B. Guo, B. Y. Zhang, X. N. He, C. M. Li, Y. S. Zhou, T. Wu, J. B. Park, X. Y. Zeng and Y. F. Lu, Opt. Express, 2012, 20(2), 1436–1443 CrossRef CAS PubMed.
- L. Liu, X. Huang, S. Li, Y. Lu, K. Chen, L. Jiang, J. F. Silvain and Y. F. Lu, Opt. Express, 2015, 23(11), 15047–15056 CrossRef CAS PubMed.
- M. A. Gondal, T. Hussain, Z. H. Yamani and Z. Ahmed, Bull. Environ. Contam. Toxicol., 2017, 78, 270–274 CrossRef PubMed.
- L. B. Guo, W. Hu, B. Y. Zhang, X. N. He, C. M. Li, Y. S. Zhou, Z. X. Cai, X. Y. Zeng and Y. F. Lu, Opt. Express, 2011, 19(15), 14067–14075 CrossRef CAS PubMed.
- R. Sanginés, H. Sobral and E. Alvarez-Zauco, Appl. Phys. B, 2012, 108(4), 867–873 CrossRef.
- Y. A. Liu, M. Baudelet and M. Richardson, J. Anal. At. Spectrom., 2010, 25(8), 1316–1323 RSC.
- W. Zhou, K. Li, X. Li, H. Qian, J. Shao, X. Fang, P. Xie and W. Liu, Opt. Lett., 2011, 36(15), 2961–2963 CrossRef CAS PubMed.
- R. W. Coons, S. S. Harilal, S. M. Hassan and A. Hassanein, Appl. Phys. B, 2012, 107(3), 873–880 CrossRef CAS.
- V. I. Babushok, F. C. DeLucia Jr, J. L. Gottfried, C. A. Munson and A. W. Miziolek, Spectrochim. Acta, Part B, 2006, 61(9), 999–1014 CrossRef.
- J. U. White, J. Opt. Soc. Am., 1942, 32, 285–288 CrossRef.
- G. J. Bastiaans and R. A. Mangold, Spectrochim. Acta, 1985, 40B, 885–892 CrossRef CAS.
- X. L. Liu, S. H. Sun, X. S. Wang, Z. Y. Liu, Q. C. Liu, P. J. Ding, Z. Q. Guo and B. T. Hu, Opt. Express, 2013, 21(13), A704–A713 CrossRef CAS.
| This journal is © The Royal Society of Chemistry 2018 |

