
 Open Access Article
 This Open Access Article is licensed under a Creative Commons Attribution-Non Commercial 3.0 Unported Licence
Inorganic molecule (O2, NO) adsorption on nitrogen- and phosphorus-doped MoS2 monolayer using first principle calculations†
Hafiz Ghulam Abbas a,
Tekalign Terfa Debelab,
Sajjad Hussain*c and
Iftikhar Hussaind
a,
Tekalign Terfa Debelab,
Sajjad Hussain*c and
Iftikhar Hussaind
aDepartment of Nanoscience and Nanotechnology, Research Institute of Physics and Chemistry, Chonbuk National University, Chonbuk 561-756, Jeonju, Republic of Korea
bInstitute for Application of Advanced Material, Jeonju University, Chonju Chonbuk 55069, Republic of Korea
cDepartment of Nano and Advanced Materials Engineering, Sejong University, Seoul 143-747, Republic of Korea. E-mail: shussainawan@gmail.com; hussain@sejong.ac.kr
dSchool of Chemical Engineering, Yeungnam University, Gyeongsan, Gyeongbuk 38541, Republic of Korea
First published on 16th November 2018
Abstract
We performed a systematic study of the adsorption behaviors of O2 and NO gas molecules on pristine MoS2, N-doped, and P-doped MoS2 monolayers via first principle calculations. Our adsorption energy calculations and charge analysis showed that the interactions between the NO and O2 molecules and P–MoS2 system are stronger than that of pristine and N–MoS2. The spin of the absorbed molecule couples differently depending on the type of gas molecule adsorbed on the P- and N-substituted MoS2 monolayer. Meanwhile, the adsorption of O2 molecules leaves N- and P–MoS2 a magnetic semiconductor, whereas the adsorption of an NO molecule turns this system into a nonmagnetic semiconductor, which may provide some helpful information for designing new N- and P-substituted MoS2-based nanoelectronic devices. Therefore, P- and N–MoS2 can be used to distinguish O2 and NO gases using magnetic properties, and P–MoS2-based gas sensors are predicted to be more sensitive to detect NO molecules rather than pristine and N–MoS2 systems.
1. Introduction
Graphene, a single atomic layer of carbon atoms arranged in a hexagonal network, has drawn significant attraction from the scientific community due to its remarkable properties, and therefore has been efficiently implemented in electronics, energy devices, and gas sensors.1–4 However, it is known that graphene is a semi-metal with no bandgap by nature, chemically inert, and has intrinsic defects, making it less fascinating for some applications. Particularly, graphene-based gas sensors have achieved a sensitivity down to the single molecule level. In the last few years, the semiconducting relationship between graphene and molybdenum disulfide (MoS2) has drawn great attention, which results in excellent nanoelectronic, optoelectronics and energy harvesting properties.5 Nevertheless, the zero band gap of graphene also limits its application in low-power electronics and digital circuits. Recently, considerable interest has been focused on layered transition metal dichalcogenides (LTMDs), especially monolayer molybdenum disulfide (MoS2). MoS2 offers an attractive semiconductor option due to its direct band gap (∼1.74 eV), ideal subthreshold swing of ∼60 mV dec−1, high current on/off ratio (108) and large in-plane carrier mobility of (∼200 cm2 V−1 S−1) at room temperature, which shows potential for transistor applications.6,7Owing to its high surface to volume ratio, monolayer MoS2 can be considered the best candidate for gas sensing. It has already been demonstrated that gas sensors based on MoS2 have higher sensitivity for NO2 gas than graphene oxide field-effect transistor sensors. Consequently, below the 0.8 ppm detection limit, MoS2-based gas sensors show more sensitivity for NO gas.7,8 Previous research results have shown that the adsorption of gas molecules is physisorption on pristine MoS2 and graphene monolayers.9,10 Their gas sensitivity can be enhanced by introducing sulfur vacancies or dopants.11,12 For instance, metal and non-metal dopants significantly improve the gas sensing performance of graphene.13,14 On the other hand, Au, Fe, Co, and Ni-doped MoS2 monolayers increase the gas sensitivity for CO, NO, and O2 molecules.15–17 Similar to the case of graphene, dopants can play a key role in tuning the electronic structure properties and chemical reactivity of monolayer MoS2.18–21 Moreover, various defects can be induced in MoS2, as confirmed from previous experiments and theoretical calculations.22–24 Molecular doping at sulfur vacancies can be introduced reliably by electron irradiation, which provides an efficient way to tailor the properties of MoS2.25,26 Therefore, it is very interesting to explore the electronic properties of defective MoS2 monolayer via the adsorption of gas molecules. Accordingly, several theoretical works have reported the interaction between small inorganic (CO2, NO, CO, H2O, NO, NO2, H2, and N2) gas molecules with pristine and defective MoS2, and an enhancement in reactivity was also observed via NO2 molecule adsorption at the edges of MoS2.27–29 To the best of our knowledge, the effect of different gas molecules (O2 and NO) has not been demonstrated on doped monolayers MoS2 due to the lack of detailed experimental studies.13,30 Moreover, under experimental conditions, factors such as ambient water and oxygen may significantly affect the performance of field-effect transistors composed of MoS2 monolayers.31 Currently, it is obvious that toxic gases are a major challenge in the environmental pollution problem. Therefore, the study of gas molecule adsorption, identifying the best gas sensors such as MoS2-based gas sensors, and their fabrication play a pivotal role in detecting toxic gas molecules.
We chose P-doped and N-doped atoms as dopants because inert sulfur (S) atoms cover the active sites of Mo atoms, causing poor chemical reactivity of the pristine MoS2 in most stable 2H phase. The dopants enhance the conductivity of the system, tailor its electronic properties and improve the bonding of gas molecules on MoS2. In addition, P–MoS2 and N–MoS2 doping has been observed experimentally,32,33 and their formation energies indicate that they can be easily incorporated into an MoS2 monolayer. Moreover, P and S atoms have a similar covalent radius and belong to the same family, which suggest that they may easily form stable chemical bonds with Mo atoms. NO gas is the main air pollutant generated from the combustion of nitrogen and oxygen in the atmosphere, and its existence causes serious health problems. Therefore, the measurement of the concentration of oxygen and NO in the environment is of special interest and importance. Herein, we investigate NO and O2 gas molecule adsorption on pristine, N- and P-doped monolayer MoS2 using first principle calculations. It was probed that N- and P-doped MoS2 have high chemical stability. As a result, the electronic structure and charge analysis of N and P-doped MoS2 suggest that these systems are promising candidates for the sensing of gas molecules and as alternative catalysts to the graphene system.
2. Computational details
Geometry optimizations were performed using the Vienna ab initio simulation package (VASP).34,35 The electron–ion interactions were described using the projector-augmented wave (PAW) method, which is primarily a frozen-core all-electron calculation.35 Attractive van der Waals interactions were included using the Grimme correction for the PBE-D3 method.36 For structure optimization, atoms were relaxed in the direction of the Hellmann–Feynman force using the conjugate gradient method with an energy cut-off of 400 eV until a stringent convergence criterion (of 0.02 eV Å−1) was satisfied. Lattice constants were optimized using the PBE-D3 exchange-correlation functional. The accurate electronic structure calculations were performed using the PBE-D3 exchange-correlation functional.37 To simulate a low-dimensional MoS2 sheet, we used a 4 × 4 supercell model consisting of 32 atoms in the XY plane, where the optimized lattice constant along the two directions was 12.64 Å. The k-point sampling was done using Gamma centered 8 × 8 × 1 k-points.3. Results and discussion
Before we studied the adsorption of gas molecules on pristine, N- and P-substituted MoS2 monolayers, it was important to explore their electronic structure and structural stability based on their formation energies. The formation energy (Efrom) can be calculated from the relation:| Eform = Etot(MoS2–X) − Etot(MoS2) + n(μS) − m(μX) |
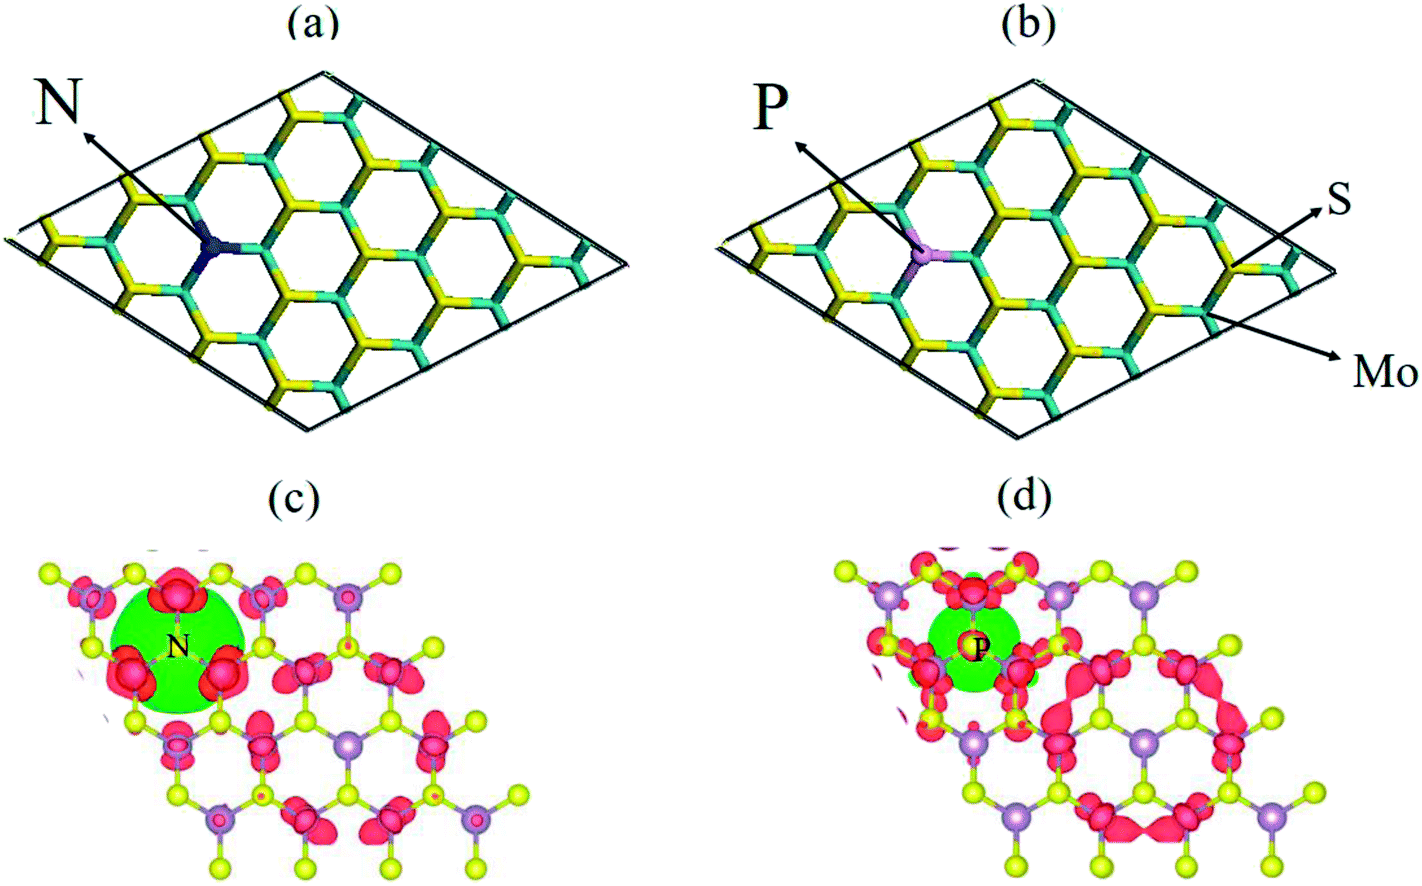 | ||
| Fig. 1 Top-view (a and b) chemical structure of the N- and P-doped (4 × 4) MoS2 monolayer, where the violet, yellow, green, and purple sticks represent the Mo, S, N and P atoms, respectively. (c and d) Spin-density (ρ↑–ρ↓) iso-surface plots for the N- and P-doped MoS2 monolayer, where the spin accumulation and depletion regions are represented by red and green colors, respectively. | ||
To explore the electronic properties of the pristine N and P substituted (4 × 4) MoS2 monolayer, spin and non-spin-polarized band structure calculations were performed, and their band structures are shown in Fig. 2(a)–(c). The spin total density of states (TDOS) and spin partial density of states (PDOS) projected to the atomic orbital of the N and P atoms as well as the neighboring Mo atoms are shown in Fig. S2 and S3,† respectively. The pristine MoS2 monolayer shows nonmagnetic semiconductor character and has a direct band gap of 1.74 eV, which is consistent with reported values.38 Compared with the pristine MoS2 monolayer, there are two localized electronic state locates around the Fermi-level in the band structure of N–MoS2 and P–MoS2, which are a result of the strong interaction between the N, P and Mo atoms. The pristine MoS2 monolayer conduction band mainly consists of d-states of Mo, while its valence band contains a combination of d-Mo and p-S states. The existence of a localized defect state near the valence band maximum is due to the strong hybridization with neighboring dz2 (Mo) and substituted pz (N) and pz (P) states, as shown in Fig. S2 and S3,† respectively. We observed that the substituted-atom p states are spin-polarized, which play an important role in the system magnetism. The presence of N and P atoms causes degeneracy in the band structure of the N–MoS2 and P–MoS2 monolayers, which changes the symmetry of the system. Our Bader charge analysis showed that there is 0.30 and 0.91e− charge transferring from monolayer MoS2 to the N and P atoms, which is consistent earlier reported values.12 Notably, we observed that p-type doping is achieved with N- and P-substituted atoms, which is consistent with experimental predictions.32,33
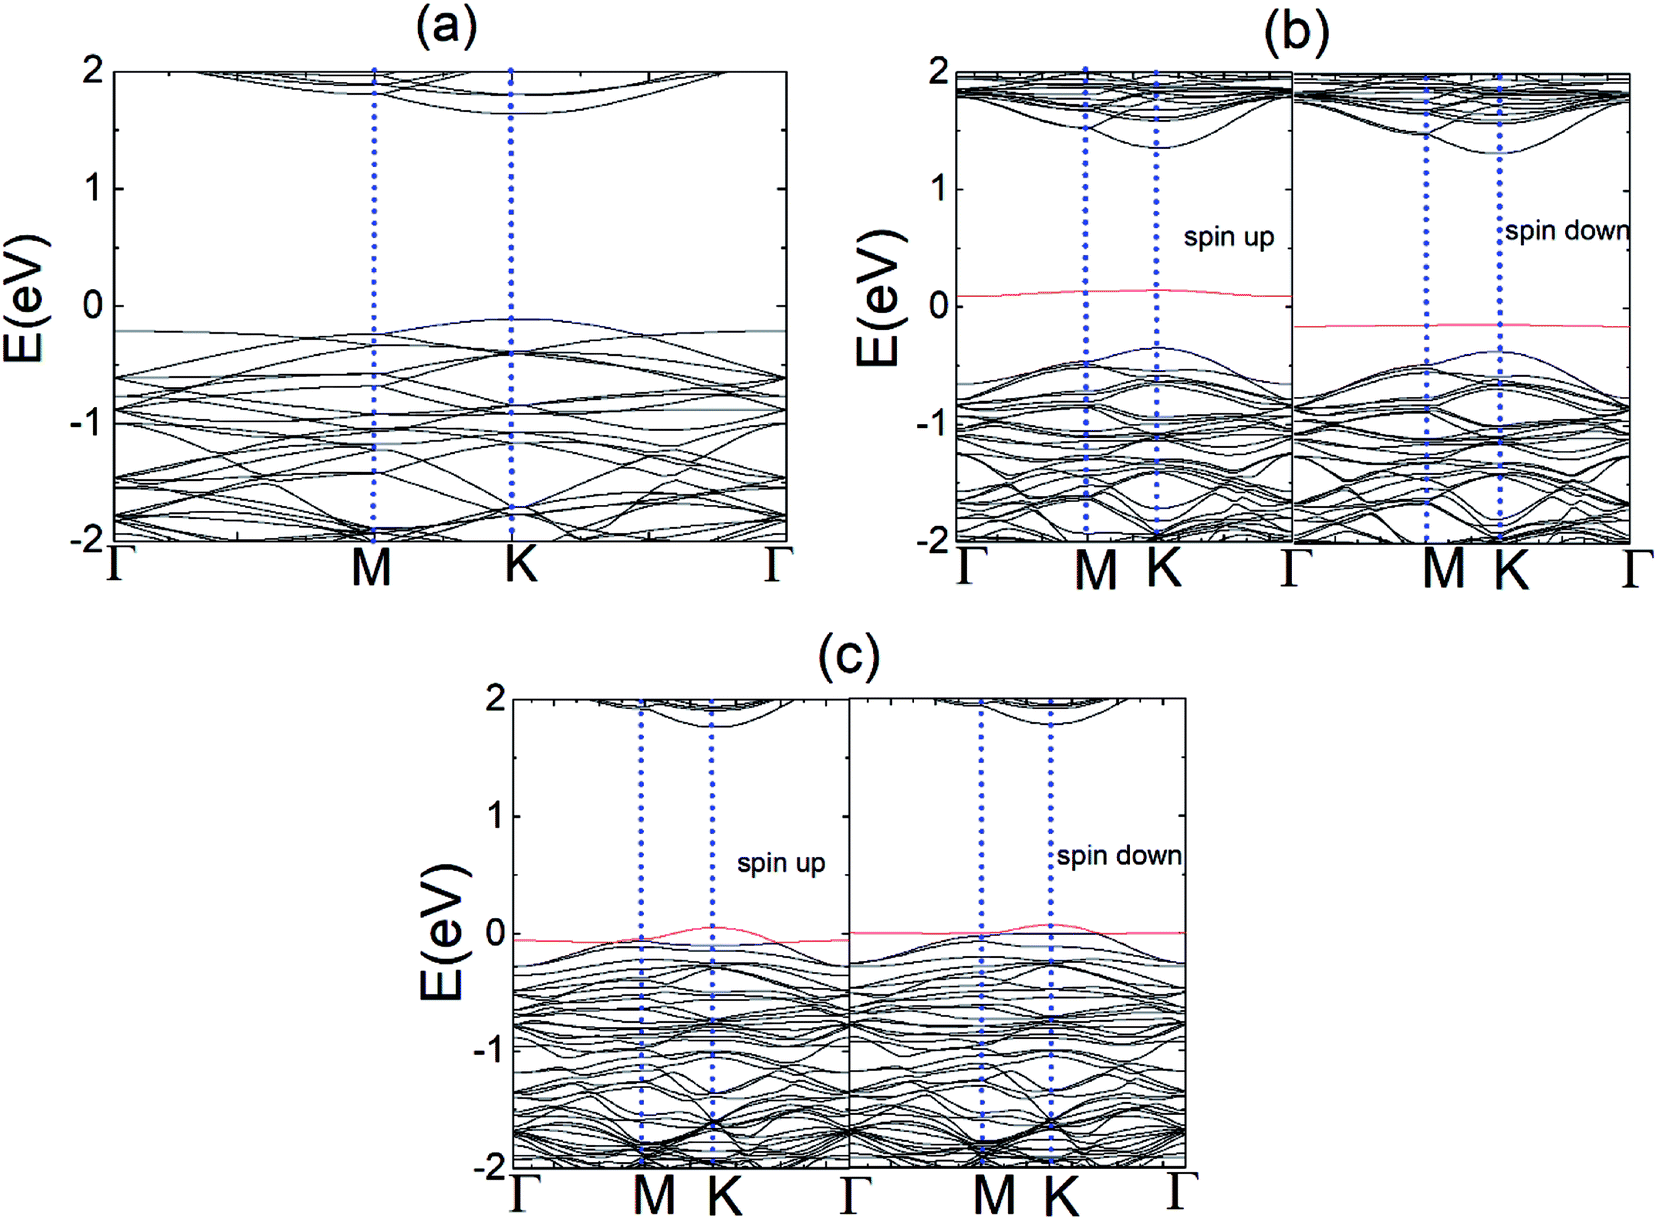 | ||
| Fig. 2 Band structures of (a) monolayer pristine MoS2, (b) N–MoS2 for the spin-up and spin-down states, and (c) P–MoS2 for the spin-up and spin-down states. The red line represents the state of the dopant atoms. | ||
Next, we delved into the adsorption of triplet molecular oxygen (3O2) on the pristine MoS2 monolayer. Accordingly, we calculated the adsorption of an oxygen molecule on the pristine MoS2. We considered two different attachments of the O2 gas molecule. In the parallel attachment (P), the two oxygen atoms of the O2 gas molecule are parallel to the MoS2 plane on the top of the sulfur atoms, while they are located on the MoS2 plane in the vertical attachment (V) on the top of the sulfur atom. Our calculation showed that the former configuration in the MoS2 monolayer is more stable than the latter by (0.04 eV). Therefore, our description will concentrate on P configurations.
Table 1 compares the adsorption energies (Ead) of the gas molecule for various configurations from the PBE-D3 calculations. Here, Ead is defined by the relation: Ead = ET(MoS2–O2) − ET(MoS2) − ET(O2), where ET is the total energy of an appropriate system. Here, the total energy of the complex and isolated O2 was obtained from the spin-polarized calculation. The configuration in which the O2 molecule is adsorbed on the MoS2 monolayer is indicated by its lower adsorption energy (−10 meV), which indicate weak physisorption between the O2 molecule and pristine single-layer MoS2. The O–O bond length is 1.24 Å, which remains the same as in the gas phase, which is also consistent with previous studies.13 Our charge analysis showed that a very small charge (0.03e) transfer from the MoS2 monolayer to the π* states of the O2 molecule. The adsorption energy of O2 on the pristine MoS2 monolayer is consistent with other reported values using the LDA and PBE-D3 functionals.13–45 Here, it is important to compare the adsorption energy of the O2 molecule on a pristine graphene sheet because it has been demonstrated to have a significant effect on the gas sensor properties. The Ead values are −0.04 and −0.11 eV, respectively,41 which are larger than that on the pristine MoS2 monolayer using the PBE and PBE-D2 functionals. Meanwhile, the calculated sulfur and oxygen atom distance of 3.38 Å does not indicate the formation of a chemical bond between the sulfur and oxygen atom, which is slightly shorter in the report by Ma et al.11 The spin-polarized calculation showed that the MoS2–O2 complex system shows a magnetic moment (1.62μB), where the spin density transfers to the Mo atom of the MoS2 monolayer. Fig. S4† shows the band structure of the MoS2–O2 system for the spin-up and spin-down states, where the O2 states are introduced above the Fermi level in the spin-down channel absorption of the O2 molecule; thus, the band gap in the spin-down channel absorption is reduced to 1.10 eV. While, the band gap in the spin-up channel absorption is 1.74 eV, which is equal to the value of the pristine single-layer MoS2. Specifically, the binding of an oxygen atom results in a weak p-type effect in the pristine MoS2 monolayer.
| Absorbent | Adsorbate (AB) | Eada (eV) | LX–Bd (Å) | Lob (Å) | Lc (Å) | ΔQe (e) | μ (μB) |
|---|---|---|---|---|---|---|---|
| a The adsorption energy per gas molecule to the pristine and N- or P-atom substituted MoS2 surface.b Interatomic distance of the adsorbed gas molecule before adsorption.c Interatomic distance of the adsorbed gas molecule after adsorption.d The interatomic distance between doped (X = S, N or P) and atom B of the adsorbed molecule. B represents the O or N atom when the adsorbed molecule is O2 or NO, respectively.e The total charge transfer from the MoS2 monolayer to the gas molecules. The amount of total charge transfer was defined as: ΔQ = Qmax − Qmin, where Qmax and Qmin correspond to the maximum and minimum charge values in the regions adjacent to the MoS2 layers and m(O2 and NO), respectively. | |||||||
| MoS2 | O2 | −0.01 | 3.38 | 1.24 | 1.24 | 0.03 | 1.62 |
| N–MoS2 | O2 | −0.32 | 1.68 | — | 1.27 | 0.21 | 0.83 |
| 2N–MoS2 | 2O2 | −0.22 | 1.50 | — | 1.30 | 0.40 | 1.68 |
| P–MoS2 | O2 | −1.27 | 1.65 | — | 1.57 | 0.25 | 0.80 |
| 2P–MoS2 | 2O2 | −1.22 | 1.65 | — | 1.57 | 0.40 | 1.62 |
| MoS2 | NO | −0.26 | 3.03 | 1.17 | 1.17 | — | 0.69 |
| N–MoS2 | NO | −0.56 | 2.20 | — | 1.15 | 0.11 | NM |
| 2N–MoS2 | 2NO | −0.37 | 2.18 | — | 1.14 | 0.24 | NM |
| P–MoS2 | NO | −1.44 | 1.93 | — | 1.20 | 0.14 | NM |
| 2P–MoS2 | 2NO | −1.38 | 1.93 | — | 1.20 | 0.28 | NM |
The condition was quite distinct and interesting when we adsorbed a gas molecule on the substituted N and P atom (4 × 4) MoS2 monolayer. Table S1† contains the adsorption and relative energy of the O2 molecule on N–MoS2 for distinct configurations. Fig. 3(a) and (b) exhibit the chemical structure of the N–MoS2–O2 complex system. According to the results, the adsorption of an O2 molecule on the MoS2 monolayer in the parallel attachment is more favorable than the vertical attachment. Considering the two different parallel configurations, in configuration P1, two oxygen atoms on the top of the N atom is significantly (1.99 eV) more stable than configuration P2, in which the O2 is molecule located far away from the N atom. Thus, O2 molecule adsorption on N–MoS2 is stronger than that in the pristine MoS2 monolayer. Indeed, the O–O atom distance is 1.27 Å, which indicates the charge distribution from the N-rich MoS2 to the oxygen atom of the O2 molecule is remarkable and the bonds become weaker. In addition, the O2 molecule resides closer to the N–MoS2 plane than that in the pristine MoS2, where the calculated N and oxygen atom distance is 1.68 Å (1.66 Å),42 which is shorter compared to that in the case of the MoS2–O2 complex. The spin polarization is also intensified on the O2 molecule and the magnetic moment (0.83μB) of the system is also reduced. The adsorption energy of the N–MoS2–O2 complex of −0.32 eV (−0.37)42 is slightly shorter in our calculations. On the other hand, the adsorption energy is appreciably large compared to that in the case of O2 molecule adsorption on N-doped graphene and BC3 graphene-like sheet doped with metal atoms.41–48 Next, we observed the adsorption of two oxygen molecules on the 2N–MoS2 monolayer, where two N atoms were doped afar to avoid interaction with the O2 gas molecules. Fig. S5(a) and (b)† shows the chemical structure of the 2N–MoS2–2O2 complex. Briefly, the adsorption energy (Ead) on the 2N–MoS2–2O2 complex system is −0.22 eV per oxygen molecule, which is smaller than that of the N–MoS2–O2 complex.
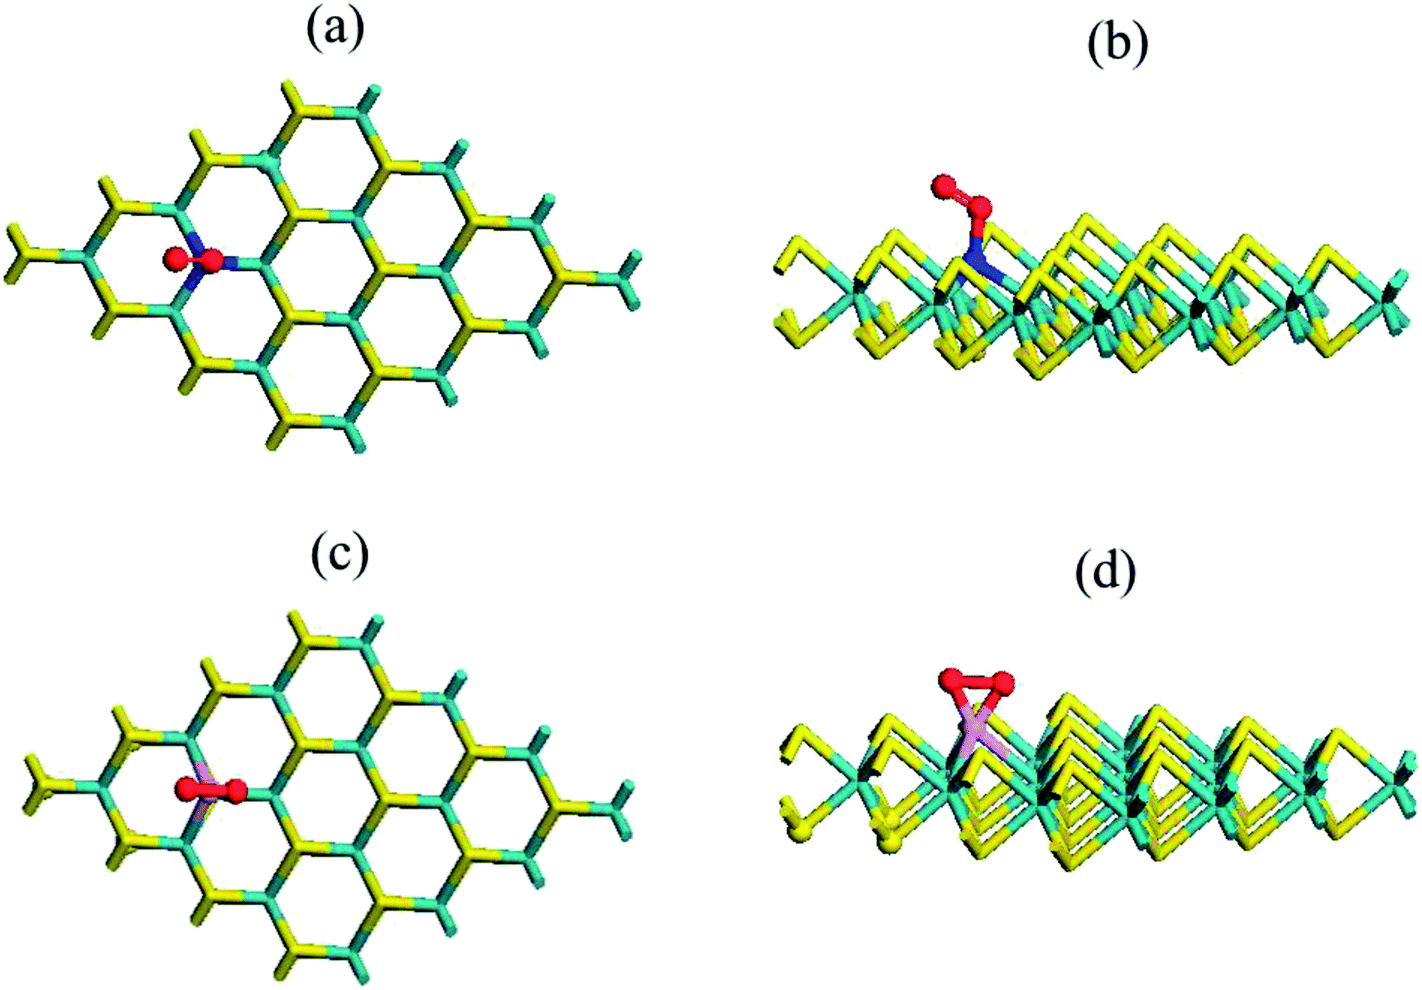 | ||
| Fig. 3 Top (a and c) and side (b and d) views of the chemical structure of the N- and P-substituted MoS2–O2 complex, where violet, yellow, green, red and purple sticks represent the Mo, S, N, O and P atoms, respectively. | ||
To understand this observation, we defined the change of the electron density (e Å−3) along the c-axis as Δρ(z) = {ρ(z)[N–MoS2–mO2] − ρ(z)[N–MoS2] − ρ(z)[mO2]}. Here, ρ(z) represents the electron density of an appropriate system described in the parentheses, which is averaged over the XY plane in a supercell. This calculation is based on the electron density of the N–MoS2–O2 complex subtracted from that of an isolated N–MoS2 single layer and O2 molecule in the same configurations of the same supercell. We note that the total charge of the complex is zero, although O2 will exist in the form of O2− ions after complex formation. Fig. 4(a) shows the Δq(z) of the O2 complex in the case of the N–MoS2 system. Here, Δq(z) = Δρ(z)ΔV, ΔV = Vcell/Nc, and Vcell and Nc (=216) are the volumes of the supercell and the number of fine grids along the c-axis, respectively. The thickness of each N–MoS2 layer is defined by the z coordinates of the sulfur atoms in the upper and lower sublayers (SL and SU, respectively) with z(SL) < z(SU). In each configuration, the thickness of the O2− ions is defined by the minimum and maximum of the z coordinates of all the atoms in the ions. The figure shows that there is a significant decrease in the Δq(z) in the O2 moiety, signaling the conversion of this moiety to an O2− ion. Fig. 4(a) shows that the transferred charge is mainly concentrated on the O2 molecule. For quantitative analysis, we defined the accumulated excess charge as: 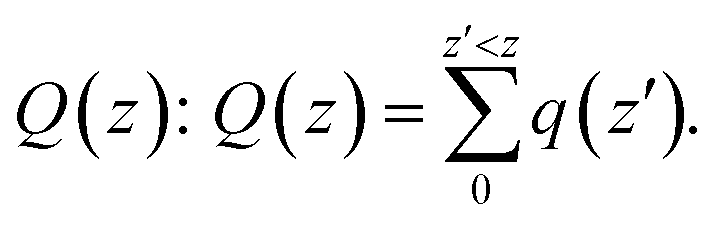 Next, the amount of charge transfer was defined by the relation: ΔQ = [Qmax(z) − Qmin(z)]. As shown in Fig. 4(a), Qmax(z) and Qmin(z) correspond to the maxima and minima adjacent to the N–MoS2 layers, respectively. Fig. 4(b) shows contour plots of the differential charge density Δρ(x, y, z), which is not integrated over the XY plane for the N–MoS2–O2 system. The charge accumulation and depletion regions are represented in red and green colors, respectively. The plots reveal a significant electron transfer from the N–MoS2 layer to the O2 molecule. Also, the majority of the transferred electrons are concentrated in the O2 molecule.
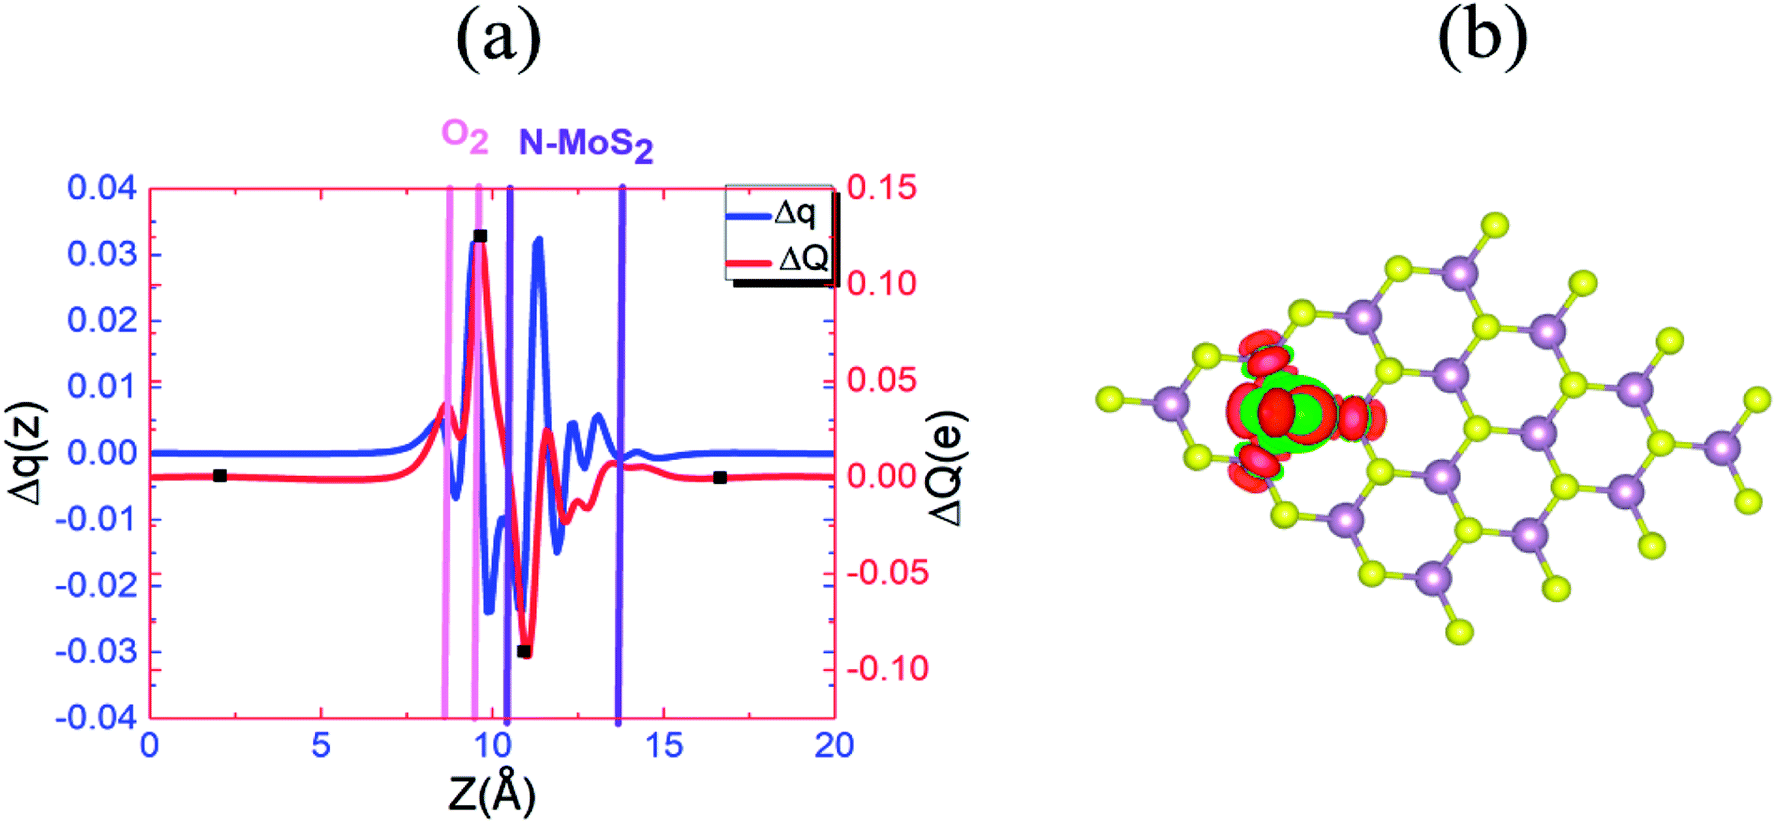 | ||
| Fig. 4 (a) Δq(z) and ΔQ(z) versus z for N–MoS2–O2, where the z values corresponding to Qmin(z) and Qmax(z) are shown by filled squares (■). (b) Differential charge density Δρ(x, y, z) contour plot for N–MoS2–O2, where the charge accumulation and depletion regions are represented by red and green colors, respectively. | ||
Fig. 5 represents the band structure of the N–MoS2–O2 complex system for the spin-up and spin-down states. In this case, the Fermi level shifted 0.23 eV downward, which may appear due to the large charge (0.40e) transfer from the nitrogen-rich MoS2 to the O2 molecule, which is consistent with the larger adsorption energy of O2 on N–MoS2. Due to the intermolecular interaction, the molecular level shifts upward and the spin-polarized π* state of the O2 molecule is located at 0.72 eV above the VBM, as shown in Fig. 5. The sharp peak of the spin-up at the Fermi level disappears due to large charge transfer or shifted below the Fermi level. Fig. 1(b) indicates the presence of a localized N atom state around the Fermi level in the spin-up and down states, while the absorption of an O2 molecule suppresses these states and it removed the substituted N atom states, as shown in Fig. 5. These findings are consistent with that observed previously.39,40 Our PDOS analysis presented in Fig. S6† also confirms that the p-O states are located at 0.05 and 0.07 eV below the CBM in the case of the spin-down and spin-up band structures, respectively. In contrast, the valence band mainly contains a combination of d-Mo and p-S states. Thus the band gaps in the spin-down and spin-up channels are 0.84 eV and 1.66 eV, respectively, which are significantly reduced compared to that in the MoS2–O2 system. Therefore, the more negative adsorption energy of the O2 molecule clearly exhibits oxygen binding introduces a strong p-type effect into the MoS2 monolayer with N atom substitution.
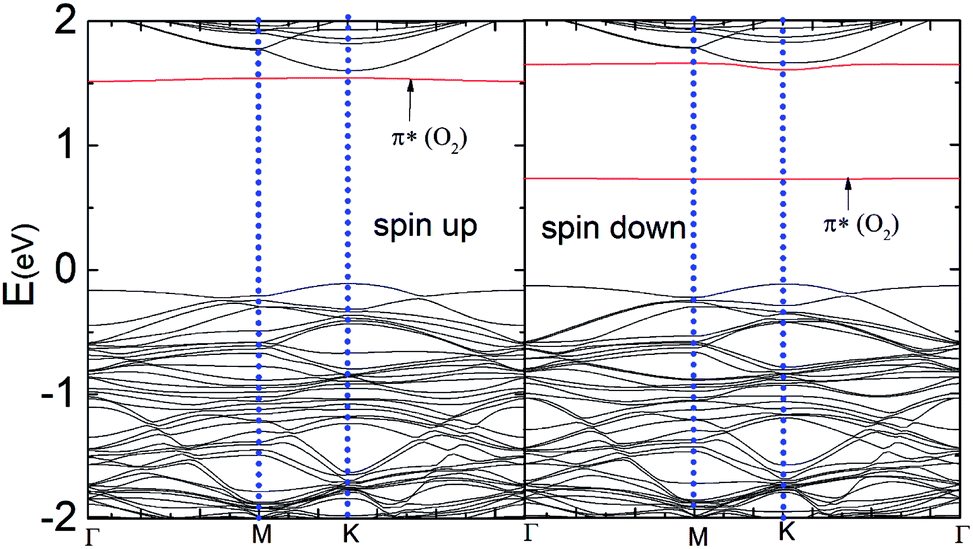 | ||
| Fig. 5 Band structure of the N–MoS2–O2 complex system for the spin-up and spin-down states. | ||
Considering this, we explored the P–MoS2 complex, which is distinct from the case of N–MoS2. Fig. 3(c) and (d) display the chemical structure of the P–MoS2–O2 complex. The P atom forms P–O1 and P–O2 bonds with the oxygen atom of the O2 molecule, which is a partial sp3 complex. The intended bond lengths are 2.48 Å for Mo–P, 1.66 Å for P–O1, and 1.64 Å for P–O2, which agree well with earlier reported values.42,43 Table 1 exhibits that the adsorption energy per O2 gas molecule is −1.27 eV, which is significantly larger compared to that of the N–MoS2–O2 and MoS2–O2 complex systems. Our adsorption energy value is significantly more negative than the earlier reported values (−0.87, −0.93, and −1.11 eV)42–45 for O2 adsorption on a P–MoS2 monolayer. In contrast, the adsorption energy (−1.26 eV)41 is comparable in the case of O2 adsorption on a P-doped graphene sheet. The distance between the substituted P atom of MoS2 and oxygen atom of the O2 gas molecule is 1.65 Å, which is slightly shorter compared to the N–O atom distance. In this case, we also examined two different configurations in the parallel (P) attachment, where configuration P1 is significantly (2.07 eV) more stable than configuration P2, in which the two oxygen atoms are far from the dopant atom. Subsequently, we determined the adsorption of two O2 gas molecules on the 2P–MoS2 monolayer and Fig. S5(c) and (d)† show the chemical structure of the 2P–MoS2–2O2 complex. In this case, the calculated adsorption energy is −1.22 eV per O2 molecule, which is comparable with that of the above-described P–MoS2–O2 complex system. The spin-polarized calculation shows that the systems become magnetic with 0.80 and 1.62μB, respectively, which confirms the spin density transferred to the Mo atom of the P–MoS2 monolayer.
Fig. 6(a) and (b) show the Δq(z) and contour plots Δρ(x, y, z) for the O2 complex in case of the P–MoS2 system. This figure shows that there is a significant decrease in Δq(z) in the O2 moiety and 0.25e charge transfer from the P–MoS2 monolayer to the gas molecule. It also displays that the transferred charge is mainly concentrated in the interlayer region adjacent to the O2 molecule, where the charge accumulation and depletion regions are represented in red and green, respectively. Subsequently, we explored the electronic properties of an O2 molecule adsorbed on P–MoS2 and calculated the band structure for the spin-up and spin-down states, as shown in Fig. 7. The presence of the localized state of P atom around the Fermi level in the spin-up and down states in the band structure of P–MoS2 was observed, while the absorption of an O2 molecule suppressed these stated and removed the P atom states, as shown in Fig. 7. On the other hand, the two spin-polarized π* states of the O2 molecule were introduced above and below the Fermi level in the spin-down and spin-up bands, which may be appear due to charge transfer from the substrate to the absorbed O2 molecule, as presented in Fig. S6.† The charge transfer to the spin-up and spin-down bonding and anti-bonding π* states is the origin of the significant elongation of the O–O (1.57 Å) bond. The enlargement of the O–O bond due to charge transfer indicates the significant weakening of the O–O bond and signals the conversion of this moiety to the O2− ion on the surface of the P–MoS2 monolayer. These findings are highly desirable for chemical reactions, such as the oxidation of CO, since breaking of O2 bonds is consider the key rate-limiting step.13
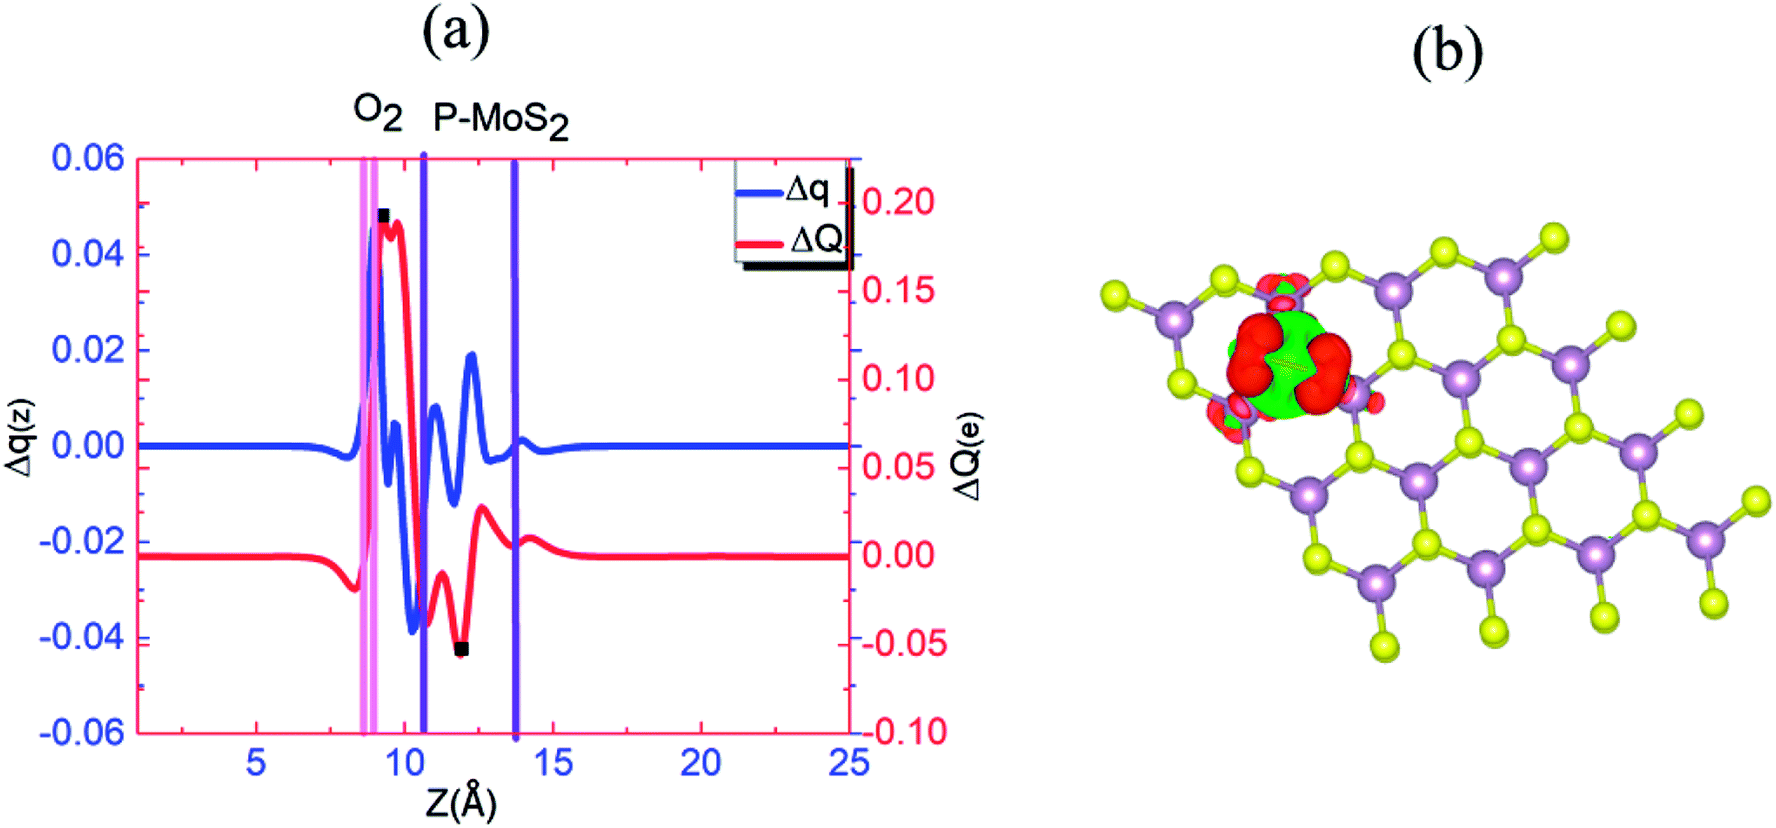 | ||
| Fig. 6 (a) Δq(z) and ΔQ(z) versus z for P–MoS2–O2, where the z values corresponding to Qmin(z) and Qmax(z) are shown by filled squares (■). (b) Differential charge density Δρ(x, y, z) contour plot for P–MoS2–O2, where the charge accumulation and depletion regions are represented by red and green colors, respectively. | ||
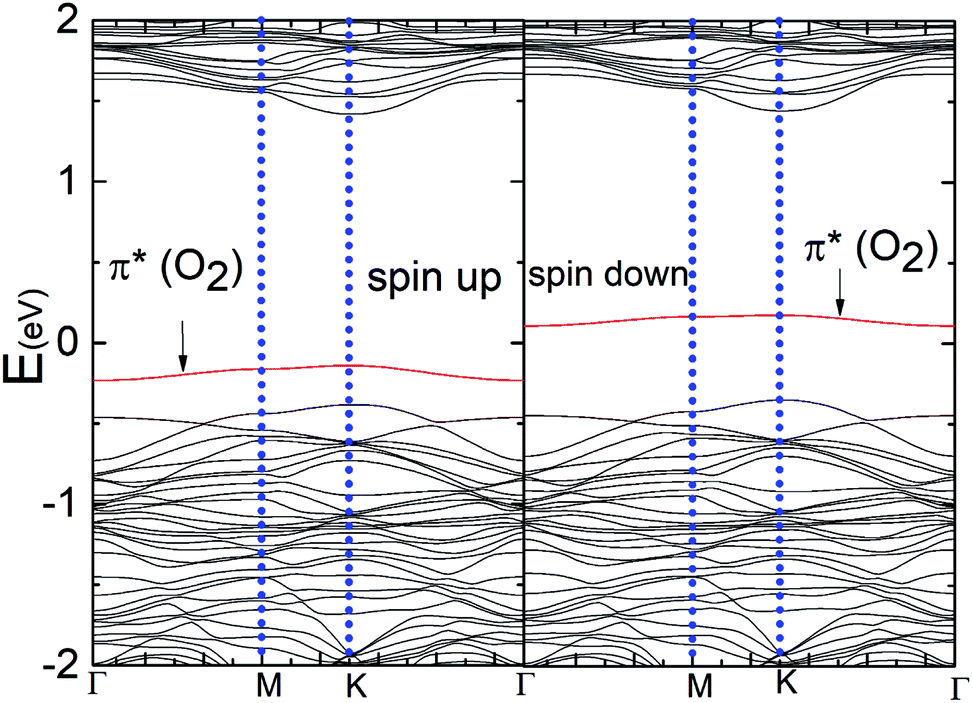 | ||
| Fig. 7 Band structures of the P–MoS2–O2 complex system for the spin-up and spin-down states. | ||
Here, our aim was to investigate the adsorption of NO gas on the pristine and N–MoS2 monolayer. The calculated adsorption energy is −0.26 eV per NO molecule, and the sulfur and N atom distance of 3.03 Å indicates that it can be physisorbed on the pristine MoS2 monolayer. The tabulated adsorption energy agrees well with the reported theoretical calculations.13–30 The length of the N–O bond of 1.17 Å remains the same as that in the isolated NO molecule in the gas phase, which shows good agreement with the reported values.11–28 Here, it is also important to compare the adsorption energy of an NO molecule on a pristine monolayer graphene. The adsorption energies are (−0.03 and −0.12 eV),41 which is significantly smaller than that on the pristine MoS2 monolayer. Fig. 8(a) and (b) display the chemical structure of the N–MoS2–NO complex and Table S2† compares the adsorption energies for different configurations of the NO molecule, which shows that configuration P1 is more stable. Table 1 compares the adsorption energy of the N-doped and pristine MoS2 monolayer, which distinctly indicates that NO adsorption is stronger on the N–MoS2–NO complex system. Also, the adsorption energy of the N–MoS2–NO complex is more negative than the reported values for N and metal atom-doped graphene.41,49 Therefore, the length of the N–O bond decreases to 1.15 Å and the distance between N–MoS2 and the NO molecule of 2.18 Å shows strong binding between the adsorbate and absorbent. Next, we investigated the adsorption of two NO gas molecules on the 2N–MoS2 monolayer and the determined adsorption energy was −0.37 eV per NO molecule. Fig. S8(a) and (b)† represent the chemical structure of the 2N–MoS2–2NO complex. Therefore, the adsorption energy result indicates that 2N–MoS2 monolayer systems are not appropriate for gas sensing and are weakly bonded compared to the N–MoS2–O2 complex.
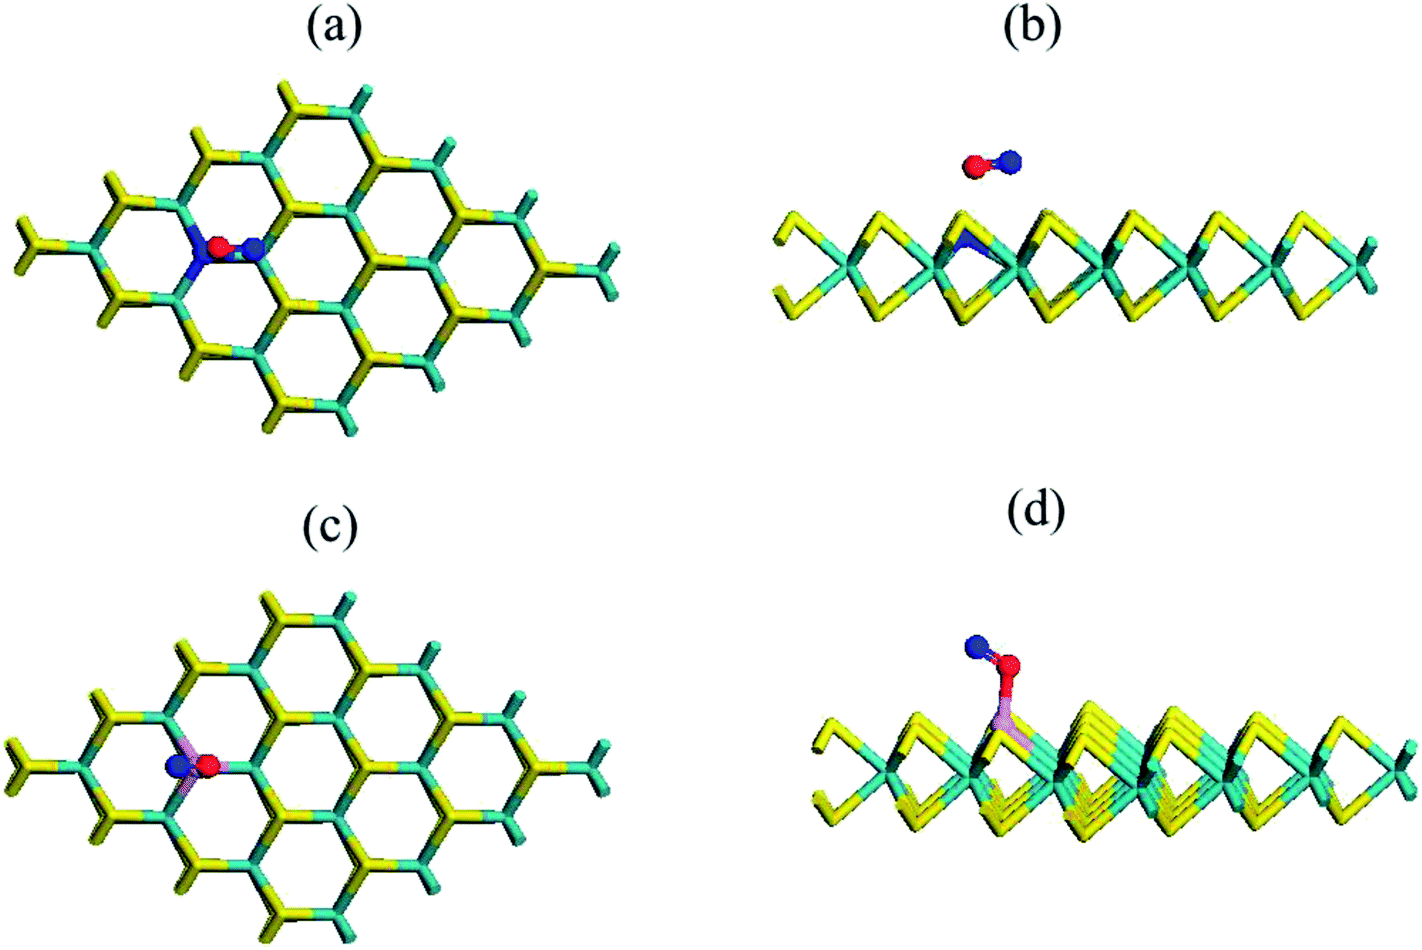 | ||
| Fig. 8 Top (a and c) and side (b and d) views of the chemical structure of the N- and P-substituted MoS2–NO complex, where violet, yellow, green, red and purple sticks represent the Mo, S, N, O and P atoms, respectively. | ||
Fig. 9(a) and (b) display the Δq(z) and contour plots Δρ(x, y, z) for the NO complex in the case of the N–MoS2 monolayer. This figure displays that 0.11e charge transfers from N–MoS2 to the NO molecule, so there is a significant decrease in Δq(z) in the NO moiety, indicating the conversion of this moiety to an NO− ion. It shows that the transferred charge is mainly concentrated in the region adjacent to the NO molecule, where the charge accumulation and depletion regions are represented in red and green, respectively. Fig. 11(a) shows the band structure of the N–MoS2–NO complex system, which indicates that NO adsorption causes the system to become nonmagnetic semiconductor and this is clearly different from the case of O2 molecule adsorption. Our density of states (DOS) analysis presented in Fig. S9† shows that a localized state below the Fermi level appears due to the strong Mo–N bonding and transfer of charge from Mo to the N atom. The two localized π* states of the NO molecule are introduced at 0.35 and 0.87 eV below the conduction band minimum. These two localized π* states are split due to the charge transfer from N–MoS2 monolayer to NO gas molecule.
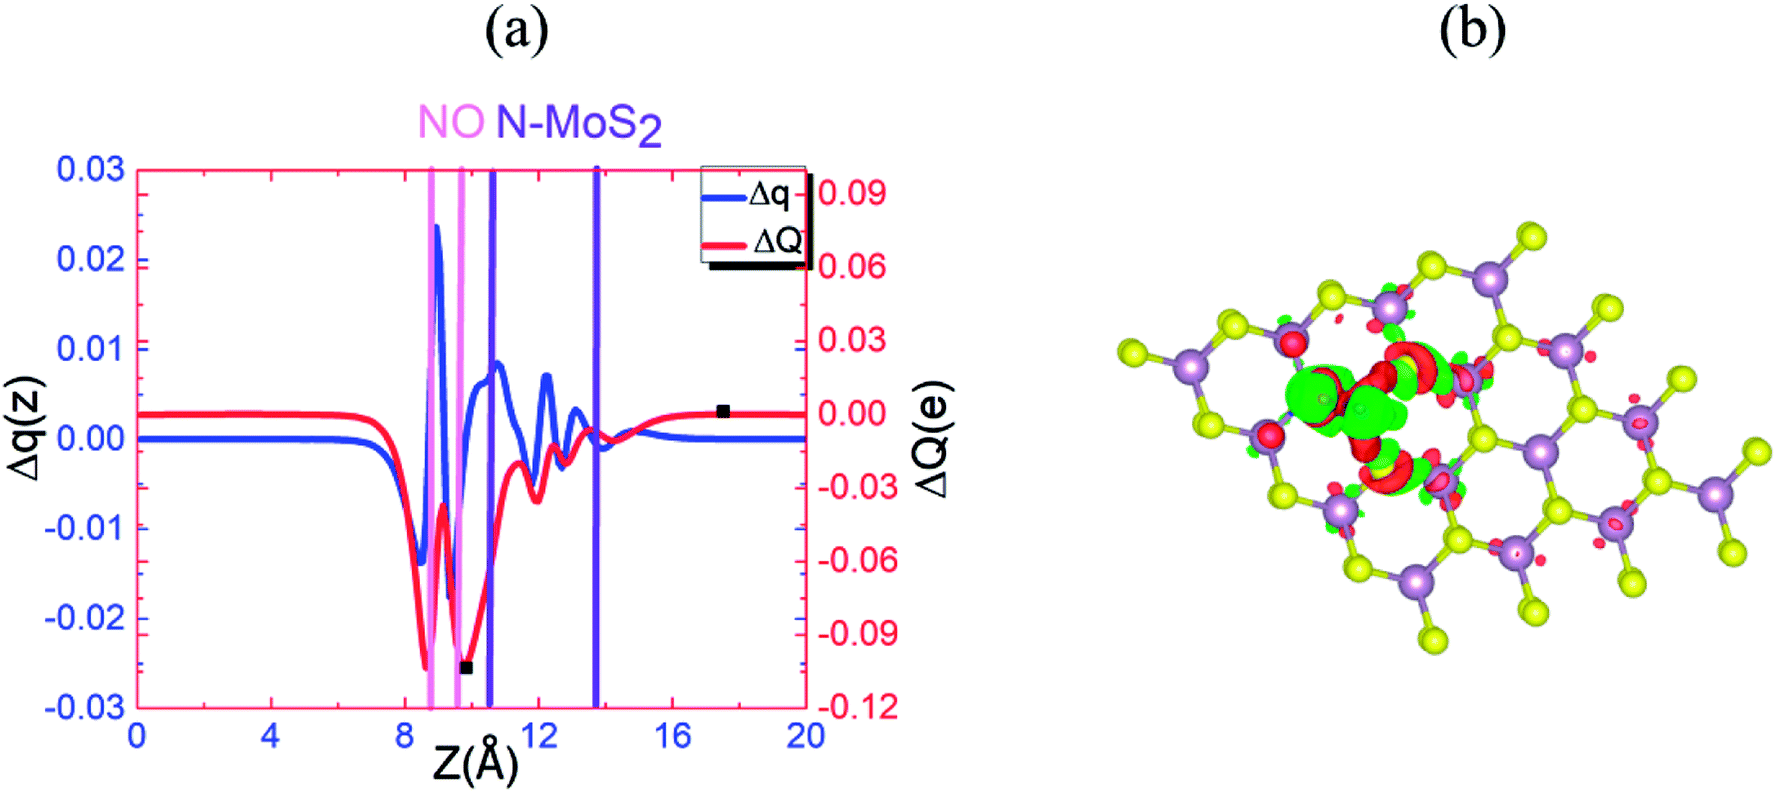 | ||
| Fig. 9 (a) Δq(z) and ΔQ(z) versus z for N–MoS2–NO, where the z values corresponding to Qmin(z) and Qmax(z) are shown by filled squares (■). (b) Differential charge density Δρ(x, y, z) contour plot for N–MoS2–NO, where the charge accumulation and depletion regions are represented by red and green colors, respectively. | ||
Here, we explored the adsorption of an NO molecule on the P–MoS2 monolayer. Table S2† compares the adsorption energies for the different possible configurations of NO molecule, which indicates P1 is the most stable configuration. The configuration in which the P–N bond formed is more stable (0.79 eV) compared to the case of the P–O bond configuration. In this case, the calculated adsorption energy of −1.44 eV per molecule is larger than that of the N–MoS2–NO, N–MoS2–O2, and P–MoS2–O2 complex systems. Furthermore, the binding is also stronger than that of the MoS2–O2 and MoS2–NO complex systems. Moreover, our result of adsorption energy for the NO molecule is significantly larger than the reported value (−0.61 eV)41 for P-doped graphene obtained using PBE-D2 calculations and the adsorption energy (0.91, 0.96 and 1.38 eV)17 of the metal-atom doped MoS2 monolayer. In contrast, the adsorption energy of an NO gas molecule on a metal atom-modified BC3 sheet is also smaller compared to that of the P–MoS2–NO and N–MoS2–NO complex systems.50,51 Fig. 8(c) and (d) present the geometry of the P–MoS2–NO complex, which is in accordance with this result and shows that it can be thought of as a weak P–N bond with a length of 1.93 Å. This bond is formed due to the secondary interaction of the π* states of the NO molecule with the P atom atomic orbital. The N–O bond length of 1.20 Å is not significantly elongated upon adsorption as in case the of the O2 molecule. Fig. S8 (c) and (d)† represent the chemical structure of the 2P–MoS2–2NO complex, where the adsorption energy is −1.38 eV, which is comparable with the previously described complex system.
Fig. 10(a) and (b) present the Δq(z) and contour plots Δρ(x, y, z) for the NO complex in the case of the P–MoS2–NO system. It indicates that slightly more charge is transferred from the P–MoS2 monolayer to NO molecule than the N–MoS2–NO and MoS2–NO complex systems. It also describes a more negative adsorption energy due to the large charge transfer from the adsorbate to the absorbent. This observation clearly indicates a strong p-type effect appears due to the large transfer of an electron and confirms the chemisorption of the NO molecule on the P–MoS2 monolayer. Fig. 11(b) presents the band structure of the P–MoS2–NO complex system. The (PDOS) analysis shown in Fig. S10† indicates that the NO adsorption leaves nonmagnetic semiconductor character in the P- and N-substituted MoS2 monolayer. The localized state below the Fermi level appears due to strong Mo–P bonding and π* states of the NO molecule located at 0.56 eV above the valence band maximum. The Fermi level shifted upward by 0.29 eV in the case of the P–MoS2–NO complex system as a result of 0.14e charge transfer from the P–MoS2 monolayer to an NO gas molecule.
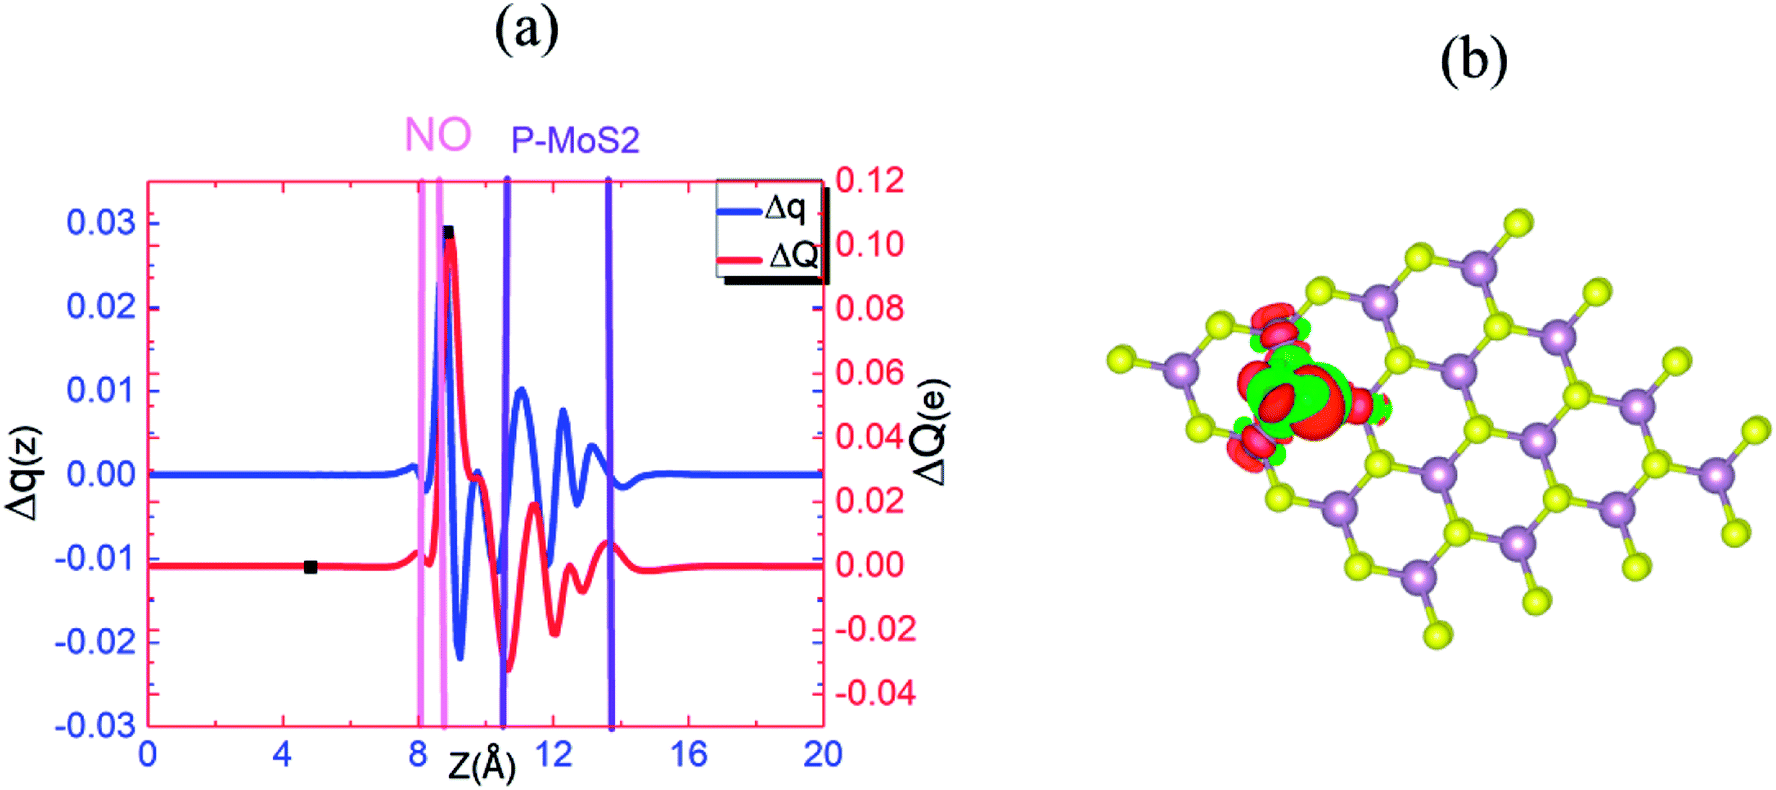 | ||
| Fig. 10 (a) Δq(z) and ΔQ(z) versus z for P–MoS2–NO, where the z values corresponding to Qmin(z) and Qmax(z) are shown by filled squares (■). (b) Differential charge density Δρ(x, y, z) contour plot for P–MoS2–NO, where the charge accumulation and depletion regions are represented by red and green colors, respectively. | ||
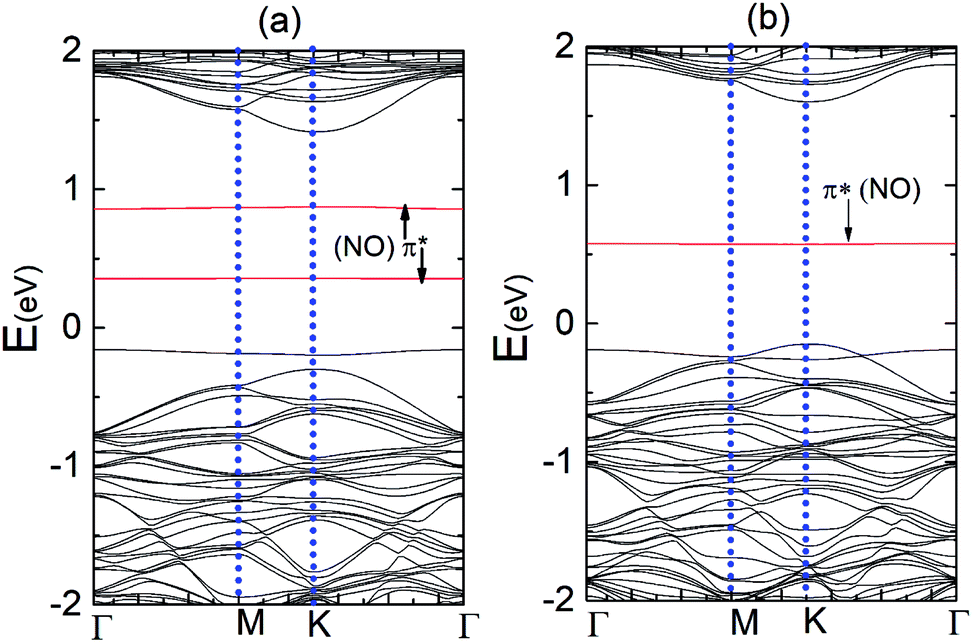 | ||
| Fig. 11 (a) Band structures of the N–MoS2–NO and (b) P–MoS2–NO complex system, respectively. | ||
4. Conclusion
We performed first principle calculation inspection of O2 and NO gas molecules adsorbed on pristine MoS2, N-doped, and P-doped MoS2. The excellent agreement of the adsorption energy with earlier reported data distinctly shows the validity of our PBE-D3 calculation in describing the van der Waals interaction. We found that the adsorption is stronger on N-doped and P-doped MoS2 compared to the case of the pristine MoS2 monolayer. In the case of N-doped MoS2 with O2 or NO molecules, the spins of the two adsorbed molecules couple differently depending upon the type of adsorbed gas molecule. When the former molecule was adsorbed, ferromagnetic coupling was observed, while the spins coupled antiferromagnetically when the latter molecule was absorbed. These findings suggest that the magnetic properties of N–MoS2 may be used for the quantitative sensing of O2 gas. The adsorption of these gases on P–MoS2 is stronger than that on the N–MoS2 monolayer. The adsorption of O2 molecules leaves P–MoS2 a magnetic semiconductor, while the adsorption of NO molecules turns this system into a nonmagnetic semiconductor. Therefore, P-doped and N-doped MoS2 can be used to distinguish between O2 and NO gases using magnetic properties. Therefore, P–MoS2 based gas sensors are predicted to be more sensitive to detect NO and O2 molecules than pristine or N-doped MoS2. Hence, P–MoS2 gas sensors are more suitable for detecting NO molecules due to their stronger adsorption energy and are less suitable for detecting O2 molecules due to their smaller adsorption energy.Conflicts of interest
There are no conflicts of interest.Acknowledgements
This research was supported by the Basic Science Research Program through the National Research Foundation of Korea (NRF), funded by the Ministry of Education (2017R1C1B5076952).References
- A. H. Castro Neto, F. Guinea, N. M. R. Peres, K. S. Novoselov and A. K. Geim, Rev. Mod. Phys., 2009, 81, 109–162 CrossRef CAS.
- G. Eda and M. Chhowalla, Adv. Mater., 2010, 22, 2392–2415 CrossRef CAS PubMed.
- B. Robert, Sens. Rev., 2015, 35, 1–5 CrossRef.
- Y. Liu, X. Dong and P. Chen, Chem. Soc. Rev., 2012, 41, 2283–2307 RSC.
- A. Kuc, N. Zibouche and T. Heine, Phys. Rev. B: Condens. Matter Mater. Phys., 2011, 83, 245213 CrossRef.
- Y. Huang, J. Guo, Y. Kang, Y. Ai and C. M. Li, Nanoscale, 2015, 7, 19358–19376 RSC.
- Q. He, Z. Zeng, Z. Yin, H. Li, S. Wu, X. Huang and H. Zhang, Small, 2012, 8, 2994–2999 CrossRef CAS PubMed.
- H. Li, Z. Yin, Q. He, H. Li, X. Huang, G. Lu, H. Fam Derrick Wen, Y. Tok Alfred Iing, Q. Zhang and H. Zhang, Small, 2011, 8, 63–67 CrossRef PubMed.
- O. Leenaerts, B. Partoens and F. M. Peeters, Phys. Rev. B: Condens. Matter Mater. Phys., 2009, 79, 235440 CrossRef.
- W. T. Cong, Z. Tang, X. G. Zhao and J. H. Chu, Sci. Rep., 2015, 5, 9361 CrossRef CAS PubMed.
- D. Ma, Q. Wang, T. Li, C. He, B. Ma, Y. Tang, Z. Lu and Z. Yang, J. Mater. Chem. C, 2016, 4, 7093–7101 RSC.
- D. Ma, W. Ju, T. Li, G. Yang, C. He, B. Ma, Y. Tang, Z. Lu and Z. Yang, Appl. Surf. Sci., 2016, 371, 180–188 CrossRef CAS.
- Q. Yue, Z. Shao, S. Chang and J. Li, Nanoscale Res. Lett., 2013, 8, 425 CrossRef PubMed.
- J. Dai and J. Yuan, Phys. Rev. B: Condens. Matter Mater. Phys., 2010, 81, 165414 CrossRef.
- Z. Miao, L. Yun-Hao, C. Yong-Qing, Z. Chun and F. Yuan-Ping, Nanotechnology, 2011, 22, 385502 CrossRef PubMed.
- D. Ma, Y. Tang, G. Yang, J. Zeng, C. He and Z. Lu, Appl. Surf. Sci., 2015, 328, 71–77 CrossRef CAS.
- D. Ma, W. Ju, T. Li, X. Zhang, C. He, B. Ma, Z. Lu and Z. Yang, Appl. Surf. Sci., 2016, 383, 98–105 CrossRef CAS.
- B. B. Xiao, P. Zhang, L. P. Han and Z. Wen, Appl. Surf. Sci., 2015, 354, 221–228 CrossRef CAS.
- J. He, K. Wu, R. Sa, Q. Li and Y. Wei, Appl. Phys. Lett., 2010, 96, 082504 CrossRef.
- H. Zheng, B. Yang, D. Wang, R. Han, X. Du and Y. Yan, Appl. Phys. Lett., 2014, 104, 132403 CrossRef.
- W. Ju, T. Li, X. Su, H. Li, X. Li and D. Ma, Phys. Chem. Chem. Phys., 2017, 19, 20735–20748 RSC.
- L.-p. Feng, J. Su and Z.-t. Liu, J. Alloys Compd., 2014, 613, 122–127 CrossRef CAS.
- I. S. Kwon, I. H. Kwak, H. G. Abbas, Y. Lee, G. Jung, S. J. Yoo, J.-G. Kim, J. Park and H. S. Kang, Nanoscale, 2018, 10, 11349–11356 RSC.
- I. H. Kwak, I. S. Kwon, H. G. Abbas, G. Jung, Y. Lee, J. Park and H. S. Kang, J. Mater. Chem. A, 2018, 6, 5613–5617 RSC.
- H.-P. Komsa, J. Kotakoski, S. Kurasch, O. Lehtinen, U. Kaiser and A. V. Krasheninnikov, Phys. Rev. Lett., 2012, 109, 035503 CrossRef PubMed.
- W. Zhou, X. Zou, S. Najmaei, Z. Liu, Y. Shi, J. Kong, J. Lou, P. M. Ajayan, B. I. Yakobson and J.-C. Idrobo, Nano Lett., 2013, 13, 2615–2622 CrossRef CAS PubMed.
- H. Li, M. Huang and G. Cao, Phys. Chem. Chem. Phys., 2016, 18, 15110–15117 RSC.
- C. González, B. Biel and Y. J. Dappe, Phys. Chem. Chem. Phys., 2017, 19, 9485–9499 RSC.
- S.-Y. Cho, S. J. Kim, Y. Lee, J.-S. Kim, W.-B. Jung, H.-W. Yoo, J. Kim and H.-T. Jung, ACS Nano, 2015, 9, 9314–9321 CrossRef PubMed.
- S. Zhao, J. Xue and W. Kang, Chem. Phys. Lett., 2014, 595–596, 35–42 CrossRef CAS.
- H. Qiu, L. Pan, Z. Yao, J. Li, Y. Shi and X. Wang, Appl. Phys. Lett., 2012, 100, 123104 CrossRef.
- L. Qiuhong, W. Xia, W. Zhenjun, H. Jia, L. Dongdong, W. Qiang and W. Shuangyin, Nanotechnology, 2016, 27, 175402 CrossRef PubMed.
- H. Huang, X. Feng, C. Du and W. Song, High-quality phosphorus-doped MoS2 ultrathin nanosheets with amenable ORR catalytic activity, Chem. Commun., 2015, 51(37), 7903–7906 RSC.
- G. Kresse and J. Hafner, Phys. Rev. B: Condens. Matter Mater. Phys., 1993, 47, 558–561 CrossRef CAS.
- G. Kresse and J. Furthmüller, Phys. Rev. B: Condens. Matter Mater. Phys., 1996, 54, 11169–11186 CrossRef CAS.
- G. Kresse and D. Joubert, Phys. Rev. B: Condens. Matter Mater. Phys., 1999, 59, 1758–1775 CrossRef CAS.
- S. Grimme, J. Comput. Chem., 2006, 27, 1787–1799 CrossRef CAS PubMed.
- J. N. Dimple and S. Abir De, J. Phys.: Condens. Matter, 2017, 29, 225501 CrossRef PubMed.
- A. Brahim, P. Ruth and M. Shin, Nanotechnology, 2016, 27, 185701 CrossRef PubMed.
- H. Okamoto, R. Schilling, H. Schütz, V. Sudhir, D. J. Wilson, H. Yamaguchi and T. J. Kippenberg, Appl. Phys. Lett., 2016, 108, 153105 CrossRef.
- A. Pramanik and H. S. Kang, J. Phys. Chem. C, 2011, 115, 10971–10978 CrossRef CAS.
- H. Zhang, Y. Tian, J. Zhao, Q. Cai and Z. Chen, Electrochim. Acta, 2017, 225, 543–550 CrossRef CAS.
- S. Zhao, J. Xue and W. Kang, Chem. Phys. Lett., 2014, 595–596, 35–42 CrossRef CAS.
- C. Liu, H. Dong, Y. Ji, T. Hou and Y. Li, Sci. Rep., 2018, 8, 13292 CrossRef PubMed.
- X. Zhang, S. Shi, T. Gu, L. Li and S. Yu, Phys. Chem. Chem. Phys., 2018, 20, 18184–18191 RSC.
- Y. Tang, H. Chai, H. Zhang, W. Chen, W. Zhang and X. Dai, Phys. Chem. Chem. Phys., 2018, 20, 14040–14052 RSC.
- H. Zhang, Y. Tang, Y. Ma, D. Ma, M. Zhao and X. Dai, Appl. Surf. Sci., 2018, 427, 376–386 CrossRef CAS.
- Y. Tang, W. Chen, Z. Shen, S. Chang, M. Zhao and X. Dai, Carbon, 2017, 111, 448–458 CrossRef CAS.
- Y. Tang, Z. Liu, Z. Shen, W. Chen, D. Ma and X. Dai, Sens. Actuators, B, 2017, 238, 182–195 CrossRef CAS.
- Y. Tang, X. Cui, W. Chen, D. Zhu, H. Chai and X.-Q. Dai, A theoretical study on metal atom-modified BC3 sheets for effects of gas molecule adsorptions, Appl. Phys. A, 2018, 6, 124–434 Search PubMed.
- Y. Tang, M. Zhang, W. Chen, X. Cui, Y. Li and X. Dai, J. Phys. Chem. Solids, 2018, 121, 247–255 CrossRef CAS.
Footnote |
| † Electronic supplementary information (ESI) available. See DOI: 10.1039/c8ra07638c |
| This journal is © The Royal Society of Chemistry 2018 |