 Open Access Article
Visible colorimetric fluoride and hydroxide sensing by asymmetric tris-urea receptors: combined experimental and theoretical studies†
Ruyu Wang,
Xi Shu,
Yu Fan,
Shoujian Li,
Yongdong Jin and
Chao Huang *
*
College of Chemistry, Sichuan University, No. 29 Wangjiang Road, Chengdu 610064, Sichuan, PR China. E-mail: chuang@scu.edu.cn
First published on 26th November 2018
Abstract
A series of asymmetric tris-urea receptors with electron withdrawing group (EWG) or electron donating group (EDG), L1–L4, were synthesized and characterized by high resolution mass spectroscopy (HRMS), nuclear magnetic resonance spectroscopy (NMR) and single-crystal X-ray diffraction (XRD) techniques. Receptors with EWG substituent showed different visible colorimetric response to fluoride and hydroxide anions. Binding studies toward various monovalent anions were performed by UV-Vis and NMR titration experiments. The experimental results revealed that these tris-urea receptors underwent stepwise deprotonation of the three N–H protons in the presence of varying excess of fluoride and hydroxide anions. This phenomenon was signalled by the development of vivid colours. These findings were also supported by density functional theory (DFT) and time-dependent DFT (TDDFT) theoretical calculations. DFT studies proved that the deprotonation of receptors with EWG substituent was energetically favourable in comparison with the receptor containing EDG substituent. TDDFT calculations for molecular orbital distribution, oscillator strength, and the electron transition process between the ground state and excited state of receptors and their corresponding deprotonated receptors were performed to elucidate the different absorption properties.
Introduction
Anions play important roles in many chemical, catalysis, environmental science, and biological systems.1–3 For example, fluoride is indispensable in biology, environmental, industrial research. Fluoride is a common composition in bone,4 hypnotics, anesthetics, psychiatric medicines,5 poisons, and nerve gas chemical weapons. Generally, fluoride is also a pollutant in underground water.6 Much work so far has focused on designing and developing sensory molecules for recognition and detection of anionic compounds.7,8Nowadays, an interesting approach in the use of urea based receptors as a hydrogen bond donor in the recognition of anions have attracted much attention.9–13 In particular, considerable research efforts have been devoted to the designation of receptors containing one ureido subunit, which are good at selectively recognizing fluoride.14–16 In particular, two equivalents of F− ions could induce the solution colour of 1,3-bis(4-nitrophenyl)urea change from colourless to orange-red.14 In addition, a benzophenone group and a nitrophenyl group substituted urea can detect F− ion with naked eye and the colour changes from colourless to yellow/orange.17 Moreover, receptors containing two ureido subunits have also been reported and represented good selectivity for recognition toward fluoride. For instance, Nam et al. found that the naphthalene derived bis-urea displayed an individual colour change only when treated with fluoride ion.18,19 Das et al. reported colorimetric receptors for selectively sensing fluoride ion. The colour of these receptors, including two urea subunits linked to an anthraquinone moiety, changed from pale yellow to pale red upon addition of F−.20 Kondo et al. presented a series of bis-urea based on 2,2-binaphthalene containing various alkyl and aryl substituents represent a strong anion binding ability, particularly, the receptor with n-butyl substituent showed a stronger affinity with fluoride.21 In 2012, Chauhan et al. investigated the colorimetric responses of four (thio)ureas based on 2,2-diaminoazo-benzene, these receptors exhibited significant naked-eye colorimetric change on the addition of F−.22 In addition, tris(2-aminoethyl) amine (tren) based tripodal urea or thiourea receptors for recognition and separation of anions has been intensively investigated.23–26
For instance, early in 2005, Custelcean et al. reported a coordination polymer host functionalized with tren-based tris-urea, which provided a coordinatively saturated environment for sulfate dianion through ureido hydrogen bonds.27 Two years later, Ganguly and Das et al. pointed out a tren-based tris-urea receptor showed preferential binding affinity with phosphate or sulfate anion.28 In 2009, Ghosh et al. studied the anion-binding properties of a pentafluorophenyl substituted tren-based tris-urea, which not only displayed a particular selectivity toward phosphate anion but also showed a strong affinity with fluoride, encapsulating one F− ion into the C3v-symmetric cleft of the receptor.29 Following this work, they found that this C3v tripodal urea had special binding ability with the toxic and biologically relevant HAsO42− anion.30 More interestingly, they discovered the tren-based 3-cyanophenyl-substituted tripodal urea receptor was capable of fixing atmospheric carbon dioxide, which was transformed into carbonate and further encapsulated by this receptor forming a capsular.31 In 2009, Custelcean et al. reported crystallization of self-assembled capsules functionalized with urea hydrogen-bonding groups as a means for selective separation of sulfate anion by a tren-based tripodal tris-urea.32 In 2011, Hossain et al. identified a seven coordinate complex crystal structure of a hydrogen sulfate anion surrounded by a p-cyanophenyl derived tren urea receptor.33 Subsequently, they found the same receptor was shown to bind a fluoride ion strongly compared to other halide anions without any visible colour changes of the solution.34 In 2012, Gale et al. reported three indolyl substituted tren ureido receptors, which were able to bind sulphate in 10% aqueous DMSO-d6 solution with very high stability constant.35 In the same year, Das et al. investigated a tren-based tris-urea receptor with m-nitrophenyl terminal as a potential molecular system, which not only can efficiently capture and fix CO2 from atmosphere as stable crystals in air of a carbonate anion encapsulated molecular capsule and can encapsulate a sulfate anion (SO42−) within a dimeric capsular with self-assemble of the receptor.36 Next year, they systematically studied all of the isomers of nitrophenyl functionalized tripodal tris-urea, in particular, oxoanions with different size could be encapsulated into a dimeric capsular by the para-isomer.37 In 2016, Wu et al. reported a tetraphenylethene (TPE) derived tripodal tris-urea receptor, which demonstrated a notable emission enhancement in the presence of orthophosphate anion (PO43−).38 Freshly, Hossain et al. described a sulfate and fluoride differential receptor, which is based on a tren scaffold with tris(thioureas).39 Overall, the tren-based C3v-symmetric tripodal tris-urea receptors exhibited remarkably anion binding ability because of the tripodal conformation made it possible to form a spheroidal cavities to encapsulate anions of perfect fitting, however, asymmetric tris-urea receptors have been rarely studied so far.
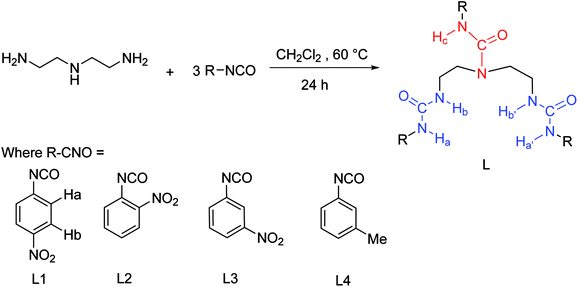
Very recently, we have reported a symmetry o-phenylendiamine bis-urea with considerable binding strength towards Cl− or Br−.40 Here, to enrich the library of tris-urea receptors, we would like to report four novel asymmetric tris-urea receptors L1–L4 with the capability of discriminating both fluoride and hydroxide anions (Scheme 1). Compared with mono urea and bis-urea receptors, these receptors with two flexible symmetric urea units (N–Ha and N–Hb) and one asymmetric urea unit (N–Hc) contain more H-bond binding sites toward anions. Anion-binding properties for these receptors were examined by naked eye detection, UV-Vis spectroscopy, and NMR experiments. It was found that the receptors L1–L3 represented a vivid colour change upon the addition of fluoride and hydroxide anions. Moreover, we performed density functional theory (DFT) and time-dependent DFT (TDDFT) theoretical calculations to elucidate the binding mode of the receptors in DMSO solution and to analyse the excitation state of receptors and their corresponding anions, respectively. Both experimental and theoretical studies indicated that the stepwise deprotonation of the urea N–H gave rise to the development of discernible colours.
Experimental
Materials and general methods
Unless otherwise stated, all chemical reagents were obtained from commercial suppliers and used without further purification. All of the solvents used were purified and dried by standard methods prior to use.The 1H NMR (400 MHz) and 13C NMR (100 MHz) spectra were recorded on a Bruker AV III 400 MHz spectrometer with DMSO-d6 as the solvent and tetramethylsilane (TMS) as an internal reference. UV-Vis absorption spectra were determined on a PERSEE TU-1810 spectrophotometer. FT-IR spectra (400–4000 cm−1) were recorded on a Nicolet 670 spectrometer with a (S/N) of 40![[thin space (1/6-em)]](https://www.rsc.org/images/entities/char_2009.gif) 000
000![[thin space (1/6-em)]](https://www.rsc.org/images/entities/char_2009.gif) :
:![[thin space (1/6-em)]](https://www.rsc.org/images/entities/char_2009.gif) 1 in the solid state (KBr pellets). Single crystal X-ray diffraction (XRD) data were harvested on an Agilent Technologies Gemini single-crystal diffractometer. High resolution mass spectra (HRMS) were carried out on a Shimadzu LCMS-IT-TOF (ESI) spectrometer.
1 in the solid state (KBr pellets). Single crystal X-ray diffraction (XRD) data were harvested on an Agilent Technologies Gemini single-crystal diffractometer. High resolution mass spectra (HRMS) were carried out on a Shimadzu LCMS-IT-TOF (ESI) spectrometer.
Synthesis
![[thin space (1/6-em)]](https://www.rsc.org/images/entities/char_2009.gif) :
:![[thin space (1/6-em)]](https://www.rsc.org/images/entities/char_2009.gif) 1, 3 × 70 mL), and diethyl ether (3 × 70 mL), separately. The solid was dried in vacuo overnight to afford 1.52 g (85.6%) of compound L1 as a light brown powder. Mp: 239.1–240.6 °C. FT-IR (KBr, cm−1): 3338.9, 1679.2, 1605.8, 1558.5, 1500.7, 1329.8. 1H NMR (400 MHz, DMSO-d6): δ = 9.42 (s, 2H), 9.23 (s, 1H), 8.10 (t, J = 9.9 Hz, 6H), 7.76 (d, J = 8.9 Hz, 2H), 7.59 (d, J = 8.9 Hz, 4H), 6.60 (t, J = 5.8 Hz, 2H), 3.51 (t, J = 6.5 Hz, 4H) ppm. 13C NMR (100 MHz, DMSO-d6): δ = 154.99, 154.67, 147.34, 146.94, 140.72, 140.48, 125.09, 124.70, 118.13, 116.95, 46.63, 40.15–38.89, 38.19 ppm. HRMS (ESI+): calcd for C25H25N9O9Na [M + Na]+ 618.1673; found 618.1678.
1, 3 × 70 mL), and diethyl ether (3 × 70 mL), separately. The solid was dried in vacuo overnight to afford 1.52 g (85.6%) of compound L1 as a light brown powder. Mp: 239.1–240.6 °C. FT-IR (KBr, cm−1): 3338.9, 1679.2, 1605.8, 1558.5, 1500.7, 1329.8. 1H NMR (400 MHz, DMSO-d6): δ = 9.42 (s, 2H), 9.23 (s, 1H), 8.10 (t, J = 9.9 Hz, 6H), 7.76 (d, J = 8.9 Hz, 2H), 7.59 (d, J = 8.9 Hz, 4H), 6.60 (t, J = 5.8 Hz, 2H), 3.51 (t, J = 6.5 Hz, 4H) ppm. 13C NMR (100 MHz, DMSO-d6): δ = 154.99, 154.67, 147.34, 146.94, 140.72, 140.48, 125.09, 124.70, 118.13, 116.95, 46.63, 40.15–38.89, 38.19 ppm. HRMS (ESI+): calcd for C25H25N9O9Na [M + Na]+ 618.1673; found 618.1678.UV-Vis absorption spectra
A stock solution of receptors L1–L4 ([L] = 5.0 × 10⁻⁵ M) were prepared with DMSO solution and used in the preparation of titration solution by appropriate dilution. The solution of the guest anions in the order of 10−2 (M) was also prepared in DMSO solution. Titration of receptors L1–L4 was carried out by the addition of a required amount of standard solution of the anion. All anions (F−, Cl−, Br−, I−, H2PO4−, HSO4−, CH3COO−, NO3−, OH− and ClO4−) were used as their tetra-n-butylammonium (TBA) salts except [NH4][ReO4].NMR titration
1H NMR titration was conducted in DMSO-d6 solution and the changes in the chemical shifts were examined by recording the spectrum at room temperature. The initial concentration of receptors was 5.0 × 10⁻³ M. Stock solutions of the anion (0.5 M, TBA salt or [NH4][ReO4]) were prepared by dissolving the salt in DMSO-d6 solution. The requisite number of NMR samples was prepared by adding increasing amounts of the anion solution (0–50 μL) to 500 μL of the receptor solution.X-ray crystallography
Crystals suitable for X-ray diffraction (XRD) were obtained for L1–L3. Single crystal XRD data for L1–L3 were collected on an Agilent Gemini, Dual, Cu at zero, EosS2 diffractometer equipping with a graphite-monochromated Cu Kα (λ = 0.154184 nm) radiation. The intensity data collected by the ω scan technique. Within Olex2,41 the structure was solved with the ShelXT42 structure solution program using Direct Methods and refined with the ShelXL43 refinement package by least-squares minimization. X-ray crystallographic information data (CIFs) is available with the CCDC deposition with numbers 1574166 (L1·0.5 (Et2O)), 1574164 (L2) and 1574165 (L3·DMSO) for this paper.![[1 with combining macron]](https://www.rsc.org/images/entities/char_0031_0304.gif) (no. 2), a = 7.1240(4) Å, b = 12.8626(5) Å, c = 16.0430(7) Å, α = 95.365(4)°, β = 90.472(4)°, γ = 101.742(4)°, V = 1432.45(11) Å3, Z = 2, T = 296.31(10) K, μ(Cu Kα) = 0.962 mm−1, Dcalc = 1.462 g cm−3, 15
(no. 2), a = 7.1240(4) Å, b = 12.8626(5) Å, c = 16.0430(7) Å, α = 95.365(4)°, β = 90.472(4)°, γ = 101.742(4)°, V = 1432.45(11) Å3, Z = 2, T = 296.31(10) K, μ(Cu Kα) = 0.962 mm−1, Dcalc = 1.462 g cm−3, 15![[thin space (1/6-em)]](https://www.rsc.org/images/entities/char_2009.gif) 706 reflections measured (9.384° ≤ 2Θ ≤ 145.308°), 5559 unique (Rint = 0.0283, Rsigma = 0.0245) which were used in all calculations. The final R1 was 0.0751 (I > 2σ(I)) and wR2 was 0.2378 (all data).
706 reflections measured (9.384° ≤ 2Θ ≤ 145.308°), 5559 unique (Rint = 0.0283, Rsigma = 0.0245) which were used in all calculations. The final R1 was 0.0751 (I > 2σ(I)) and wR2 was 0.2378 (all data).![[1 with combining macron]](https://www.rsc.org/images/entities/char_0031_0304.gif) (no. 2), a = 5.8865(2) Å, b = 14.2293(7) Å, c = 16.8469(8) Å, α = 75.358(4)°, β = 87.692(3)°, γ = 82.114(4)°, V = 1352.35(11) Å3, Z = 2, T = 296.4(7) K, μ(Cu Kα) = 0.970 mm−1, Dcalc = 1.463 g cm−3, 14
(no. 2), a = 5.8865(2) Å, b = 14.2293(7) Å, c = 16.8469(8) Å, α = 75.358(4)°, β = 87.692(3)°, γ = 82.114(4)°, V = 1352.35(11) Å3, Z = 2, T = 296.4(7) K, μ(Cu Kα) = 0.970 mm−1, Dcalc = 1.463 g cm−3, 14![[thin space (1/6-em)]](https://www.rsc.org/images/entities/char_2009.gif) 966 reflections measured (9.434° ≤ 2Θ ≤ 145.344°), 5247 unique (Rint = 0.0391, Rsigma = 0.0303) which were used in all calculations. The final R1 was 0.0561 (I > 2σ(I)) and wR2 was 0.1672 (all data).
966 reflections measured (9.434° ≤ 2Θ ≤ 145.344°), 5247 unique (Rint = 0.0391, Rsigma = 0.0303) which were used in all calculations. The final R1 was 0.0561 (I > 2σ(I)) and wR2 was 0.1672 (all data).![[1 with combining macron]](https://www.rsc.org/images/entities/char_0031_0304.gif) (no. 2), a = 10.7261(5) Å, b = 12.0465(6) Å, c = 14.5821(5) Å, α = 83.686(3)°, β = 74.878(4)°, γ = 79.380(4)°, V = 1783.98(14) Å3, Z = 2, T = 296.31(10) K, μ(Cu Kα) = 1.347 mm−1, Dcalc = 1.254 g cm−3, 19
(no. 2), a = 10.7261(5) Å, b = 12.0465(6) Å, c = 14.5821(5) Å, α = 83.686(3)°, β = 74.878(4)°, γ = 79.380(4)°, V = 1783.98(14) Å3, Z = 2, T = 296.31(10) K, μ(Cu Kα) = 1.347 mm−1, Dcalc = 1.254 g cm−3, 19![[thin space (1/6-em)]](https://www.rsc.org/images/entities/char_2009.gif) 863 reflections measured (8.654° ≤ 2Θ ≤ 145.346°), 6937 unique (Rint = 0.0297, Rsigma = 0.0230) which were used in all calculations. The final R1 was 0.0644 (I > 2σ(I)) and wR2 was 0.2026 (all data).
863 reflections measured (8.654° ≤ 2Θ ≤ 145.346°), 6937 unique (Rint = 0.0297, Rsigma = 0.0230) which were used in all calculations. The final R1 was 0.0644 (I > 2σ(I)) and wR2 was 0.2026 (all data).Theoretical studies
All of the calculations were performed using the Gaussian 09 program.44 The geometries were optimized by means of the M06-2X functional45 with the basis set employing 6-311G(d,p)46 for all atoms using the polarized continuum model (PCM) in dimethylsulfoxide (DMSO) media.47,48 Frequency computations were performed at the same theoretical levels to ensure that the structures found correspond to a local minimum on the potential energy surface. The single point energy in DMSO solution was calculated according to the M06-2X/6-311+G(d,p)49,50 level for the geometry optimized above. In addition, the excitation energy, oscillator strength and main contributions of 10 lowest excited states were investigated using time-dependent DFT (TDDFT) calculations with the PBE0![[thin space (1/6-em)]](https://www.rsc.org/images/entities/char_2009.gif) 51 function in combination with the def2-TZVP49 basis set based on the optimized geometry. All TDDFT calculations were carried out under the PCM in DMSO solvent. Charge transfer, electron (EDD) and hole (HDD) density distribution maps have been carried out with Multiwfn program.52 The visualization of the molecular orbitals, EDD and HDD maps is performed by using the Visual Molecular Dynamics (VMD) program.53
51 function in combination with the def2-TZVP49 basis set based on the optimized geometry. All TDDFT calculations were carried out under the PCM in DMSO solvent. Charge transfer, electron (EDD) and hole (HDD) density distribution maps have been carried out with Multiwfn program.52 The visualization of the molecular orbitals, EDD and HDD maps is performed by using the Visual Molecular Dynamics (VMD) program.53
Results and discussion
The tris-urea receptors L1–L4 were prepared by the facile condensation reaction of diethylenetriamine with the corresponding isocyanate (Scheme 1). These receptors were further characterized by 1H NMR, 13C NMR, FT-IR and HRMS spectroscopy techniques and detailed characterization data were provided in the ESI.† The anion sensing property of the receptors was assessed using naked eye detection, UV-Vis, 1H NMR experiments and theoretical studies.Naked-eye detection experiment
The sensing of receptors L1–L4 for simple anions such as F−, Cl−, Br−, I−, and more complicated anions like H2PO4−, HSO4−, CH3COO−, NO3−, ClO4−, OH− and ReO4− (TBA salts or NH4ReO4) in DMSO solution were detected visually. Addition of 10 equivalents of TBAF into DMSO solution of receptors L1–L3 caused drastic vivid colour changes, specifically, from colourless to orange for L1, from yellow to red for L2, and from pale yellow to light orange for L3, which were clearly visible to the naked-eye as depicted in Fig. 1. On the other hand, in the case of OH−, the solution colour changed from colourless to orange for L1, from yellow to dark purple for L2, and from pale yellow to purple for L3, as showed in Fig. 1. In contrast, receptor L4 with an EDG substituent on the meta position of a phenyl ring represented no colour changes upon addition of the same amount of TBAF and TBAOH, as depicted in Fig. 1. It should be noted that F− and OH− ions can readily be discriminated with the naked eye by these asymmetric tris-urea receptors with EWG. While such phenomenon is not found in tren-based tris-urea receptors reported previously. Although some tris-urea receptors displayed significant strong binding affinity toward fluoride anion in solution, they provided non visible colour response to F− or OH− ions, such as quinolinyl-functionalized tripodal tris-urea receptor,54 4-pyridyl-functionalized tris-urea,55 pentafluorophenyl-substituted tris-urea,29 nitrophenyl functionalized tris-urea36,37 and p-cyanophenyl substituted tris-urea.34 In addition, even though a series of mesitylene functionalized tris-urea receptors displayed a vivid colorimetric response to F− and OH− anions, from colourless to reddish yellow, these tripodal urea receptors could not distinguish OH− and F− by naked-eye in their experimental system.56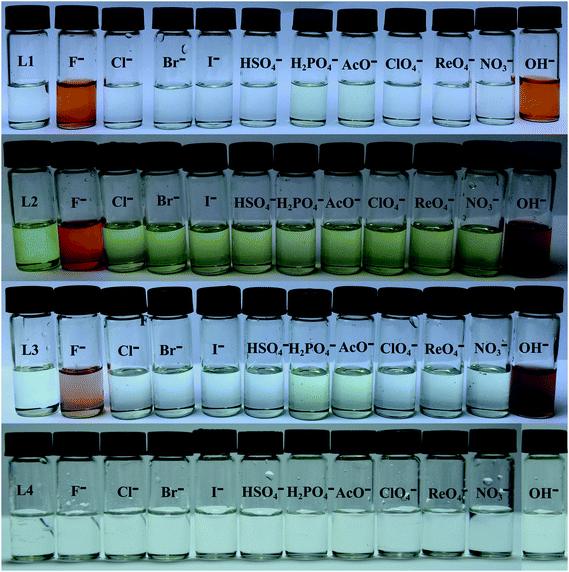 | ||
| Fig. 1 Naked-eye visible color changes observed for receptors L1–L4 in DMSO solution ([L] = 1.0 × 10⁻³ M) on the addition of 10 equivalents of various anions. | ||
On the other hand, with respect to other anions (Cl−, Br−, I−, H2PO4−, HSO4−, CH3COO−, NO3−, ClO4− and ReO4−), all of the receptors L1–L4 gave no significant changes in colour. Since the colours changed with the addition of 10 equivalents of F– or OH– to a solution of receptor L1–L3 (1 mM), we further investigated whether if the receptors can detect OH− and F− ions at a lower concentration with naked-eye vision. As showed in Fig. S1–S3,† remarkably, receptor L1 can detect F− ion at a low concentration of 100 μM with clearly colour development from colourless to light yellow. However, it should be mentioned that receptors L2 and L3 fail to sense fluoride in the same concentration, which was depicted in Fig. S2 and S3.† By contrast, hydroxide anion cannot be sensed by receptors L1–L3 at the same concentration of 100 uM, as showed in Fig. S4–S6.†
UV-Vis spectral studies
In order to understand the selective nature of the receptors towards fluoride and hydroxide anions, the sensing ability of receptors L1–L4 toward various anions (Cl−, Br−, I−, H2PO4−, HSO4−, CH3COO−, NO3−, ClO4−, OH− and ReO4−) was further investigated by UV-Vis study. The UV-Vis experiments were performed in DMSO solution. The receptor solution (5 × 10⁻⁵ M) was treated with 10 equivalents of each anion. As showed in Fig. S7–S10,† no bathochromic shift of other anions was observed for L1–L4, which is in line with the naked-eye detection. However, a new peak appears in an infrared region in the course of titration of fluoride anion for L1–L3 except L4, as depicted in Fig. 2 and 3 and Fig. S11 and S12,† which are also correlated with noticeable colour detection that L4 represents no discernible colour changes in the presence of excess fluoride anions. Specifically, the absorption spectra of L1 in DMSO solution (1 × 10⁻⁵ M) displayed an intense absorption band at about 350 nm (Fig. 2), attributed to the π–π* transition of the p-nitrophenyl chromophore. Upon addition of incremental amounts of F− ions, the band at 350 nm progressively decreased, while a new peak at about 484 nm appeared and the intensity increased gradually (Fig. 2). This phenomenon might be ascribed to the F−-triggered urea complexation which extended the conjugated structure of the whole receptor.14,15 Firstly, on addition of small amounts of F− produced a marked red shift in the absorption of 350 nm to 366 nm owing to the formation of genuine H-bond complex. We suggested that a first equilibrium is established (see eqn (1)), inducing the formation of the hydrogen bond complex [L–H⋯F]−, to which the band at 366 nm corresponds.| [L–H] + F− ⇆ [L–H⋯F]− | (1) |
| [L–H⋯F] + F− ⇆ L− + [HF2]− | (2) |
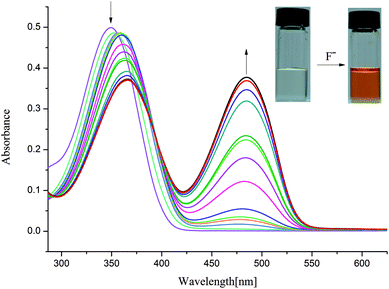 | ||
| Fig. 2 Changes in UV-Vis spectra for L1 with addition of TBAF in DMSO solution ([L1] = 1.0 × 10⁻⁵ M). | ||
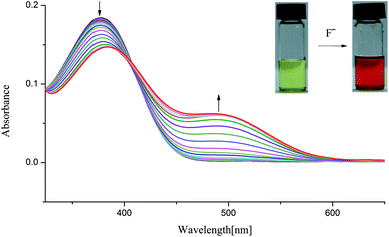 | ||
| Fig. 3 Changes in UV-Vis spectra for L2 with addition of TBAF in DMSO solution ([L2] = 1.0 × 10⁻⁵ M). | ||
Then, on addition of more F− ions, a new band develops at 484 nm, associate with the deprotonation of a proton from [L–H⋯F]− producing an anionic receptor L1− and HF2− (eqn (2));14 these anions form only when more equivalents of fluoride anions were added. The deprotonation lowers the steric hindrance between the NHa or NHc groups and the nitrophenyl units, and therefore makes it possible to the formation of a π-conjugated plane with more extended areas. As a result, naked eye changes in colours from pale yellow to orange were found in the presence of excess fluoride anions. This deprotonation process had already been evidenced previously. For example, Fabbrizzi et al. stated that the F− ions first establishes a hydrogen-bonding interaction with urea receptors to give a stable 1![[thin space (1/6-em)]](https://www.rsc.org/images/entities/char_2009.gif) :
:![[thin space (1/6-em)]](https://www.rsc.org/images/entities/char_2009.gif) 1 complex, and then on addition of a second equivalent, induces urea deprotonation, due to the formation of HF2−.14,15 In another case, similar to L1, in the presence of saturated F− ions, a series of tripodal tris-urea based on mesitylene showed a similar bathochromic shifts with a decrease in its max absorbance and with a simultaneous increase in a higher absorption wavelength, corresponding to the deprotonation of these receptors.56
1 complex, and then on addition of a second equivalent, induces urea deprotonation, due to the formation of HF2−.14,15 In another case, similar to L1, in the presence of saturated F− ions, a series of tripodal tris-urea based on mesitylene showed a similar bathochromic shifts with a decrease in its max absorbance and with a simultaneous increase in a higher absorption wavelength, corresponding to the deprotonation of these receptors.56
On the other hand, as mentioned above, upon addition of F− ions the absorption of L2 at 377 nm progressively decreases and slightly red shift to 385 nm, whereas the development of a new peak at 495 nm corresponds to anionic receptor is observed (Fig. 3). This new peak appeared for L2 in the presence of fluoride is red-shifted by 118 nm, which is slightly smaller than that for L1 (134 nm), as showed in Fig. 2 and 3. In contrast, as depicted in Fig. S11,† two very weak broad absorptions approximately at 467 nm and 423 nm were presented, when excess amount of F− was titrated with receptor L3. To verify the phenomenon of deprotonation, a titration of L1 with tetrabutylammonium hydroxide (TBAOH) was performed in the same conditions. Since TBAOH is a strong base, it is bound to induce the deprotonation of the receptor. On the addition of increasing amounts of TBAOH to the DMSO solution of L1 led to a sharp decrease of the band at 350 nm too, which is assigned to the π–π* transition of nitrophenyl chromophore; whereas, a new band centred at 490 nm appeared and increased gradually (Fig. S13†). Similar trend was observed for L2 with the absorption decrease at 377 nm and new bands development at 494 and 514 nm (Fig. S14†). In contrast, with respect to L3, the UV-Vis spectrum of L3 presented a slight difference absorption. The max absorption at 360 nm decreased simultaneously with one intense band developed at low wavelength of 297 nm and one broad band appeared around 497 nm (Fig. 4). A similar phenomenon was previously reported for OH− ions binding with a tripodal tris-urea receptor. The addition of more than 8–10 equivalents of TBAOH to mesitylene based tris-urea resulted in the emergence of a band at 474 nm (Δλ ∼ 125 nm, corresponding to deprotonation) with a simultaneous decrease in the absorption of the band at 348 nm, and the latter disappearing completely after addition of 100 equivalents of the anions.56 An in-depth interpretation of the interaction in the presence of F− ions will be accomplished in conjunction with the results of the NMR experiments and theoretical calculations in the following sections.
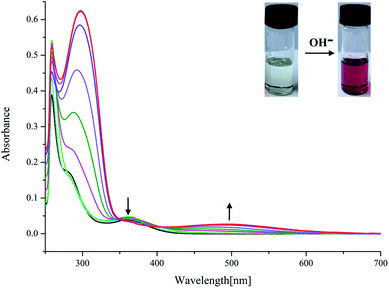 | ||
| Fig. 4 Changes in UV-Vis spectra for L3 with addition of TBAOH in DMSO solution ([L3] = 1.0 × 10⁻⁵ M). | ||
NMR titration studies
As previous UV-Vis and the naked eye detection studies, we postulated the hydrogen bond formation and further deprotonation of the urea N–H protons of receptors L1–L3 by excess fluoride and hydroxide anions cause the unique absorption behaviour and visible changes in colour. Nevertheless, it remains questionable how many protons had been deprotonated and in which order. To figure out these questions, L1 as a represented receptor and its NMR titration studies were pursued in further, while the titration profiles towards fluoride for receptors L2–L4 were also provided in Fig. S31–S33.† Here, the partial 1H NMR spectra has been described in Fig. 5 and 6, the DMSO-d6 solution of L1 (5.0 × 10⁻³ M) was dealt with TBAF. Firstly, as posted in Fig. 5, upon addition of fluoride anions at low concentration, the ureido N–Ha (9.44 ppm), N–Hc (9.24 ppm) and N–Hb (6.62 ppm) proton signals showed severe broadening with drastic downfield shift (Δδ = 0.37, 0.06 and 0.76 ppm), this shift strongly indicates that fluoride binds to the ureido N–H protons, forming a strong H-bond with N–Ha, N–Hc or N–Hb protons. This result is significantly coherent with the UV-Vis results that the equilibrium of eqn (1) is established. Specifically, on the addition of 0.15 equivalent of fluoride anions, the N–Hc proton signal disappeared firstly. Subsequently, when 0.2 equivalent of TBAF was treated with the receptor, the N–Ha proton signal completely misses. In the next, the proton signal of N–Hb, which is linked to an alkyl group, is the last one that disappeared from the NMR spectra, where 0.4 equivalent of F− ions was added. These results indicated that the fluoride ion preferably interacts with the ureido N–H protons in the order of N–Hc > N–Ha > N–Hb. Simultaneously, with the increasing amount of F−, the aromatic C–H protons signals of Hcα, Hcβ and Haα exhibited a small up field shift due to the through-bond effects, which is because of the complexation of L–H⋯F− and thus results in the increase of electron density. Whereas the Haβ proton belongs to a dominant electrostatic effect that induces deshielding and causes a downfield shift, derived from a through-space effect.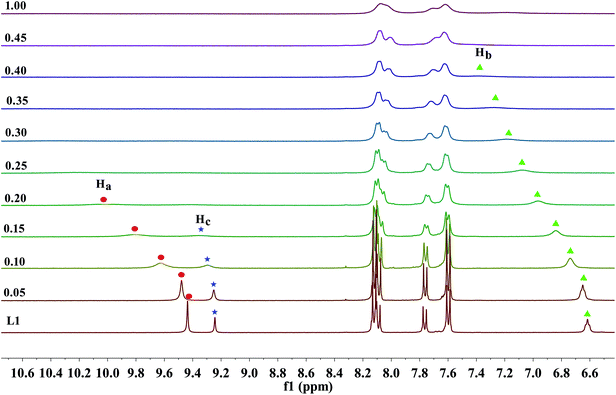 | ||
| Fig. 5 Stack plot of the 1H NMR spectra of receptor L1 in the presence of increasing amounts of TBAF (0–1 equiv.) recorded in DMSO-d6 solution. | ||
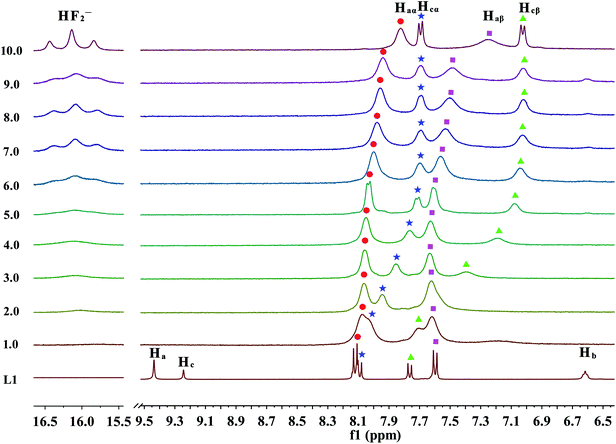 | ||
| Fig. 6 Stack plot of the 1H NMR spectra of receptor L1 in the presence of increasing amounts of TBAF (1–10 equiv.) recorded in DMSO-d6. | ||
Moreover, when more amounts of fluoride were treated with the receptor, a remarkably upfield shift of the Hcα and Hcβ protons as a result of increase through-bond charge delocalization is occurred, as is displayed in Fig. 6. This shift holds until the addition of 6.0 equivalents of F− ions. With further addition of excess F− ions, it has no effect on the Hcα and Hcβ protons, which is presumably because of the electron density increases through the more extended π-conjugated system due to the N–Hc proton completely leave the receptor molecule. In contrast, the Haα and Haβ protons almost stay constant up to the addition of 5.0 equivalents of fluoride anions. Then, these aromatic protons, which are linked with –NHa group, gradually undergo an upfield shift. This phenomenon is probably induced by a further deprotonation of Ha or Ha′ via a through-bond effect, increasing charge density of the ring connected with ureido –NHa or –NHa′ moiety, respectively. Overall, these results suggested that the deprotonation of Hc proton prefers to Ha or Ha′ protons. Meanwhile, the urea deprotonation could be further evidenced by the occurrence of HF2− proton signals in the downfield of NMR spectrum. In particular, when 2.0 equivalents of fluoride anions was titrated into the solution of receptor L1, a broad proton signal around 16 ppm appears and increases gradually, which can be ascribed to the bi-fluoride anion (FHF−), the most-stable hydrogen bond complex that fluoride ion can form, as is depicted in Fig. 6.15 However, in many cases, the strong hydrogen bonding also leads to the disappearance of the ureido proton signals which looks like to be the case here, while the UV-Vis titrations have indicated hydrogen bonding and not deprotonation in the case of their urea receptors.20,57 Although fluoride anion is not a specially strong base (pKa = 15 in DMSO),58 however, the extreme stability of [HF2]− anion is well indentified10,59 and it is known to act as a very strong base, second to OH− in DMSO.
With respect to OH−, the addition of one equivalent of OH− to the DMSO solution of receptors L1–L3 with EWG resulted in the complete disappearance of proton signals for all of the ureido N–H protons (N–Ha, N–Hb and N–Hc), which may signify their deprotonation too (Fig. S27–S29†). By contrast, the addition of F− to the solution of L4 led to the urea proton (–Ha,–Hb and –Hc) signals broaden, whereas the more alkalinity hydroxide ion induced the urea proton signals disappeared completely (Fig. S30†). This is quite reasonable that although the N–H acidity of L4 with EDG is weaker than that of L1–L3 with EWG, hydroxide is a stronger base in comparison with fluoride, which can induce the deprotonation of a weaker acid of urea N–H in receptor L4.65
On the other hand, beside of the interaction between receptors and fluoride or hydroxide anions, we are also very curious about whether if other anions features binding affinity with receptors in the NMR time-scale. No obvious changes in NMR spectrum during the titration of one equivalent of each anion to receptors L1–L4 were observed (Cl−, Br−, I−, NO3−, ReO4−and ClO4−), except H2PO4− and CH3COO−, as are set out in Fig. S27–S30.† Particularly, instead of strong broadening of the ureido N–H proton signals in the presence of low concentration of F− ions, all of the three N–H protons signals shifted to far downfield, corresponding to N–Ha, N–Hc and N–Hb when one equivalent of H2PO4− was treated. In the case of CH3COO−, these protons signals show a similar behaves. Overall, these results suggested the formation of an interactive complex of tris-urea receptors with these two anions during the NMR titration. Furthermore, it should be pointed out that although the addition of H2PO4− and CH3COO− ions induced receptor–anion interaction in NMR scale, however, no visible colour changes were observed during the NMR experiments, which may suggest no deprotonation in the presence of these two anions.
To aid discussion of anion binding capability, the H2PO4− and CH3COO− binding constants for L1–L4 were determined by NMR titration (Fig. S34–S41†). Association constants of F− and OH− anions could not be determined due to the deprotonation of the receptors in DMSO. When the data obtained upon stepwise anion addition were fitted to a 1![[thin space (1/6-em)]](https://www.rsc.org/images/entities/char_2009.gif) :
:![[thin space (1/6-em)]](https://www.rsc.org/images/entities/char_2009.gif) 1, 2
1, 2![[thin space (1/6-em)]](https://www.rsc.org/images/entities/char_2009.gif) :
:![[thin space (1/6-em)]](https://www.rsc.org/images/entities/char_2009.gif) 1 and 1
1 and 1![[thin space (1/6-em)]](https://www.rsc.org/images/entities/char_2009.gif) :
:![[thin space (1/6-em)]](https://www.rsc.org/images/entities/char_2009.gif) 2 binding models using BindFit software,66 and the calculated association constants are summarised in Table S1.† For H2PO4−, the binding data were best fit to a 1
2 binding models using BindFit software,66 and the calculated association constants are summarised in Table S1.† For H2PO4−, the binding data were best fit to a 1![[thin space (1/6-em)]](https://www.rsc.org/images/entities/char_2009.gif) :
:![[thin space (1/6-em)]](https://www.rsc.org/images/entities/char_2009.gif) 1 binding model. In contrast, for CH3COO−, the titration data of L3 and L4 were best fit to a 2
1 binding model. In contrast, for CH3COO−, the titration data of L3 and L4 were best fit to a 2![[thin space (1/6-em)]](https://www.rsc.org/images/entities/char_2009.gif) :
:![[thin space (1/6-em)]](https://www.rsc.org/images/entities/char_2009.gif) 1 binding model. This is presumably that the volume of H2PO4− is larger than that of CH3COO− leads to a better cooperative encapsulation by the two symmetric urea units (N–Ha, N–Hb, N–Ha′ and N–Hb′) in one receptor; whereas the small volume of CH3COO− prefers to being capsuled by two urea unit from two different receptors. It needs to be noted that, in the case of CH3COO−, binding to the receptor L3 with meta EWG substituents was found to be stronger than those of other receptors (log
1 binding model. This is presumably that the volume of H2PO4− is larger than that of CH3COO− leads to a better cooperative encapsulation by the two symmetric urea units (N–Ha, N–Hb, N–Ha′ and N–Hb′) in one receptor; whereas the small volume of CH3COO− prefers to being capsuled by two urea unit from two different receptors. It needs to be noted that, in the case of CH3COO−, binding to the receptor L3 with meta EWG substituents was found to be stronger than those of other receptors (log![[thin space (1/6-em)]](https://www.rsc.org/images/entities/char_2009.gif) Ka,1:1 = 3.14, log
Ka,1:1 = 3.14, log![[thin space (1/6-em)]](https://www.rsc.org/images/entities/char_2009.gif) Ka,2:1 = 3.11) (Table S1†). Unexpectedly, aryl substituents with EWG (–NO2) for L1–L3 (log
Ka,2:1 = 3.11) (Table S1†). Unexpectedly, aryl substituents with EWG (–NO2) for L1–L3 (log![[thin space (1/6-em)]](https://www.rsc.org/images/entities/char_2009.gif) Ka,1:1 = 1.90–2.44) resulted in a decrease in affinity for H2PO4− in comparison to that observed for phenyl derivative with EDG (–CH3) for L4 (log
Ka,1:1 = 1.90–2.44) resulted in a decrease in affinity for H2PO4− in comparison to that observed for phenyl derivative with EDG (–CH3) for L4 (log![[thin space (1/6-em)]](https://www.rsc.org/images/entities/char_2009.gif) Ka,1:1 = 2.52). This trend is slightly difference that normally observed for urea derivatives, where it is well-established that addition of aryl substituents bearing EWG increases affinity for a range of anions.67
Ka,1:1 = 2.52). This trend is slightly difference that normally observed for urea derivatives, where it is well-established that addition of aryl substituents bearing EWG increases affinity for a range of anions.67
X-ray crystal structure analysis
The role of hydrogen bonding in assembling receptor and anion complex species in the solid state is visualized by crystal packing. Regardless of the fact that crystallizations of the receptors and their anion complexes were carried out, however, the difficulties in crystallization of complex species limited our efforts directly figuring out the interaction of anions with receptors. Nevertheless, the crystal structures of some of the receptors, L1–L3, still can provide some helpful information. Firstly, yellowish single-crystal of L1·0.5 (Et2O) with rectangular shape was grown by slow evaporation of a DMF solution of the receptor with one equivalent of [NH4][ReO4] in three weeks. As showed in Fig. 7, one intramolecular hydrogen bond is found and the bond length (H5⋯O7) for N–H⋯O is 2.056 Å. Obviously, the distance in space between the other two urea motifs is really far from each other, forming this intramolecular hydrogen bond. Besides, it is worth noting that two carbon atoms (C17 and C18) and one nitrogen atom (N7) between N4 and C19 are disordered in this structure due to the labile of the hydrocarbon chain in this molecule, as is represented in Fig. 7. Accordingly, these two urea motifs vibrates on the up and down sides of the amide plane (O4–C10–N4–C9), even so the two urea motifs in one receptor molecule look like hardly assemble into a cooperative conformation to encapsulate anions in one cavity. Meanwhile, single-crystal of free receptor L2 suitable for XRD determination was isolated by slow evaporation of a DMSO solution of L2 in a few weeks. This crystal is found in a yellowish colour with tabular shape. As showed in Fig. 8, there are three N–H⋯O intramolecular hydrogen bonds in the range of 1.975–2.116 Å between one oxygen of a nitro group and the nearest hydrogen of N–Ha or N–Ha′ in each urea motif. In comparison with L1, the two urea motifs, which are connected with a labile carbon chain, are on the opposite side of the O4–C10–N4–C9 amide plane in L2. In addition, rectangular crystals of L3·DMSO were grown by slow evaporation of a DMSO solution of receptor L3 with one equivalent [TBA][HSO4] in one month. One N–H⋯O intramolecular hydrogen bond length is of 2.095 Å (N8–H8⋯O3), as is shown in Fig. 9. Interestingly, one DMSO molecule is co-crystalized with L3 and hydrogen bonded to H6 in one of urea motifs. This intermolecular hydrogen bond length is 1.915 Å (O10⋯H6–N6).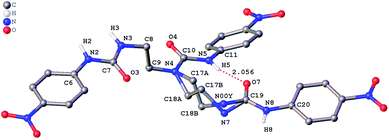 | ||
| Fig. 7 Crystal structure of L1·0.5 (Et2O) with ellipsoids shown at the 25% probability level. Hydrogen atoms attached to carbons and the diethyl ether molecule have been omitted for clarity. | ||
 | ||
| Fig. 8 Crystal structure of L2 (left, top view; right, side view) with ellipsoids shown at the 25% probability level. Hydrogen atoms attached to carbons have been omitted for clarity. | ||
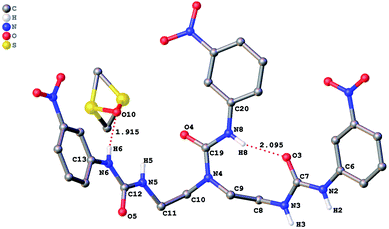 | ||
| Fig. 9 Crystal structure of L3·DMSO with ellipsoids shown at the 25% probability level. Hydrogen atoms attached to carbons have been omitted for clarity. | ||
On the other hand, it also needs to be mentioned that we attempted to obtain crystal structures of the deprotonated receptors for further evidencing the above experimental observation that tris-urea receptors can be deprotonated by excess of F− ions. During the course of the above titration experiments, we observed that upon leaving the coloured solutions of receptors with TBAF open to the air for several hours, the colour change reversed. We firstly speculated this to be resulted from the absorption of water from the atmosphere. To investigate this further, we attempted to grow crystals from the solution of receptors with excess of TBAF (or the deprotonated form of L after addition of F−) under a dry atmosphere. Unfortunately, although crystals of receptors with TBAF were isolated, these crystals were not suitable for single-crystal diffraction determination. Nevertheless, crystals suitable for single-crystal XRD experiment were obtained by diethyl ether vapour-diffusion into an acetone solution of L1 and TBAF in a closed container. The obtained structure displayed that these crystals are not the deprotonated form of L1. However, in fact it is the TBA salt of HCO3− ion, this bicarbonate anion presumably was produced from atmospheric CO2, which was fixed by the basic TBAF solution. This phenomenon is also reported previously. Specifically, a 1,3-bis(4-nitrophenyl)urea receptor, the addition of excess F− induced the deprotonation of the urea N–H group, and that following fixation of atmospheric CO2, an H-bond complex formed between the neutral receptor and HCO3−.14 In another case, a tren-based tris-urea receptor with EWGs can efficiently capture and fix atmospheric CO2 as air-stable crystals of a CO32−-encapsulated molecular capsule, triggered by the presence of TBAF/TBAOH in a DMSO solution of receptor.36
Theoretical studies
In order to acquire insight on the receptors and the corresponding anionic receptors at the molecular level, we carried out theoretical studies using the density functional theory employing Gaussian 09 program. The previous studies have indicated that the M06-2X functional provides a satisfactory description of non-covalent interactions in comparison with other density functionals.60–63 The above titrations results suggest that the interaction between receptors and fluoride anion undergoes a multi-step reaction: hydrogen bond formation and stepwise deprotonation of urea protons. However, the detailed deprotonation process is still unclear. Thus, DFT studies related to this deprotonation process were carried out and the following kinetic eqn (3)–(7) established based on experimental results had been systematically investigated:| [L–H5] + 2F− ⇆ [L–H4]− + [HF2]− | (3) |
| [L–H4]− + 2F− ⇆ [L–H3]2− + [HF2]− | (4) |
| [L–H3]2− + 2F− ⇆ [L–H2]3− + [HF2]− | (5) |
| [L–H2]3− + 2F− ⇆ [L–H]4− + [HF2]− | (6) |
| [L–H]4− + 2F− ⇆ L5− + [HF2]− | (7) |
The stepwise deprotonation energies of L1 were summarized in Table 1. The deprotonation energy was calculated according to Ed = E([L]−) + E(HF2−) − E(L) − 2E(F−). Particularly, with the NMR experiments, the N–Hc proton disappeared first in comparison with other two protons, N–Ha and N–Hb. In addition, signals of aromatic C–H linked to N–Hc were drastically moved to upfield with the development of HF2− ion. These results proved the N–Hc proton deprotonated first over other N–H protons in this receptor molecule. Our findings are in accordance well with DFT calculations that the deprotonation energy of N–Hc by F− for L1 is −19.87 kcal mol−1 according to eqn (3), as is shown in Table 1. Obviously, the second deprotonation of ureido proton by F− ion has two options, two N–Ha (N–Ha′) or two N–Hb (N–Hb′). Unsurprisingly, deprotonation energy for N–Ha is around −23 kcal mol−1 according to eqn (4), which is about 7.5 kcal mol−1 lower than that for N–Hb (Fig. S42†). This lower deprotonation energy of N–Ha compared with N–Hb is probably because that the N–Hb is linked with a methylene group whereas the N–Ha is connected to an aromatic ring. It is quite reasonable that the nitrophenyl ring can stabilize the negative charge from the deprotonated ureido N atom preferring to the alkyl carbon. This phenomenon was further evidenced by the deprotonation of N–Hb or N–Hb′, which is energetic unfavourable by 1.05 and 1.99 kcal mol−1 higher for N–Ha and N–Ha′ according to eqn (6) and (7), respectively, as is provided in Table 1. This result also implied that the N–Hb bond is unfavourable to be dissociation by fluoride anions in DMSO solution. Overall, the deprotonations of these three ureido protons, one N–Hc and two N–Ha (or N–Ha′), prefers to those two ureido N–Hb (or N–Hb′) protons. This result matches well with the above experimental studies. This deprotonation behaviour of urea receptors by fluoride or hydroxide anions had been evidenced experimentally in previous.14,15,56
On the other hand, in order to compare the deprotonation abilities for all of the receptors, we also performed the DFT calculations on deprotonation energies of the three protons as Ed3 = E([L–H2]3−) + E(HF2−) − E([L–H3]2−) – 2E(F−), one N–Hc and two N–Ha (or N–Ha′), for L1-L4 with a combination of eqn (3)–(5). The tendency of deprotonation for receptors affording trianion was in the order of L13− > L23− > L33− > L43−. And these deprotonation energies were provided in Table S2.† This result is quite reasonable that EWG (–NO2) on a phenyl ring increase the acidity of the ureido proton compared with the EDG (–m-Me, L4), which is correlated with the previous study.64,65 It can be seen that the introduction of EWG on the para position increases the stability of the receptor trianion in comparison with that on the ortho or the meta positions.
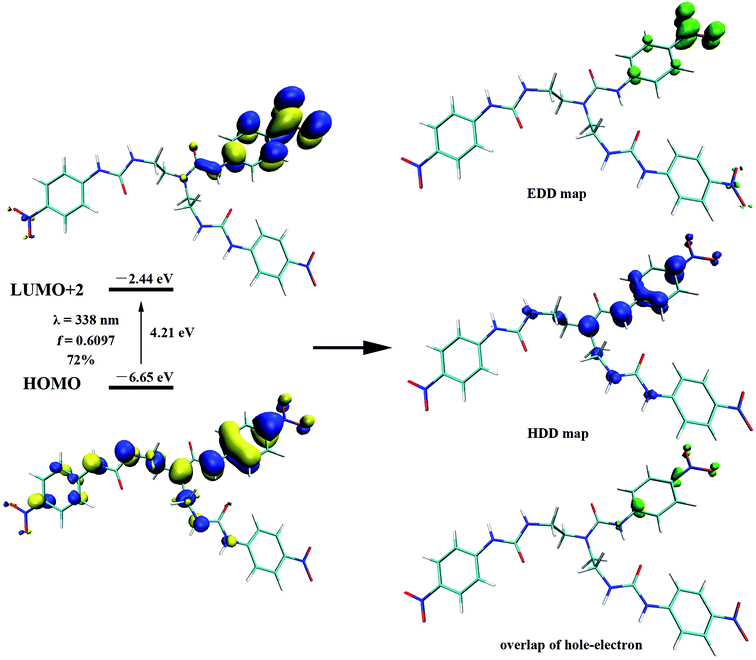
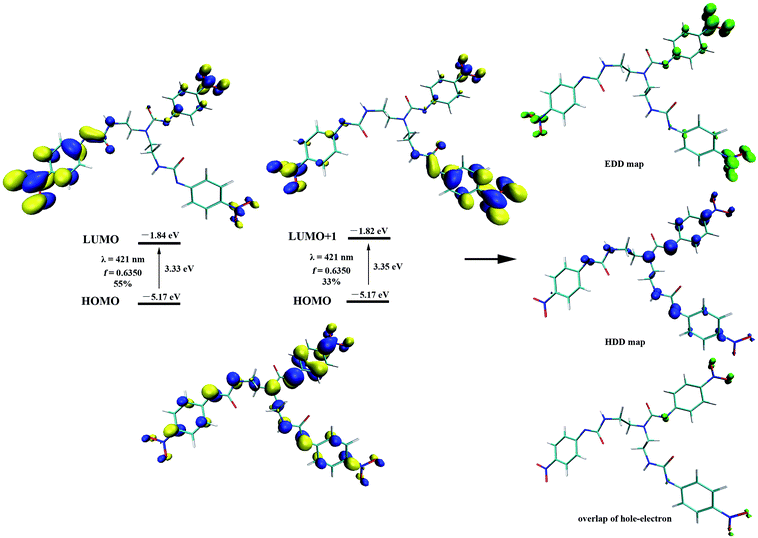
To gain further insight on the colorimetric visible observation toward fluoride, electronic properties of neutral receptors and the corresponding receptors trianion were studied employing TDDFT method in PBE0/def2-TZVP level of theory using the geometry optimized above. For all the species, we have calculated the lowest 10 excited states in DMSO media with PCM model. Transition wavelengths, oscillator strengths and main contribution were summarized in Table 2. For receptors L1–L4, the calculated absorption is in reasonable agreement with the experimental results. In particular, the first absorption peak of L1 locates at 338 nm with an oscillator strength f = 0.6097, which is in agreement with the experimental wavelength of 350 nm (Fig. 2). This absorption is assigned to the HOMO → LUMO+2 (72%) transition with obvious intramolecular charge transfer (ICT) character, as is depicted in Fig. 10. The deprotonation of L1 presumably generated L13− in DMSO solution, which has been discussed above, causes a significant red shift from 338 to 421 nm (from 350 to 484 nm for experimental data) for the first absorption peak. This absorption of L13− originated from HOMO → LUMO (55%) and HOMO → LUMO+1 (33%) transitions (Table 2, Fig. 11). In addition, since the deprotonation energy of the first two steps are quite low (Table 1), to figure out the contribution of these two anions to the absorption, we also performed TDDFT calculations for mono anion and dianion of L1. The corresponding TDDFT results for L1− and L12− were also provided in Table S3.† The first absorptions of L1− and L12− are 400 (S3, f = 0.8904) and 386 nm (S6, f = 0.7328), respectively, which are respectively ascribed to the HOMO → LUMO+2 (99%) and HOMO−1 → LUMO+2 (61%) transitions (Table S3†). Although these two absorptions are also both red shifted 62 and 48 nm with respect to that of L1, respectively, the experimental absorption is in better line with the calculated results of the deprotonated trianion L13−. These TDDFT results are in good agreement with the thermodynamic calculations.
| Receptors/anion | Excited state | Transition wavelength (nm) | f | Configurationa | λexp (nm) |
|---|---|---|---|---|---|
| a H denotes HOMO and L denotes LUMO.b A sharp absorption band developed upon the titration of fluoride.c A very weak absorption band developed upon the titration of fluoride. | |||||
| L1 | 1 | 338 | 0.6097 | H → L+2 (72%) | 350, 484b |
| L13− | 1 | 421 | 0.6350 | H → L (55%) | |
| H → L+1 (33%) | |||||
| L2 | 1 | 393 | 0.0300 | H → L (79%) | 377, 495b |
| 2 | 380 | 0.1583 | H−1 → L+1 (38%) | ||
| H → L+1 (52%) | |||||
| L23− | 1 | 491 | 0.1088 | H → L (66%) | |
| 4 | 426 | 0.1666 | H−2 → L+1 (63%) | ||
| L3 | 1 | 388 | 0.0201 | H → L+1 (56%) | 356, 421c |
| 4 | 363 | 0.0308 | H → L (53%) | ||
| L33− | 1 | 598 | 0.0197 | H → L+1 (85%) | |
| 4 | 567 | 0.0177 | H−2 → L (49%) | ||
| L4 | 1 | 254 | 0.0391 | H−1 → L+1 (55%) | 275, 376c |
| 5 | 236 | 0.4904 | H → L+3 (13%) | ||
| H → L+4 (26%) | |||||
| L43− | 1 | 301 | 0.0450 | H−1 → L (60%) | |
| 7 | 268 | 0.7946 | H−2 → L+4 (18%) | ||
| H−1 → L+4(16%) | |||||
| H−1 → L+5 (27) | |||||
Similarly, L2 represented a noticeable red shift absorption from 380 (S2, f = 0.1583) to 491 nm (S1, f = 0.1088) due to the deprotonation of L2. This shift (111 nm) is in well agreement with the experimental spectrum from 377 to 495 nm (118 nm) (Table 2). It is worth noting that although a red shift for L3 from 363 to 598 nm was found with TDDFT calculations, while the experimental spectrum in the lower energy region for L3 displays weak absorption presumably due to the small oscillator strength values. The oscillator strength for L33− are 0.0197 (S1) and 0.0177 (S4), which are much smaller than those for L13− or L23−. Nevertheless, this result correlated well with the UV-Vis experimental results.
In contrast to the result for EWG substituent, the EDG substituent significantly increased the excitation energy of the urea receptor in L4. This lead to a blue shift of the first absorption (S5, 236 nm) for L4 with an oscillator strength f = 0.4904. It should be mentioned that even the calculated absorption peak for L4 has a slight deviation from the experimental value (275 nm), its excited transition could also give a reasonable result comparable with the experimental observation. In comparison with the absorption of L4, although the deprotonated trianion L43− represents a small red shift (32 nm), as is presented in Table 2, its max absorption is also located in a UV region (268 nm) which cannot result in a visible change in colour on the addition of excess of F− to L4.
In light of the nonapplicability of a single molecular orbital pair excitation model, the issue was avoided by conceptualizing multi-molecular orbital excitations in accordance with electron (EDD) and hole (HDD) density distribution, providing very clear features of excited state for the receptors and the corresponding receptors anion. EDD (green) and HDD (blue) maps denoting the regions where an electron goes and leaves to be examined, respectively, as depicted in Fig. 10 and 11. Concerning the L1, the EDD region mainly located at the nitro group on the phenyl ring linked to N–Hc, while the HDD spread through the urea (N–Hc) moiety, particularly on the nitrogen atoms and the connected three aromatic carbon. It can be seen that the overlap of EDD and HDD is very small (Fig. 10), this means the electron and hole are almost separated, indicating a typical intramolecular CT excited state. Thus, we decided to use Multiwfn program52 again and calculate the Δr coefficient which is useful when it comes to the identification of excitation type.68 As stated by Guido et al., locally excited (LE) type are characterized by Δr index smaller than 2.0 Å. The higher the Δr index is, the more likely is that the excitation is of CT mode. In the present case of L1, the Δr index is 6.510 Å (Table S4†), distinctly indicating a CT excitation mode. In addition, we further performed a calculation of distance between centroids of electrons and holes (D), which is another measure of CT length and is an indicator of excitation type. The larger the value, the longer length the charge transfers. According to high D value of 3.863 Å for L1, we can finally point out that the excited mode of S1 belongs to CT type (Table S4†). These results are in accordance with the main MO contribution from HOMO to LUMO+2, that the HOMO locates around the whole molecule while the LUMO+2 focuses on the phenyl ring linked to ureido N–Hc group, as is shown in Fig. 10.
On the other hand, as can be seen that the HDD map for L13− delocalizes over the whole molecule, including three urea moieties, Hα and the nitro group linked aromatic carbon; whereas the EDD concentrates mostly on the three –NO2 moieties (Fig. 11). Obviously, the EDD map and HDD map separated entirely for L13−, indicating a CT type excitation. This is also evidenced by the large Δr index (6.095 Å) and D value (2.218 Å).
Conclusions
In summary, a series of asymmetric tris-urea receptors with EWG and EDG urea receptors L1–L4 has been prepared and characterized. These receptors with a EWG substituent showed a naked-eye detection and discrimination of fluoride and hydroxide anions over other anions like chloride, bromide, iodide, dihydrogen phosphate, hydrogen sulphate, acetate, nitrate, perchlorate and perrhenate in DMSO medium. We have experimentally confirmed that stepwise deprotonation of the three urea N–H protons linked to the phenyl ring upon the addition of excess F− or OH− ions is responsible for these vivid colour development. This visible change in colours associates well with the UV-Vis experimental results that a new intense band with bathochromic shift developed gradually on the addition of fluoride or hydroxide anions to receptor. In addition, NMR titrations also proved that proton transfer takes place in the presence of excess F− ions, with formation of HF2− ion, the most-stable H-bond complex that fluoride anion can form. On the other hand, DFT calculations displayed that the deprotonation of one N–Hc and two N–Ha (or N–Ha′) protons linked to aromatic ring in energies is more favourable than that of the two N–Hb (or N–Hb′) protons linked to alkyl group when excess fluoride or hydroxide anions exists. TDDFT results implied that a lower excitation energy for anionic receptors compared with their neutral ones and charge transfer mostly from the urea subunits to nitro moieties in the excited state was responsible for the bathochromic absorption, reflecting the colorimetric visible changes. More importantly, our results indicated that asymmetric phenyl urea substituted by EWG as simple highly coloured CT chromophore have potential as naked-eye sensor for F− and OH− ions in DMSO solution. We are currently investigating EWG derived asymmetric multi-ureas frameworks as simple visible colorimetric sensors for ions recognition.Conflicts of interest
There are no conflicts to declare.Acknowledgements
This work was supported by the National Natural Science Foundation of China (grant numbers 21501123, 11775153, 11575122). We would like to acknowledge the “Comprehensive Training Platform of Specialized Laboratory, College of Chemistry, Sichuan University” for IR, NMR and XRD analyses. We appreciate the help from Dr Yue Qi for X-ray diffraction single-crystal measurements.Notes and references
- J. L. Sessler, P. A. Gale and W.-S. Cho, Anion Receptor Chemistry: Monographs in Supramolecular Chemistry, RSC, Cambridge, UK, 2006 Search PubMed.
- M. S. Vickers and P. D. Beer, Chem. Soc. Rev., 2007, 36, 211–225 RSC.
- P. D. Beer and P. A. Gale, Angew. Chem., Int. Ed., 2001, 40, 486–516 CrossRef CAS PubMed.
- R. G. Van Kesteren, S. A. Duursma, W. J. Visser, V. Van der Sluys and O. Backer Dicks, Metab. Bone Dis. Relat. Res., 1982, 4, 31–37 CrossRef CAS PubMed.
- K. Müller, C. Faeh and F. Diederich, Science, 2007, 317, 1881–1886 CrossRef PubMed.
- C. I. Lin, S. Selvi, J. M. Fang, P. T. Chou, C. H. Lai and Y. M. Cheng, J. Org. Chem., 2007, 72, 3537–3542 CrossRef CAS PubMed.
- P. A. Gale, Chem. Commun., 2011, 47, 82–86 RSC.
- J.-M. Lehn, Supramolecular Chemistry: Concepts and Perspectives, VCH, Weinheim, 1995 Search PubMed.
- Z. Xu, H. Ge, X. Han, S. H. Liu, X. G. Meng and J. Yin, Tetrahedron, 2017, 73, 6386–6391 CrossRef CAS.
- V. Amendola, D. Esteban-Gómez, L. Fabbrizzi and M. Licchelli, Acc. Chem. Res., 2006, 39, 343–353 CrossRef CAS PubMed.
- M. N. Hoque and G. Das, CrystEngComm, 2017, 19, 1343–1360 RSC.
- V. B. Bregović, N. Basarić and K. Mlinarić-Majerski, Coord. Chem. Rev., 2015, 295, 80–124 CrossRef.
- A. F. Li, J. H. Wang, F. Wang and Y. B. Jiang, Chem. Soc. Rev., 2010, 39, 3729–3745 RSC.
- M. Boiocchi, L. D. Boca, D. E. Gómez, L. Fabbrizzi, M. Licchelli and E. Monzan, J. Am. Chem. Soc., 2004, 126, 16507–16514 CrossRef CAS PubMed.
- D. Esteban-Gómez, L. Fabbrizzi and M. Licchelli, J. Org. Chem., 2005, 70, 5717–5720 CrossRef PubMed.
- P. Bose and P. Ghosh, Chem. Commun., 2010, 46, 2962–2964 RSC.
- J. Kang, Y. J. Lee, S. Lee, J. H. Lee, J. J. Park, Y. Kim, S. J. Kim and C. Kim, Supramol. Chem., 2010, 22, 267–273 CrossRef CAS.
- E. J. Cho, J. W. Moon, S. W. Ko, J. Y. Lee, S. K. Kim, J. Yoon and K. C. Nam, J. Am. Chem. Soc., 2003, 125, 12376–12377 CrossRef CAS PubMed.
- E. J. Cho, B. J. Ryu, Y. J. Lee and K. C. Nam, Org. Lett., 2005, 7, 2607–2609 CrossRef CAS PubMed.
- D. A. Jose, D. K. Kumar, B. Ganguly and A. Das, Org. Lett., 2004, 6, 3445–3448 CrossRef CAS PubMed.
- S. Kondo, H. Sonoda, T. Katsu and M. Unnob, Sens. Actuators, B, 2011, 160, 684–690 CrossRef CAS.
- B. Garg, T. Bisht and S. M. S. Chauhan, Sens. Actuators, B, 2012, 168, 318–328 CrossRef CAS.
- M. Arunachalam and P. Ghosh, Chem. Commun., 2011, 47, 8477–8492 RSC.
- R. Custelcean, Chem. Commun., 2013, 49, 2173–2182 RSC.
- S. K. Dey, A. Basu, R. Chutia and G. Das, RSC Adv., 2016, 6, 26568–26589 RSC.
- B. P. Hay, T. K. Firman and B. A. Moyer, J. Am. Chem. Soc., 2005, 127, 1810–1819 CrossRef CAS PubMed.
- R. Custelcean, B. A. Moyer and B. P. Hay, Chem. Commun., 2005, 5971–5973 RSC.
- D. A. Jose, D. K. Kumar, B. Ganguly and A. Das, Inorg. Chem., 2007, 46, 5817–5819 CrossRef CAS PubMed.
- I. Ravikumar, P. S. Lakshminarayanan, M. Arunachalam, E. Suresh and P. Ghosh, Dalton Trans., 2009, 4160–4168 RSC.
- R. Dutta, P. Bose and P. Ghosh, Dalton Trans., 2013, 42, 11371–11374 RSC.
- R. Dutta, S. Chakraborty, P. Bose and P. Ghosh, Eur. J. Inorg. Chem., 2014, 25, 4134–4143 CrossRef.
- R. Custelcean and P. Remy, Cryst. Growth Des., 2009, 9, 1985–1989 CrossRef CAS.
- A. Pramanik, B. Thompson, T. Hayes, D. R. Powell, P. V. Bonnesen, P. V. Bonnesen, E. D. Ellis, K. S. Lee, H. Yu and M. A. Hossain, Org. Biomol. Chem., 2011, 9, 4444–4447 RSC.
- A. Pramanik, D. R. Powell, B. M. Wong and M. A. Hossain, Inorg. Chem., 2012, 51, 4274–4284 CrossRef CAS PubMed.
- J. R. Hiscock, P. A. Gale and M. J. Hynes, Supramol. Chem., 2012, 24, 355–360 CrossRef CAS.
- S. K. Dey, R. Chutia and G. Das, Inorg. Chem., 2012, 51, 1727–1738 CrossRef CAS PubMed.
- R. Chutia, S. K. Dey and G. Das, Cryst. Growth Des., 2013, 13, 883–892 CrossRef CAS.
- J. Zhao, D. Yang, Y. Zhao, L. Cao, Z. Zhang, X.-J. Yang and B. Wu, Dalton Trans., 2016, 45, 7360–7365 RSC.
- M. Emami Khansari, M. H. Hasan, C. R. Johnson, N. A. Williams, B. M. Wong, D. R. Powell, D. R. Powell, R. Tandon and M. A. Hossain, ACS Omega, 2017, 2, 9057–9066 CrossRef CAS PubMed.
- C. Huang, R. Y. Wang, X. Shu, Y. Qi, S. J. Li and C. Q. Xia, Acta Crystallogr., Sect. E: Crystallogr. Commun., 2017, 73, 1316–1319 CrossRef CAS PubMed.
- O. V. Dolomanov, L. J. Bourhis, R. J. Gildea, J. A. K. Howard and H. Puschmann, J. Appl. Crystallogr., 2009, 42, 339–341 CrossRef CAS.
- G. M. Sheldrick, Acta Crystallogr., Sect. A: Found. Adv., 2015, 71, 3–8 CrossRef PubMed.
- G. M. Sheldrick, Acta Crystallogr., Sect. C: Struct. Chem., 2015, 71, 3–8 Search PubMed.
- M. J. Frisch, G. W. Trucks, H. B. Schlegel, G. E. Scuseria, M. A. Robb, J. R. Cheeseman, G. Scalmani, V. Barone, B. Mennucci, G. A. Petersson, H. Nakatsuji, M. Caricato, X. Li, H. P. Hratchian, A. F. Izmaylov, J. Bloino, G. Zheng, J. L. Sonnenberg, M. Hada, M. Ehara, K. Toyota, R. Fukuda, J. Hasegawa, M. Ishida, T. Nakajima, Y. Honda, O. Kitao, H. Nakai, T. Vreven, J. A. Montgomery Jr., J. E. Peralta, F. Ogliaro, M. Bearpark, J. J. Heyd, E. Brothers, K. N. Kudin, V. N. Staroverov, R. Kobayashi, J. Normand, K. Raghavachari, A. Rendell, J. C. Burant, S. S. Iyengar, J. Tomasi, M. Cossi, N. Rega, J. M. Millam, M. Klene, J. E. Knox, J. B. Cross, V. Bakken, C. Adamo, J. Jaramillo, R. Gomperts, R. E. Stratmann, O. Yazyev, A. J. Austin, R. Cammi, C. Pomelli, J. W. Ochterski, R. L. Martin, K. Morokuma, V. G. Zakrzewski, G. A. Voth, P. Salvador, J. J. Dannenberg, S. Dapprich, A. D. Daniels, Ö. Farkas, J. B. Foresman, J. V. Ortiz, J. Cioslowski and D. J. Fox, Gaussian 09, Revision D. 01, Gaussian Inc., Wallingford, CT, 2013 Search PubMed.
- Y. Zhao and D. G. Truhlar, Theor. Chem. Acc., 2008, 120, 215–241 Search PubMed.
- R. Krishnan, J. S. Binkley, R. Seeger and J. A. Pople, J. Chem. Phys., 1980, 72, 650–654 CrossRef CAS.
- M. Cossi, V. Barone, R. Cammi and J. Tomasi, Chem. Phys. Lett., 1996, 255, 327–335 CrossRef CAS.
- V. Barone, M. Cossi and J. Tomasi, J. Comput. Chem., 1998, 19, 404–417 CrossRef CAS.
- F. Weigend and R. Ahlrichs, Phys. Chem. Chem. Phys., 2005, 7, 3297–3305 RSC.
- J. Zheng, X. Xu and D. G. Truhlar, Theor. Chem. Acc., 2011, 128, 295–305 Search PubMed.
- C. Adamo and V. Barone, J. Chem. Phys., 1999, 110, 6158–6170 CrossRef CAS.
- T. Lu and F. Chen, J. Comput. Chem., 2012, 33, 580–592 CrossRef CAS PubMed.
- W. Humphrey, A. Dalke and K. Schulten, J. Mol. Graphics, 1996, 14, 33–38 CrossRef CAS PubMed.
- Y. Hao, C. Jia, S. Li, X. Huang, X. J. Yang, C. Janiak and B. Wu, Supramol. Chem., 2012, 24, 88–94 CrossRef CAS.
- R. Zhang, Y. Zhao, J. Wang, L. Ji, X. J. Yang and B. Wu, Cryst. Growth Des., 2014, 14, 544–551 CrossRef CAS.
- V. K. Bhardwaj, S. Sharma, N. Singh, M. S. Hundal and G. Hundal, Supramol. Chem., 2011, 23, 790–800 CrossRef CAS.
- J. Y. Lee, E. J. Cho, S. Mukamel and K. C. Nam, J. Org. Chem., 2004, 69, 943–950 CrossRef CAS PubMed.
- F. G. Bordwell, Acc. Chem. Res., 1988, 21, 456–463 CrossRef CAS.
- I. G. Shenderovich, P. M. Tolstoy, N. S. Golubev, S. N. Smirnov, G. S. Denisov and H.-H. Limbach, J. Am. Chem. Soc., 2003, 125, 11710–11720 CrossRef CAS PubMed.
- E. G. Hohenstein, S. T. Chill and C. D. Sherrill, J. Chem. Theory Comput., 2008, 4, 1996–2000 CrossRef CAS PubMed.
- Y. Zhao and D. G. Truhlar, J. Chem. Theory Comput., 2008, 4, 1849–1868 CrossRef CAS PubMed.
- Y. Zhao and D. G. Truhlar, Acc. Chem. Res., 2008, 41, 157–167 CrossRef CAS PubMed.
- L. P. Wolters, P. Schyman, M. J. Pavan, W. L. Jorgensen, F. M. Bickelhaupt and S. Kozuch, Wiley Interdiscip. Rev.: Comput. Mol. Sci., 2014, 4, 523–540 CAS.
- L. S. Evans, P. A. Gale, M. E. Light and R. Quesada, Chem. Commun., 2006, 965–967 RSC.
- C. S. Wilcox, E. Kim, D. Romano, L. H. Kuo, A. L. Burt and D. P. Curran, Tetrahedron, 1995, 51, 621–634 CrossRef CAS.
- Supramolecular.org,http://supramolecular.org/.
- V. Amendola, L. Fabbrizzi and L. Mosca, Chem. Soc. Rev., 2010, 39, 3889–3915 RSC.
- C. A. Guido, P. Cortona, B. Mennucci and C. Adamo, J. Chem. Theory Comput., 2013, 9, 3118–3126 CrossRef CAS PubMed.
Footnote |
| † Electronic supplementary information (ESI) available: Characterizations, NMR data, coordinates of the computed structures and other materials. CCDC 1574164–1574166. For ESI and crystallographic data in CIF or other electronic format see DOI: 10.1039/c8ra07495j |
| This journal is © The Royal Society of Chemistry 2018 |

