
 Open Access Article
 This Open Access Article is licensed under a Creative Commons Attribution-Non Commercial 3.0 Unported Licence
Colorimetric detection of protein via the terminal protection of small-molecule-linked DNA and unmodified gold nanoparticles
Jianwei Zhaoa,
Cuiping Li *b,
Guimin Maa,
Wenhui Haoa and
Hongxia Jia*a
*b,
Guimin Maa,
Wenhui Haoa and
Hongxia Jia*a
aKey Laboratory of Medicinal Chemistry and Molecular Diagnosis of Ministry of Education, Key Laboratory of Analytical Science and Technology of Hebei Province, College of Chemistry and Environment Science, Hebei University, Baoding, 071002, P. R. China. E-mail: jia123renren@126.com; Fax: +86 312 5079403; Tel: +86 312 5079403
bCollege of Public Health, Key Laboratory of Medicinal Chemistry and Molecular Diagnosis of Ministry of Education, Hebei University, Baoding, 071002, P. R. China. E-mail: licuiping198585@126.com; Fax: +86 312 5079010; Tel: +86 312 5079010
First published on 19th November 2018
Abstract
A novel colorimetric strategy for protein detection was developed based on unmodified gold nanoparticles (AuNPs) and terminal protection from a target protein. A hairpin-structured DNA probe with a biotin modification at the 3′ terminus combined with streptavidin (SA) by the high affinity between biotin and SA and resisted degradation from exonucleases III (Exo III), which selectively digested double-stranded DNA from the 3′-terminus. The remaining hairpin DNA lost the capacity to protect AuNPs from salt-induced aggregation, resulting in a color change of AuNPs from red to blue. In the absence of SA, Exo III degraded the hairpin DNA into single-stranded DNA, which adsorbed on the surfaces of AuNPs and prevented aggregation, keeping AuNPs with a red color. The state of AuNP aggregation can be discriminated by colorimetry and also can be measured by UV-vis spectroscopy. Our proposed method provided great selectivity and high sensitivity with a detection limit of 0.24 pmol for SA detection. Moreover, the assay avoided modification, enzymatic amplification and special equipment, and also offered the advantages of being simple, cost-effective, and sensitive. This novel strategy holds great promise for the detection of other proteins by small molecule interactions with proteins.
Introduction
Proteins are of tremendous importance for almost all physiological functions.1 Developing novel and sensitive detections of protein is necessary for disease diagnosis and therapy.2 Currently, monoclonal antibodies and aptamers are typically methods available for determination of proteins. Compared with antibody analysis, aptamers show obvious advantages, including excellent stability, simple and reproducible synthesis, great reusability, and design flexibility.3 However, the number of aptamers is limited, and most proteins fail to find matched aptamers. Additionally, some aptamers of protein are RNA, which is unstable and easy to degrade by ribonucleases.3 These limitations prevent extensive applications in protein assays.In recent years, Jiang's group has developed a novel approach for protein detection by the binding of protein and small molecule-linked DNA.4 Small molecule-tethered DNA binds to a target protein by small molecule/protein interaction and the formed complex of a small molecule/protein protects DNA from being digested by exonuclease I (Exo I), leaving single-stranded DNA (ssDNA) intact. Thus, protein detection is translated into determination of DNA. The method is called terminal protection of small molecule-linked DNA (TPSMLD).4 This interesting strategy has been successfully applied to the detection of FITC antibody,5 H5N1 antibody,6 and folate receptors.7
Based on the terminal protection mechanism, numbers of detection methods for proteins have been developed by combining this with fluorescence, electrochemical, and colorimetric techniques. Fluorescence DNA analysis generally requires signal amplification technologies, such as rolling circle amplification and hybridization chain reaction (HCR), and thus realizes higher sensitivity.8 In addition, it usually needs fluorescent tags, which leads to a sophisticated procedure, prolonged reaction time, low stability, and high cost.3,9 Electrochemical methods commonly need to immobilize ssDNA onto the surface of an electrode which increases complexity.8b,10 Therefore, the development of a label-free, homogeneous, and simple method for protein assay should be an attractive alternative.
Colorimetric detections have attracted increasing attention on the basis of their simplicity, uncomplicated equipment, and visible color-change to the naked eye after an addition of a target analyte.11 Gold nanoparticles (AuNPs) are widely used in colorimetric detections due to their unique optical properties.12 AuNPs show red in an aqueous solution and the addition of enough NaCl can induce aggregation, with concomitant color conversion from red to blue. Single-stranded DNA can adsorb onto the surfaces of AuNPs against salt-induced aggregation and keep the red color of AuNPs. Using this property, some methods of protein detection have been proposed, however, they usually require sophisticated modification on the surfaces of AuNPs, which increases experimental difficulty and time.13
In this work, incorporation of terminal protection of small-molecule-linked DNA and unmodified AuNPs developed a label-free, homogenous, and procedure-saving colorimetric detection of protein. A biotin–streptavidin (SA) system, as a typical representative of small molecule–target protein pairs, has been widely used as a model for protein detection and research of the relationship between small molecules and target proteins. SA detection has great significance for researching the interactions between biotin and SA and the related physiological function mechanisms, such as cell development, cell signaling, protein function, and so on.14 Here, the biotin–SA system was used as a model to evaluate the method. SA captured a biotin-tethered hairpin DNA probe at the 3′-terminus against digestion of exonuclease III (Exo III), leaving the intact hairpin DNA. Double-stranded hairpin DNA failed to prevent salt-induced aggregation of AuNPs, thus showing blue. In the absence of SA, single-stranded DNA generated from Exo III protected AuNPs from aggregation, keeping a red color. SA-dependence on color change can be utilized to quantitatively measure SA amounts.
Results and discussion
Principle of gold nanoparticle-based colorimetric detection of proteins
The proposed strategy for protein detection incorporated terminal protection using a double-strand DNA probe against Exo III and aggregation of AuNPs as shown in Fig. 1. A hairpin-structured DNA probe was designed with 15 pairs of complementary bases as the stem and 6 bases as the loop. Furthermore, a biotin was bound to the 3′-terminus of the hairpin DNA probe. Exo III has been verified to selectively digested double-stranded DNA into nucleotides from the 3′-terminus. In the presence of SA, a 3′-terminus biotin-modified hairpin DNA probe combined with SA on the basis of the high affinity between biotin and SA, and thus the hairpin DNA probe was protected from the degradation of Exo III at the 3′-terminus, leaving the intact hairpin DNA probe. In contrast, without SA, the hairpin DNA probe was degraded into nucleotides and single-stranded DNA residuals.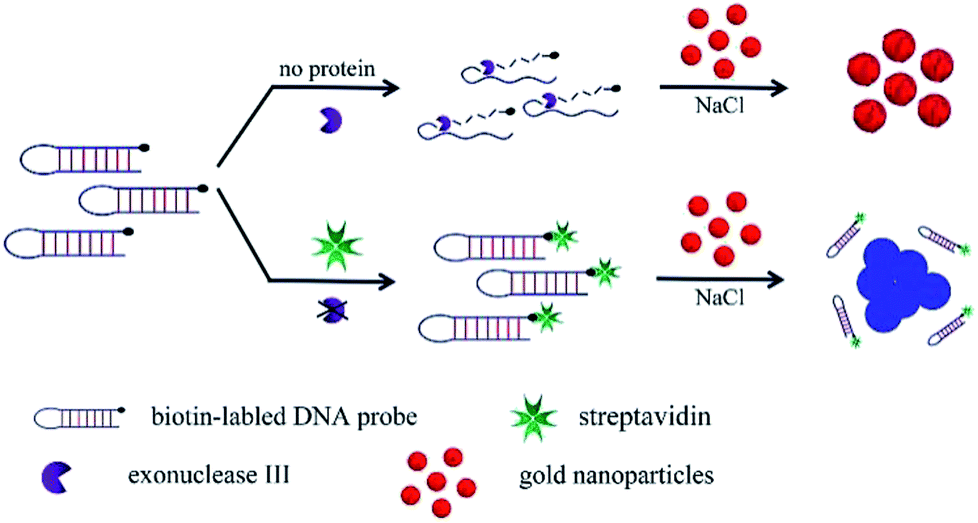 | ||
| Fig. 1 Schematic illustration of the developed protein detection method. | ||
The prepared AuNPs were stably dispersed in an aqueous solution, relying on citrate ion-capped resistance to the van der Waals attraction between AuNPs.15 The addition of enough NaCl curtained the repulsion between AuNPs and induced aggregation, accompanied by the conversion of color from red to blue. Single-stranded DNA could absorb onto the surfaces of AuNPs against salt-induced aggregation. In our work, with SA, a double-stranded hairpin DNA probe failed to adsorb on the surfaces of AuNPs, leading to salt-induced aggregation of AuNPs with concomitant color change from red to blue. On the contrary, in the absence of SA, the generated single-stranded DNA residuals from the degradation of Exo III could adsorb onto the surfaces of AuNPs to prevent aggregation. AuNPs aggregation causes a shift of the maximum absorption wavelength from 525 (red) to 675 nm (blue). The absorbance ratio of A675/A525 is a positive correlation with the concentration of SA, allowing quantitative measurement of SA.
Investigation of optimized experimental conditions for sensitive detection of protein
To obtain optimal experimental conditions, four important reaction parameters, including the amount and reaction time of Exo III, concentrations of the hairpin DNA probe and NaCl, were thoroughly investigated.Without terminal protection, Exo III can catalyze the hydrolysis of duplex DNA from the 3′-hydroxyl terminus, and thus the amount and reaction time of Exo III was directly associated with removal efficiency of the mononucleotide in double-stranded DNA, and further related to AuNPs aggregation. With AuNPs aggregation, the absorbance at 525 nm decreased gradually and meanwhile increased at 675 nm. Therefore, the absorbance ratio A675/A525 was used to evaluate the state of AuNPs aggregation. Various amounts of Exo III, ranging from 2 to 10 U, were tested and the results are shown in Fig. 2. According to the colorimetric photos (Fig. 2A), an increase in Exo III gradually caused the color conversion of AuNPs from blue to red in the absence of SA, while the color of AuNPs exhibited a slight transition in the presence of SA. As seen, the colors showed the greatest difference at 8 and 10 U of Exo III and the largest distinction of absorbance ratio at 675 and 525 nm was also observed at 8 and 10 U of Exo III with and without SA (Fig. 2B). Considering the cost, 8 U Exo III was selected for subsequent experiments. Additionally, the digestion time of Exo III also affected the performance of the method. Fig. 3 shows the effect of varying reaction times with Exo III on the aggregation of AuNPs. It was observed that as reaction time was prolonged (from 30 to 120 min), the color of AuNPs changed from blue to red in the absence of SA, indicating that extended digestion time can release more single-stranded DNA to the solution and stabilize AuNPs. In contrast, after an addition of SA, extended reaction time induced no remarkable color changes, suggesting that terminal protection from SA prevented the degradation of Exo III and AuNPs realized salt-induced aggregation. With and without SA, the color was more obviously different after 90 and 120 min of digestion. However, 90 min was more favorable, due to a greater gap in the absorbance ratio. Therefore, 90 min was chosen as the optimum digestion time of Exo III.
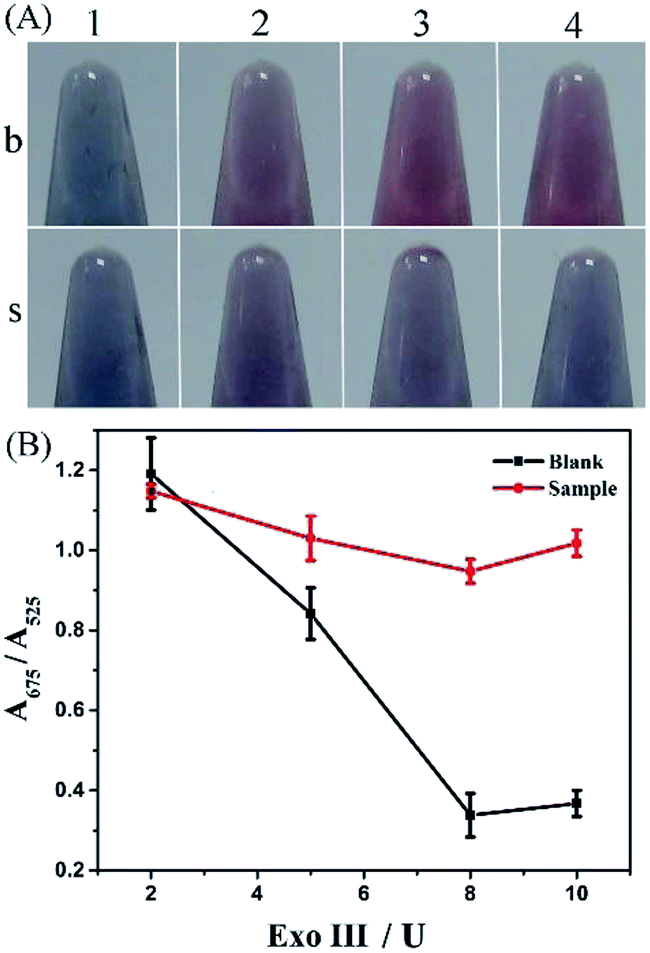 | ||
| Fig. 2 Effect of Exo III amounts on AuNPs aggregation in the terminal protection assay. (A) Colorimetric results of increasing amounts of Exo III with (s) and without SA (b). 1–4 correspond to 2, 5, 8, and 10 U of Exo III. (B) The absorbance ratio A675/A525 in the presence and absence of SA. Blank, without SA; sample, with SA. Error bars represent standard deviation from three repeated experiments. | ||
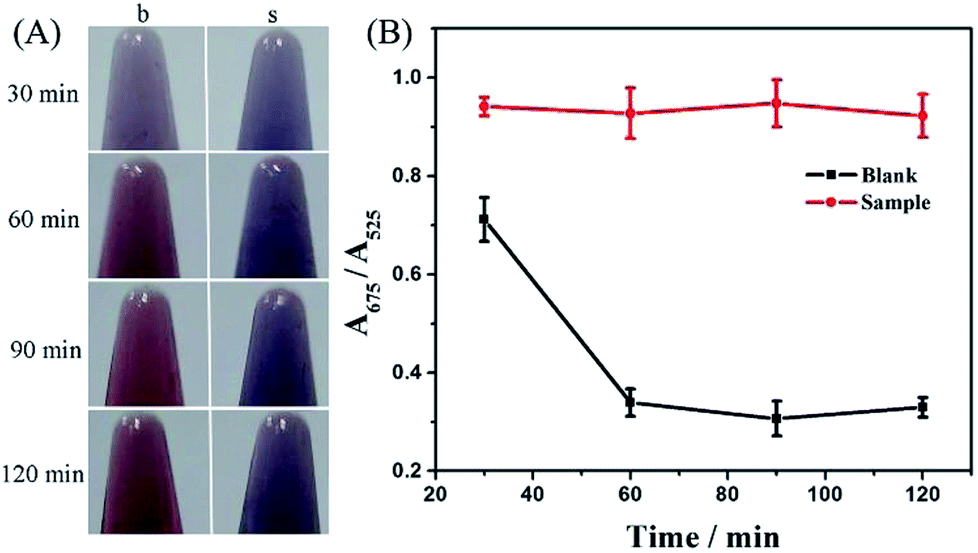 | ||
| Fig. 3 Effect of the reaction time of Exo III on AuNPs aggregation in a terminal protection assay. (A) Colorimetric results of increasing reaction time of Exo III with (s) and without SA (b). (B) The absorbance ratio A675/A525 in the presence and absence of SA. Blank, without SA; sample, with SA. | ||
Amount of a hairpin DNA probe also was a key factor in the reaction system. Insufficient DNA probe lost the ability to generate enough single-stranded DNA against high-concentration salt-induced aggregation of AuNPs, and also failed to meet the combination with abundant SA. When DNA probes were in excess, Exo III degraded residual probes and produced single-stranded DNA against AuNPs aggregation, and thus insufficient SA lost its role in terminal protection. We tested the system with 40, 60, 80, and 100 pmol DNA probes, and found that as the concentration of DNA probe increased, the color of AuNPs changed from blue to red in the absence of SA, while they remained blue from 40 to 80 pmol with a slight tendency of turning red in the presence of SA (Fig. 4). At higher concentrations of the probe (100 pmol), AuNPs resisted salt-induced aggregation and exhibited red color due to plenty of single-stranded DNA produced by digesting excess residual probes, suggesting an excess of DNA probes. Meanwhile, the largest distinction of absorbance ratio was also observed with a 80 pmol DNA probe. Taken together, 80 pmol was the optimal selection.
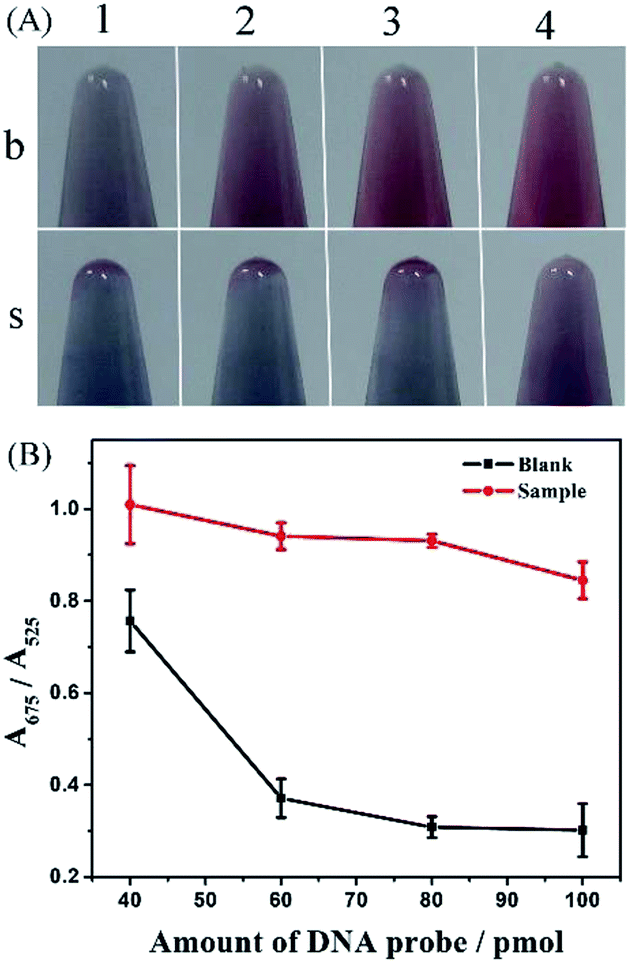 | ||
| Fig. 4 Effect of amounts of hairpin DNA probes on AuNPs aggregation in the terminal protection assay. (A) Colorimetric results of increasing amounts of hairpin DNA probes with (s) and without SA (b). 1–4 correspond to 40, 60, 80, and 100 pmol of hairpin DNA probes. (B) The absorbance ratio A675/A525 in the presence (sample) and absence (blank) of SA. | ||
NaCl concentration was also directly related to aggregation of AuNPs. Fig. 5 shows that the difference in both color and absorbance ratio of A675/A525 was the greatest at 0.15 mol L−1 NaCl. A lower concentration of NaCl (0.1 mol L−1) was unable to induce significant aggregation, while a higher concentration (0.25 mol L−1) resulted in aggregation in the presence and absence of SA. Therefore, 0.15 mol L−1 NaCl was used in the following experiments.
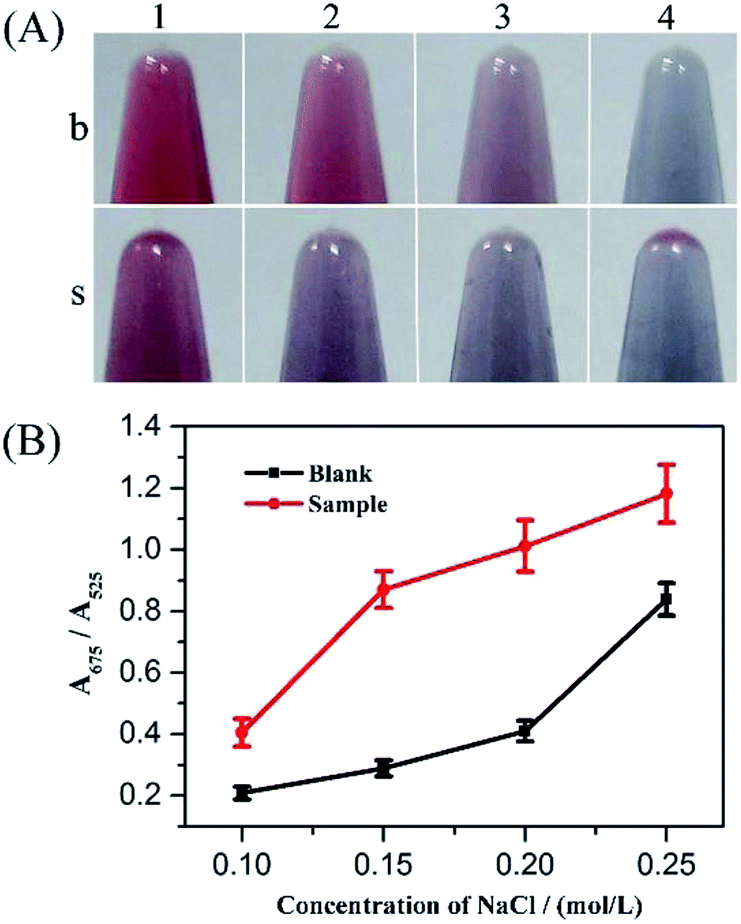 | ||
| Fig. 5 Effect of NaCl concentrations on AuNPs aggregation in the terminal protection assay. (A) Colorimetric results of increasing NaCl concentrations with (s) and without SA (b). 1–4 correspond to 0.1, 0.15, 0.2, and 0.25 mol L−1 NaCl. (B) The absorbance ratio A675/A525 in the presence (sample) and absence (blank) of SA. | ||
Sensitivity investigation
Under the optimized conditions, increasing amounts of SA were added to co-incubate with the hairpin DNA probe according to the description in the Experimental section. Through analysis with a UV-Vis spectrophotometer, spectra were obtained as shown in Fig. 6. With increased amounts of SA, the color of the AuNPs solution showed a gradual conversion from red to blue, and consistently the maximum absorption wavelength also migrated from 525 to 675 nm, indicating that more SA protected the 3′-terminal of hairpin DNA probe from degradation by Exo III and not enough single-stranded DNA was generated to resist salt-induced aggregation. These results are in accord with the preconceived principle of the method. By analysis of the alteration in relative absorption ratio A675/A525 with respect to SA amounts, a linear relationship was obtained in the range from 0.5 to 10 pmol. The linear equation was Y = 0.080X + 0.35 with a correlation coefficient of 0.996, where X represented the amounts (pmol) of SA (the inset in Fig. 6B). According to the 3σ rule, the detection limit was estimated to be 0.24 pmol (corresponding to approximately 0.63 nM SA in 375 μL of solution (three-fold dilution of 125 μL)). This sensitivity of protein detection was comparable or higher than some TPSMLD-based and fluorescence-based methods (Table 1). Although more sensitive approaches have been reported, they often required complicated modifications of AuNPs or other material, expensive fluorophore labelling, long-time enzymatic amplification, and special equipment. Our proposed strategy is a simple, cost-effective, and sensitive detection method.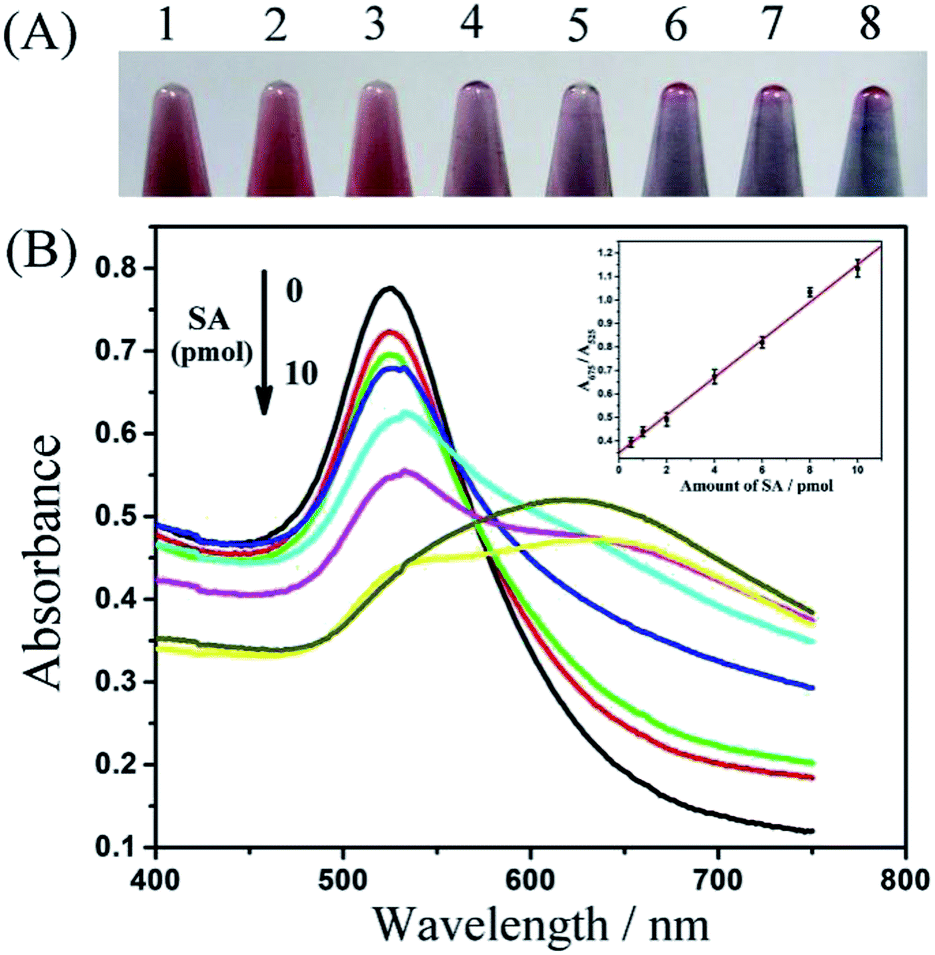 | ||
| Fig. 6 Colorimetric and absorption spectrographic analysis of varying amounts of SA. (A) Different amounts of SA induced various degrees of AuNPs aggregation. 1–8 correspond to 0, 0.5, 1, 2, 4, 6, 8, and 10 pmol SA. (B) Absorption spectra of AuNPs in response to increasing amounts of SA (0–10 pmol). Insert: calibration curves of SA analysis. | ||
Selectivity of the assay
To evaluate specificity of the terminal protection, six other proteins, including trypsin, glucose oxidase, chymotrypsin, pepsin, lysozyme, and human serum albumin (HSA) were examined using the proposed strategy. The maximum amount in the linear range of SA analysis, namely 10 pmol, was utilized to perform the test except with HSA (1 pmol). As shown in colorimetric experiments, the color of AuNPs solution showed blue from the terminal protection of SA, indicating the aggregation of AuNPs. In contrast, after an addition of five other proteins, the AuNPs solution stayed red, revealing the failure of terminal protection (Fig. 7A). To compare the ratio (R) of absorbance at 675 and 525 nm, we set the value of (RSA − Rblank) as 1 and it was found the relative ratio (Rprotein − Rblank) of other proteins was less than 0.1 (Fig. 7B). These results suggested that the proposed strategy showed high selectivity.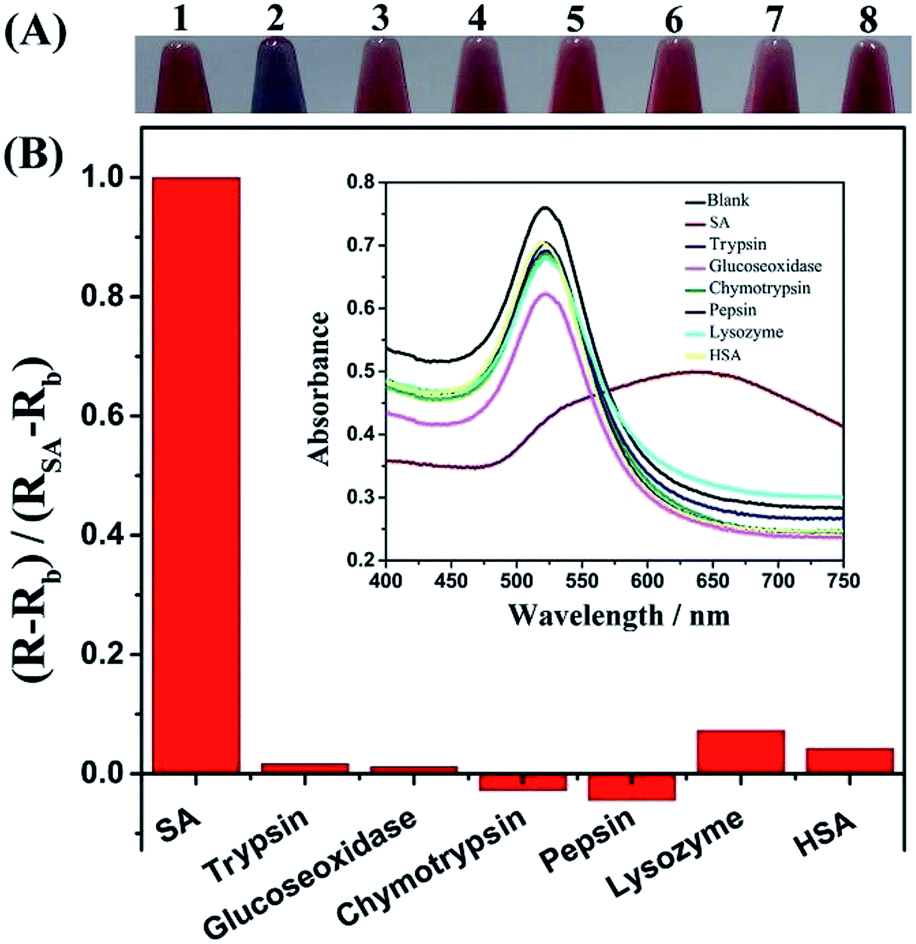 | ||
| Fig. 7 Selectivity of the proposed assay toward SA. (A) Target protein (SA) and other interfering proteins induced different color changes of AuNPs solutions. 1–8 represent blank, SA, trypsin, glucose oxidase, chymotrypsin, pepsin, lysozyme and HSA, respectively. (B) Absorption spectra differentiated SA and other protein. Insert: absorption spectra of AuNPs solution via the pretreatment of SA and other proteins. R − Rb = (A675/A525)protein − (A675/A525)blank, RSA − Rb = (A675/A525)SA − (A675/A525)blank. The amounts of SA and other proteins were 10 pmol except HSA (1 pmol). | ||
To further ascertain the application of the developed method in a complex matrix, a mixture containing 2 pmol of SA, trypsin, glucose oxidase, chymotrypsin, pepsin, lysozyme, and 0.2 pmol of HSA, respectively, was used to quantitatively detect target SA. After spiking 3 or 5 pmol SA into the complex matrix, the results were obtained. The recovery rates were 105.8% and 106.4% at 3 and 5 pmol standard addition, respectively. These results showed that our developed method can be utilized in a complex matrix.
SA detection in serum
The possibility of the proposed colorimetric method being applied to real samples was investigated by detecting SA in human serum. The detection process was the same as in the Tris–HCl buffer and the results are shown in Fig. 8. Absorbance signals produced by the same amount of SA in human serum showed a similar pattern to that produced in Tris–HCl buffer. Thus, the proposed colorimetric method had good compatibility with real biological samples.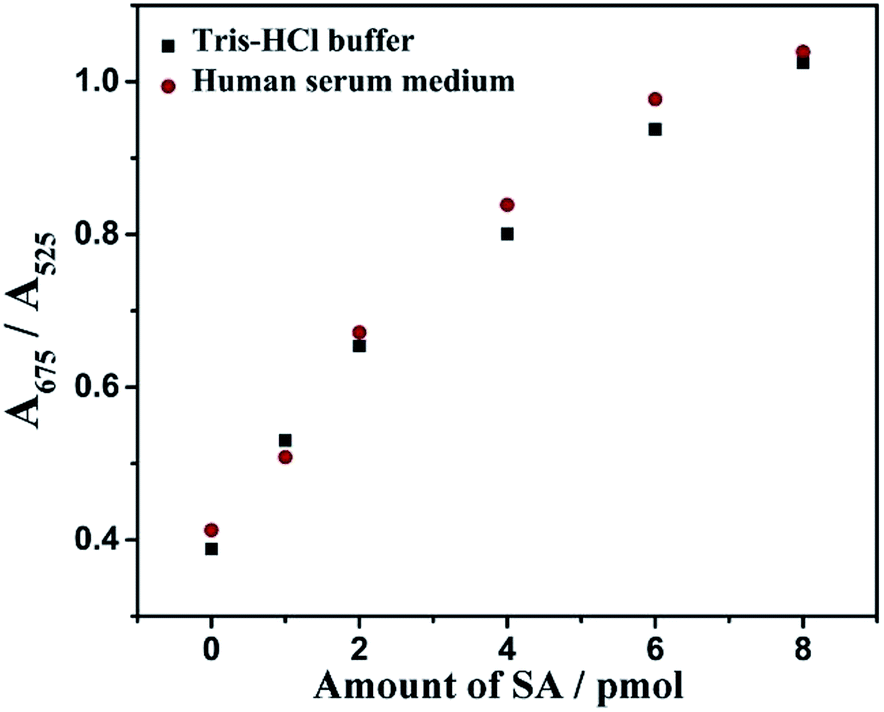 | ||
| Fig. 8 Absorbance ratio assay for SA in human serum. Other conditions are performed according to the experimental procedure described in the Experimental section. | ||
Conclusions
In summary, a novel sensor for proteins was developed by the Exo III-aided terminal protection of small-molecule-linked DNA and an AuNP colorimetric system. The strategy omits the time-consuming modification of AuNP surfaces and avoids enzymatic amplification, and thus saves time and costs. Additionally, it only needs visual inspection or simple analysis by a UV-vis spectrophotometer to detect protein, so it is simple and easy to operate. Moreover, the assay shows excellent resistance to nonspecific proteins, great recovery in a complex matrix, and good compatibility with real biological samples. In view of the above advantages, this novel strategy holds great potential for the detection of proteins for disease diagnosis and therapy.Experimental section
Materials and apparatus
Tetrachloroauric acid (HAuCl4·4H2O) and trisodium citrate were purchased from Sinopharm Chemical Reagent Co. (Shanghai, China). Duplex-specific exonucleases (Exo III) was obtained from New England Biolabs (USA). The biotin-labelled DNA probe sequences was custom synthesized by Shanghai Sangon Biological Engineering Technology and Services Co., Ltd. (Shanghai, China). Streptavidin (SA) and other interfering proteins, including chymotrypsin, glucose oxidase, pepsin, trypsin, and lysozyme, were purchased from Shanghai Sangon Biological Engineering Technology and Services Co., Ltd. (Shanghai, China). HSA and human serum were obtained from Beijing Solarbio Science and Technology Co., Ltd. (Beijing, China). This study was performed in strict accordance with the “Guide to scientific and technological academic standards in colleges and universities” of Hebei University for the use of human subjects (published on May 28, 2015, Baoding, China). There was no ethical conflict throughout the experiment.The biotin-tagged DNA probes were dissolved in sterile water and frozen at −20 °C. Phosphate buffer (PBS, pH = 7.4, 0.1 mol L−1) and Tris–HCl buffer (pH = 7.3, 0.5 mol L−1, MgCl2, 67 mmol L−1) solutions were prepared in our laboratory. All other reagents were of analytical grade and all solutions were prepared using ultrapure water with an electric resistance of 18.2 MΩ.
The reaction for SA detection was performed on a 2720 Thermal Cycler (Applied Biosystems, Thermo Fisher Scientific Inc., USA). The photographs recording colors of AuNPs were obtained with an IXUS 230HS digital camera (Canon, China Co., Ltd.). The UV-Vis adsorption spectra were recorded with a TU-1901 double-beam UV-Visible spectrophotometer (Beijing Purkinje General Instrument Co., Ltd., China). The ratio of absorbance at wavelengths of 525 and 675 nm was calculated to evaluate optimized reaction conditions and the performance of the assay.
The sequence of the biotin-DNA probe was shown as follows:
ssDNA probe (5′ → 3′): TGC CTG GCT CCC TGT ATG CCA ACA GGG AGC CAG GCA-biotin.
Preparation of AuNPs
The gold nanoparticle (AuNP) (∼13 nm in diameter) solution was prepared according to a previously reported method.17 In brief, 4.1 mL of 1% HAuCl4 and 95.9 mL double distilled water were added to a three-necked flask equipped with a condenser and heated to boiling with vigorous stirring. Immediately, 10 mL of sodium citrate (38.8 mM) was added to the boiling solution, accompanying the conversion of its color to pale yellow, and then further to burgundy. Thereafter, the mixed solution was kept boiling for 10 min and then heating was halted. After that, the solution was stirred for another 15 min and cooled to room temperature.Detection of streptavidin (SA) protein based on AuNPs
To employ terminal protection to analyse the SA protein, a biotin-labelled (3′-end) hairpin-structured DNA was used to specifically bind with SA. The reaction was performed by the addition of an optimized amount of hairpin DNA and various concentrations of SA in 50 mM Tris–MgCl2 buffer solution, with the total system of 10 μL, SA being replaced with equal volumes of ultrapure water in the control experiment (blank). All samples were incubated for 30 min at 37 °C to accomplish the combination of SA and biotin. Then, 8 U Exo III was added, and the mixture was incubated for 90 min at 37 °C to digest the hairpin-structured DNA. The digestion reaction was terminated by heating at 85 °C for 20 min. The resultant solution was transferred to 100 μL of AuNPs solution and incubated at room temperature for 10 min to allow complete interaction between ssDNA and AuNPs. Following that, 12.5 μL of 10× PBS (100 mM, 1.5 mol L−1 NaCl) was added to the above mixture and the reaction system increased to 125 μL. After blending the solution well, the color was recorded by a digital camera and the absorption spectra was measured by a UV-Vis spectrophotometer after a three-fold dilution.To evaluate the specificity of terminal protection, other interfering proteins, such as lysozyme, chymotrypsin, pepsin, trypsin, glucose oxidase and HSA, were analyzed under the same conditions as the detection of SA, respectively.
Analysis of recovery in complex matrix
The complex matrix contained 2 pmol of SA, lysozyme, chymotrypsin, pepsin, trypsin, glucose oxidase and 0.2 pmol HSA, respectively, and 80 pmol of biotin-hairpin-DNA was used in 50 mM Tris–MgCl2 buffer solution. Afterwards, 3 or 5 pmol of standard SA were added into the complex matrix to assess recovery in 10 μL of the reaction system. The experimental procedure was the same as with the detection of SA under the optimized conditions.Detection of SA in serum
The reaction was performed by the addition of an optimized amount of hairpin DNA with various concentrations of SA and 1 μL 1% human serum solution in 10 μL of Tris–HCl buffer. SA was replaced with an equal volume of ultrapure water in the control experiment (blank), and other conditions and following processes of the reaction were the same as aforementioned. Finally, the color was recorded by a digital camera and the absorption spectra was measured by a UV-Vis spectrophotometer after a three-fold dilution.Conflicts of interest
There are no conflicts of interest to declare.Acknowledgements
The project is supported by the National Natural Science Foundation of China (21707027), the Natural Science Foundation of Hebei Province (B2016201052), the Natural Science Foundation of Hebei Education Department (QN2017024) and China Postdoctoral Science Foundation (2017M621094).Notes and references
- (a) Y. Tan, Q. Guo, X. Zhao, X. Yang, K. Wang, J. Huang and Y. Zhou, Biosens. Bioelectron., 2014, 51, 255–260 CrossRef CAS PubMed; (b) C. M. Tyrakowski and P. T. Snee, Anal. Chem., 2014, 86, 2380–2386 CrossRef CAS PubMed.
- (a) Y. Q. Lv, Y. T. Qin, F. Svec and T. W. Tan, Biosens. Bioelectron., 2016, 80, 433–441 CrossRef CAS PubMed; (b) J. Verbarg, O. Hadass, P. D. Olivo and A. Danielli, Sens. Actuators, B, 2017, 241, 614–618 CrossRef CAS.
- (a) X. Xiang, J. Shi, F. Huang, M. Zheng, Q. Deng and J. Xu, Biosens. Bioelectron., 2015, 74, 227–232 CrossRef CAS PubMed; (b) Z. Zhang, X. Xia, X. Xiang, F. Huang and L. Han, Sens. Actuators, B, 2017, 249, 8–13 CrossRef CAS; (c) Y. He and B. Jiao, RSC Adv., 2015, 5, 101327–101332 RSC.
- Z. Wu, Z. Zhen, J. H. Jiang, G. L. Shen and R. Q. Yu, J. Am. Chem. Soc., 2009, 131, 12325–12332 CrossRef CAS PubMed.
- Z. Wu, H. Wang, M. Guo, L. J. Tang, R. Q. Yu and J. H. Jiang, Anal. Chem., 2011, 83, 3104–3111 CrossRef CAS PubMed.
- X. F. Wei, L. Y. Zheng, F. Luo, Z. Y. Lin, L. H. Guo, B. Qiu and G. N. Chen, J. Mater. Chem. B, 2013, 1, 1812–1817 RSC.
- (a) X. Gong, W. Zhou, Y. Chai, Y. Xiang and R. Yuan, RSC Adv., 2014, 5, 6100–6105 RSC; (b) L. J. Ou, H. B. Wang and X. Chu, Analyst, 2013, 138, 7218–7223 RSC.
- (a) H. Shi, X. Mao, X. Chen, Z. Wang, K. Wang and X. Zhu, Biosens. Bioelectron., 2017, 91, 136–142 CrossRef CAS PubMed; (b) G. F. Wang, X. P. He, L. Wang and X. J. Zhang, Biosens. Bioelectron., 2013, 42, 337–341 CrossRef CAS PubMed; (c) C. Y. Lee, H. Y. Kim, S. Kim, K. S. Park and H. G. Park, Analyst, 2018, 143, 2023–2028 RSC; (d) W. Wu, W. Pan, D. Yu, Z. Yuan, Y. Qin, Y. Lu, T. Zhang and J. Zhou, Analyst, 2018, 143, 829–832 RSC.
- (a) Y. He, X. J. Xing, H. W. Tang and D. W. Pang, Small, 2013, 9, 2097–2101 CrossRef CAS PubMed; (b) C. H. Chen, X. Xiang, Y. F. Liu, G. H. Zhou, X. H. Ji and Z. K. He, Biosens. Bioelectron., 2014, 58, 205–208 CrossRef CAS PubMed.
- (a) H. B. Wang, H. D. Zhang, S. P. Xu, T. Gan, K. J. Huang and Y. M. Liu, Sens. Actuators, B, 2014, 194, 478–483 CrossRef CAS; (b) Y. Cao, S. Zhu, J. Yu, X. Zhu, Y. Yin and G. Li, Anal. Chem., 2012, 84, 4314–4320 CrossRef CAS PubMed; (c) Y. He and B. Jiao, Microchim. Acta, 2016, 183, 3183–3189 CrossRef CAS.
- J. Zhao, S. S. Hu, X. X. Chen, B. Zhang, K. M. Wang and X. J. Liu, Sens. Actuators, B, 2014, 202, 1243–1247 CrossRef CAS.
- (a) H. Shi, L. Yang, X. Zhou, J. Bai, J. Gao, H. Jia and Q. Li, Microchim. Acta, 2016, 184, 1–7 Search PubMed; (b) C. C. Chang, C. Y. Chen, T. L. Chuang, T. H. Wu, S. C. Wei, H. Liao and C. W. Lin, Biosens. Bioelectron., 2016, 78, 200–205 CrossRef CAS PubMed.
- R. D. Li, B. C. Yin and B. C. Ye, Biosens. Bioelectron., 2016, 86, 1011–1016 CrossRef CAS PubMed.
- (a) N. Ohoka, K. Nagai, T. Hattori, K. Okuhira, N. Shibata, N. Cho and M. Naito, Cell Death Dis., 2014, 5, e1513 CrossRef CAS PubMed; (b) H. Wang and C. Yan, Neoplasia, 2011, 13, 611–619 CrossRef CAS PubMed; (c) H. B. Wang, H. D. Zhang, Y. Chen and Y. M. Liu, Biosens. Bioelectron., 2015, 74, 581–586 CrossRef CAS PubMed.
- Y. Qi and B. Li, Chem.–Eur. J., 2011, 17, 1642–1648 CrossRef CAS PubMed.
- (a) M. Wu, E. Petryayeva and W. R. Algar, Anal. Chem., 2014, 86, 11181–11188 CrossRef CAS PubMed; (b) H. J. Kang, J. H. Kim and S. J. Chung, Biosens. Bioelectron., 2015, 67, 413–418 CrossRef CAS PubMed; (c) Y. He and B. Jiao, Microchim. Acta, 2016, 183, 3303–3309 CrossRef CAS.
- K. C. Grabar, R. G. Freeman, M. B. Hommer and M. J. Natan, Anal. Chem., 1995, 67, 735–743 CrossRef CAS.
| This journal is © The Royal Society of Chemistry 2018 |