 Open Access Article
Polydimethylsiloxane/aluminum oxide composites prepared by spatial confining forced network assembly for heat conduction and dissipation
Wuyan Si†
 a,
Xiaoxiang He†
 *a,
Yao Huang
 a,
Xiaolong Gao
 *a,
Xiuting Zheng
 b,
Xupeng Zheng
 a,
Chong Leng
 a,
Fengchun Su
 a and
Daming Wu
 *ac
*ac
aCollege of Mechanical and Electrical Engineering, Beijing University of Chemical Technology, Beijing 100029, China. E-mail: heshosha@163.com; gao-xl@qq.com; wudaming@vip.163.com
bPolymer Material Processing Equipment Engineering Research Center of the Ministry of Education, Beijing 100029, China
cState Key Laboratory of Organic–Inorganic Composites, Beijing University of Chemical Technology, Beijing 100029, China
First published on 23rd October 2018
Abstract
Constructing a compacted network in polymer matrices is an important method to improve the thermal conductivity (TC) of polymer composites. In this paper, a compacted network was built using the Spatial Confining Forced Network Assembly (SCFNA) method. The homogeneous compound of polymer and fillers, prepared using a conical twin-screw mixer, was placed in a compression mold with confining space to carry out two-stage compression, free compression and spatial confining compression. Aluminum oxide (Al2O3) was studied as filler in a polydimethylsiloxane (PDMS) matrix to illustrate the applicability of the SCFNA method. The polymer composites with an Al2O3 filler ranging from 10 to 80 wt% were prepared. When the filler content was 80 wt%, the TC of the PDMS/Al2O3 composites prepared using the SCFNA method increased by 16.35 times in comparison to the TC of pure PDMS. Observing the SEM of PDMS/Al2O3 composites with various thicknesses, the gap between fillers decreased with a decrease in thickness. The composite with TC up to 2.566 W (mK)−1 obtained at 80 wt% filler was further employed as a heat spreader, causing a decrease of about 8.23 °C in the set-point compared with the temperature of the heat source.
Introduction
Due to the demands of denser and faster circuits in electronic packaging, thermally conductive and electrically insulating composites have attracted great attention in the thermal management field.1–4 Heat accumulated in electronic devices can lead to low service life and operation efficiency of electronic systems because the reliability of a device depends on the operating temperature of the junction.5 Polymers have often been used as electronic packaging and substrate materials due to their low dielectric constant and excellent processing ability.2,6 However, most polymers are thermal insulators, and introducing ceramic particles with high thermal conductivity (TC) into polymer matrices is an efficient method to improve the TC of polymer composites.Up to now, ceramic fillers, such as aluminum oxide (Al2O3),7,8 silicon nitride (Si3N4),9,10 aluminum nitride (AlN)11 and boron nitride (BN),12–15 were used frequently as the thermal conductive materials embedded in a polymer matrix. For example, Al2O3, Si3N4, BN and AIN were employed into epoxy resin to improve TC, and the TCs of composites were up to ∼3.6, 3.89, 4.42 and 3.39 W (mK)−1, respectively.7,9,16,17 Although the TCs of polymer composite has been improved greatly, much higher than the TC of epoxy (0.23 W (mK)−1), TCs of polymer composites are still much lower than that of bulk ceramics, such as Al2O3 (30 W (mK)−1), Si3N4 (16.7 W (mK)−1), BN (600 W (mK)−1) and AlN (320 W (mK)−1). One reason is that the ceramic particles are isolated in the polymer matrix, causing no network formed. In order to further enhance the TC, researchers have tried to use ceramic fillers by dispersing high loading because the fillers can contact with each other to build a thermally conductive network (TCN). However, the mechanical properties of composite with a high filler content will be deteriorated, such as susceptible to thermal cracking and challenging to process.7 Other reason is due to the interface thermal resistance among fillers. The TC of interface resistance formed between neighboring fillers is much lower than that of bulk particles because of the phonon scattering at filler–filler contacts within the network. Until to now, the covalent and noncovalent functionalization methods have been developed to modify the fillers to improve the TC of polymer composite via suppressing the interfacial thermal resistance.18 For example, an enhancement by 15.5% (from 1.037 to 1.198 W (mK)−1) in TC of h-BN/epoxy resin composite by surface modification of h-BN particle was reported in.19 Meanwhile, Zhou's group20 also reported an enhancement by 32% (from 1.03 to 1.36 W (mK)−1) in TC of aluminum/epoxy resin composite because of surface modification of aluminum particle. The improvement of TC after interface treatment seems acceptable, but the final result of TC is not large enough when comparing with that of fillers themselves. Besides, there are some disadvantages in both two methods. For example, the disadvantage of the covalent functionalization method is that it destroys part of the intrinsic structure of fillers and reduces the intrinsic thermal transport properties of fillers, and the disadvantage of the noncovalent functionalization method is the necessity to introduce other components, like surfactants, on fillers.21 There is other factor, such as the gap among fillers, which has been verified to be important in improving TC and electrical conductivity of polymer composites via 1D filler (i.e., short carbon fiber) by Spatial Confining Forced Network Assembly (SCFNA) method because the polymer was extruded out after compression in a confining space.22–24
In order to verify the viability of SCFNA method further, the 3D filler (i.e., Al2O3) was employed as a thermally conductive and electrical insulating filler and PDMS was employed to fabricate a thermally conductive composite due to its good flexibility and excellent electrical insulation properties by SCFNA method. The results showed that TC of sample with filler content of 80 wt% by SCFNA method was 16.35 times higher than that of pure PDMS and 8.03 times higher than that of sample by traditional compounding method. A testing device was set up to analyze the ability of heat conduction and dissipation of PDMS/Al2O3 composites.
The theory of SCFNA method
There are three steps in SCFNA method. Firstly, a homogeneous compound was obtained by melt compounding or solution mixing. Secondly, the homogeneous compound was compressed in a confining space to initiate and finish the network by self-assembly mechanism. Thirdly, the samples with self-assembly network were further compressed to a thickness less than characteristic thickness in the confining space and samples with compacted network were achieved. The basic theory of SCFNA method is to introduce a mechanical delivered additional interaction to carry out a forced assembly network after a self-assembled network was built.23 The technological pathway of SCFNA method was shown in Fig. 1.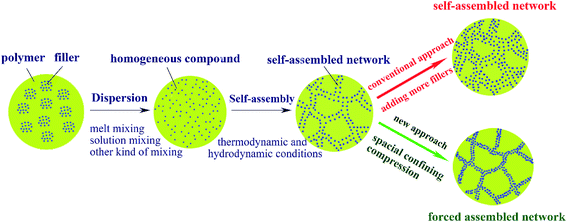 | ||
| Fig. 1 Scheme of technological pathway of SCFNA method and conventional compounding.22,23 | ||
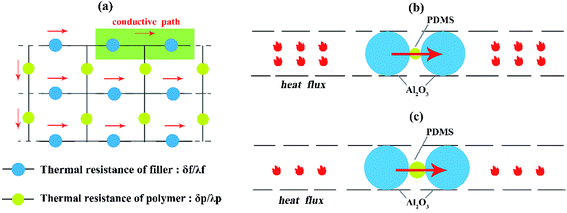
For a given TCN, much heat flux flows along thermally conductive path in the whole thermally conductive network, as shown in Fig. 2a. Heat flux in any conductive path, consisting of two fillers, can be calculated with the following equation:
 | (1) |
![[R with combining macron]](https://www.rsc.org/images/entities/i_char_0052_0304.gif) is the average thermal resistance.
is the average thermal resistance.
In general, δf/λf is much less than δp/λp (i.e., the thermal resistance of polymer is much greater than that of fillers by more than 2 orders of magnitude). The heat flux of conductive path mainly depends on the thermal resistance of polymer. As a result, eqn (1) can be changed into eqn (2), as shown below.
 | (2) |
It is obvious that the average thermal resistance mainly depends on the gap (δp) between two fillers. When the gap (δp) decreases, the thermal resistance decreases, then the heat flux increases. Fig. 2b shows that the gap (δp) between two fillers is decreased by SCFNA method because the polymer is extruded out within the confining space after forced compression. However, the gap between two fillers cannot be decreased sharply only by adding more fillers, as shown in Fig. 2c.
Experimental
Materials and equipment
PDMS (Sylgard 184 Silicone Elastomer, Dow Corning Corp, USA) was purchased as two-part liquid component kits, i.e., based polymer (Kit A) and curing agent (Kit B). Kit A and Kit B were mixed at a weight ratio of 10![[thin space (1/6-em)]](https://www.rsc.org/images/entities/char_2009.gif) :
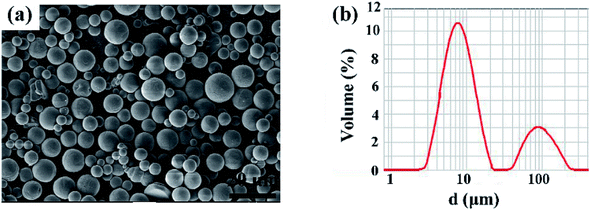
:![[thin space (1/6-em)]](https://www.rsc.org/images/entities/char_2009.gif) 1. Its density is 1.030 g cm−3 (cured), and its curing temperature is ranging from 25 to 150 °C. Al2O3 of 3.8 g cm−3 in density was provided by Guangzhou Dinghua nano-material Co. Ltd, China. The morphology and particle size analysis of Al2O3 spheres are shown in Fig. 3 and the average diameter is about 5.5 μm. A stirrer (provided by Shanghai Hc Mechanical Equipment Co. Ltd) was used to prepare PDMS/Al2O3 compound. The experimental hot embossing device22–26 was used to prepare composites.
1. Its density is 1.030 g cm−3 (cured), and its curing temperature is ranging from 25 to 150 °C. Al2O3 of 3.8 g cm−3 in density was provided by Guangzhou Dinghua nano-material Co. Ltd, China. The morphology and particle size analysis of Al2O3 spheres are shown in Fig. 3 and the average diameter is about 5.5 μm. A stirrer (provided by Shanghai Hc Mechanical Equipment Co. Ltd) was used to prepare PDMS/Al2O3 compound. The experimental hot embossing device22–26 was used to prepare composites.
Preparation of composite samples
There are three steps for preparing PDMS/Al2O3 composites.(1) PDMS and Al2O3 of 10, 30, 50, 70 and 80 in mass fraction were stirred at the rotational speed of 50 rpm for 30 min at 25 °C by stirrer. Then, the homogeneously dispersed mixture was put into the vacuum pump for 30 min to remove the air bubbles from mixture.
(2) In the first stage, the homogeneously dispersed mixture was put into a confining space of mold and compressed to a thickness of 2 mm. It stayed for 60 seconds to complete self-assembled network before the second stage.
(3) In the second stage, the mixture with 10, 50 and 80 wt% Al2O3 was further compressed from a thickness of 2 mm to a finial thickness of 0.15, 0.2, 0.3 and 0.4 mm, respectively. The mixture with 30 and 70 wt% Al2O3 was compressed from a thickness of 2 mm to a finial thickness of 0.05, 0.15, 0.2, 0.3, 0.4, 0.6, 0.8, 1.0 and 1.4 mm, respectively. Finally, the mixture was heated to cure at 120 °C for 30 min to obtain specimens for testing.
Material characterizations
A Hitachi JSM-7800F scanning electron microscopy (SEM) and a XJ-55C trinocular transflective metallographic microscope (provided by Shanghai Puzhe Photoelectric Instrument Co. Ltd) were used to study the dispersion and location of Al2O3 in PDMS.The TC of composite was calculated by the eqn (3).
| λ = αCpρ | (3) |
Results and discussions
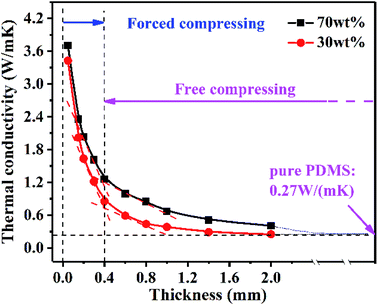
Table 1 shows the TC of the composites with 10, 30, 50, 70 and 80 wt% Al2O3 by SCFNA method. The TC of provided neat PDMS was 0.27 W (mK)−1. In order to make a comparison of the effect between self-assembly network and forced assembly network on TC of composites, the samples with a thickness of 2.0 mm finished in the first stage were taken as the polymeric composites prepared by traditional compounding method. Fig. 4 showed the relationship between TC and thickness of samples when the filler content was 30 and 70 wt%. As shown in Fig. 4, the TCs of composites with filler content of 30 and 70 wt% increased slowly when the further compression thickness was higher than ∼0.4 mm, while it increased sharply when the further compression thickness was less than ∼0.4 mm. This result was almost like the result in the paper and the thickness of ∼0.4 mm can be still called the characteristic thickness.24| Sample | Thermal conductivities | |||
|---|---|---|---|---|
| Filler contents (wt%) | Thickness (mm) | λs (W (mK)−1) | λc (W (mK)−1) | λs/λc |
| 10 | 0.15 | 2.005 | 0.234 | 8.568 |
| 0.20 | 1.518 | 6.487 | ||
| 0.30 | 1.109 | 4.739 | ||
| 0.40 | 0.826 | 3.530 | ||
| 30 | 0.05 | 3.425 | 0.252 | 13.595 |
| 0.15 | 2.017 | 8.004 | ||
| 0.20 | 1.632 | 6.476 | ||
| 0.30 | 1.214 | 4.817 | ||
| 0.40 | 0.853 | 3.385 | ||
| 0.60 | 0.589 | 2.337 | ||
| 0.80 | 0.435 | 1.726 | ||
| 1.00 | 0.383 | 1.520 | ||
| 1.40 | 0.288 | 1.143 | ||
| 50 | 0.15 | 2.018 | 0.328 | 6.152 |
| 0.20 | 1.761 | 5.369 | ||
| 0.30 | 1.260 | 3.841 | ||
| 0.40 | 0.877 | 2.674 | ||
| 70 | 0.05 | 3.700 | 0.408 | 9.069 |
| 0.15 | 2.351 | 5.762 | ||
| 0.20 | 2.030 | 4.975 | ||
| 0.30 | 1.609 | 3.944 | ||
| 0.40 | 1.261 | 3.091 | ||
| 0.60 | 0.988 | 2.422 | ||
| 0.80 | 0.846 | 2.074 | ||
| 1.00 | 0.668 | 1.637 | ||
| 1.40 | 0.509 | 1.248 | ||
| 80 | 0.05 | 4.414 | 0.550 | 8.025 |
| 0.15 | 2.566 | 4.665 | ||
| 0.20 | 2.197 | 3.995 | ||
| 0.30 | 1.942 | 3.531 | ||
| 0.40 | 1.577 | 2.867 | ||
The relationship between the filler content and TC of samples prepared by SCFNA was shown in Fig. 5. It showed that TC of the samples increased sharply when filler content increased from 0 to 10 wt%, and then TC of samples increased steadily when filler content was increasing from 10 to 50 wt%. After that, the TC of samples increased sharply again when filler content increased from 50 to 80 wt%. For example, for the sample with thickness of 0.15 mm, the TC of sample with the content of 10 wt% increased about 7.43 times compared with pure PDMS, and then TC increased steadily only from 2.005 to 2.019 W (mK)−1. After that, TC increased from 2.019 to 2.566 W (mK)−1, causing an enhancement of 1.27 times. TCs of samples with other thickness have the similar pattern like that of samples with thickness of 0.15 mm. However, the TC of samples prepared by compounding method increasing slowly, only from 0.27 to 0.55 W (mK)−1. The effect of thickness on the TC of PDMS/Al2O3 composites by SCFNA method was shown in Fig. 6. The TC of samples increase with the decreasing in thickness. For example, the TC with filler content of 30 wt% was enhanced by 2.36 times when thickness was decreased from 0.4 to 0.15 mm.
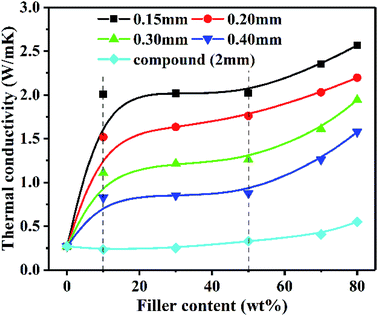 | ||
| Fig. 5 Comparison of thermal conductivities of PDMS/Al2O3 composites by SCFNA and compounding method. | ||
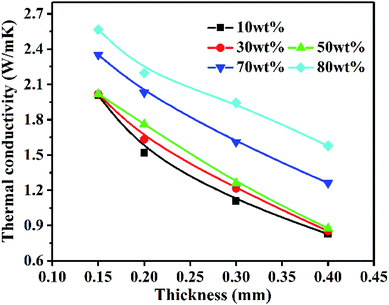 | ||
| Fig. 6 The effect of thickness on the thermal conductivity of PDMS/Al2O3 composites by SCFNA method. | ||
Table 2 presents the obtained TC of the composites filled with Al2O3 obtained from other literature. Compared the TC in this paper with TC of other studies, the fabricated composites in our works display a relatively higher TC at the same filler content, and display almost the same TC with a lower filler content
Heat conduction and dissipation of PDMS/Al2O3 composites in heat spreaders was examined by recording the temperature variations in the center of heat source. The heat dissipation performance was evaluated on all samples with diameter of 40 mm, heated in a heat source with 5 mm in diameter. The testing temperature is approx. 28 °C. The samples with filler content of 10, 50 and 80 wt% were separately connected to the same heater for 300 s, which guaranteed the set-point temperature reached a saturation state for comparison. The set-point position was in the center of the heater because this was typically the highest temperature and the crucial point that affected the performance and life time of electric device, like LED. As shown in Fig. 7a, the set-point temperature of composites with higher filler content exhibited a lower temperature over time. The set-point temperature was approx. 188.28, 184.65 and 181.3 °C in the composite with filler content of 10, 50 and 80 wt% after heating for 300 s, respectively. These temperatures of decreased by 1.25, 4.88 and 8.23 °C comparing with temperature of heat source (189.53 °C), were shown in Fig. 7b.
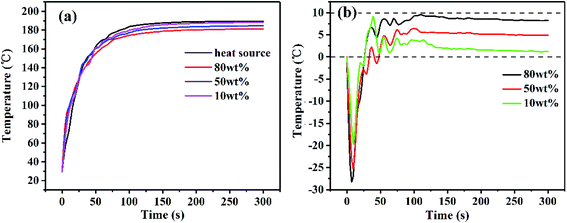 | ||
| Fig. 7 (a) The center temperature of samples with different filler content at room temperature of 28 °C; (b) center temperature difference of composites with different filler content. | ||
As shown in Fig. 4–6, there are two factors to influence the TC of PDMS composites: the filler content and the thickness of samples prepared by SCFNA method. The TC of composites increases with the filler content due to the better formation of conductive network with higher filler content. The TC of samples increases when decreasing in thickness due to a compacted network was built. Morphology evolution of Al2O3 in-plane and through-plane of composite was observed to explain the effect of compacted network on TC of composite further.
Fig. 8 displays the morphology evolution of Al2O3 in-plane of composite with different thickness when filler content is 30 wt%. As shown in Fig. 8, Al2O3 formed continuous network in PDMS matrix when thickness decreasing from 0.4 mm to 0.05 mm. However, a more compacted network was formed only when the thickness of samples decreased. For example, the network formed when thickness is 0.05 mm is more compacted than the network formed when thickness is 0.4 mm. The morphology evolution of Al2O3 through-plane of composites with different thickness when filler content was 30 wt% was observed to further explain that a compact network could be formed when the thickness decreasing.
 | ||
| Fig. 8 Morphology evolution in-plane of PDMS/Al2O3 (30 wt%) composites versus thickness: (a) thickness = 0.40 mm; (b) thickness = 0.15 mm; (c) thickness = 0.05 mm. | ||
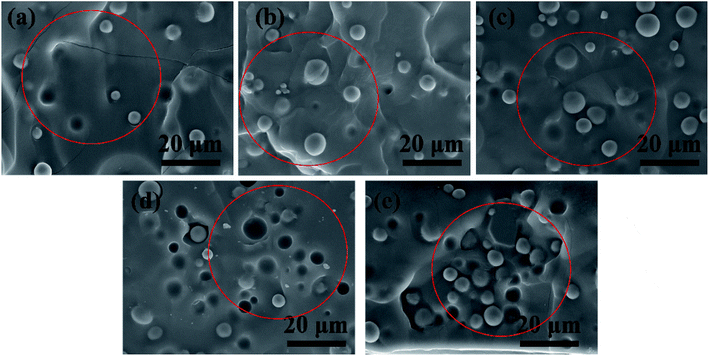
Fig. 9 showed the morphology evolution of Al2O3 through-plane of composites with different thickness when filler content was 30 wt% (10.4 vol%). As shown in Fig. 9a–e, Al2O3 aggregated step by step after compressed by SCFNA method, and the sample with a thickness of 0.05 mm showed the most compacted TCN than others. The average gap between Al2O3 was 13.82 μm (σ = 4.87 μm), 8.72 μm (σ = 3.64 μm), 5.65 μm (σ = 3.09 μm), 3.35 μm (σ = 2.09 μm) and 1.06 μm (σ = 0.47 μm) when the thickness was 0.4, 0.3, 0.2, 0.15 and 0.05 mm, respectively. The average gap among Al2O3 and standard deviation were calculated according to eqn (4) and (5).
 | (4) |
 | (5) |
![[x with combining macron]](https://www.rsc.org/images/entities/i_char_0078_0304.gif) is the average gap among Al2O3, xi is the distance between any two Al2O3 in the red circle region, σ is the standard deviation.
is the average gap among Al2O3, xi is the distance between any two Al2O3 in the red circle region, σ is the standard deviation.
Besides, the volume fraction of Al2O3 in the TCN of PDMS/Al2O3 composites was calculated after compressed in confining space according to the SEM. The volume fraction of Al2O3 was calculated by eqn (6).
 | (6) |
The calculated volume fraction of Al2O3 was 10.6%, 11.66%, 18.02%, 20.14% and 23.32%, and almost all the calculated volume fraction was higher than the original volume fraction 10.4 vol% of Al2O3. That means, the Al2O3 agglomerates to form a more and more compacted network with decrease of thickness of samples.
The compacted network built can be explained below. When the thickness of composites is larger than characteristic thickness, which is called free compression, it could only cause the self-assembly network wiggling in polymer matrix without densification of the network threads, and the gap between fillers cannot be decreased largely, as shown in Fig. 10a. While when the thickness is less than characteristic thickness, a noteworthy densification of the network threads could come into by spatial confining compression. Due to the restriction of wiggling freedom of the network and the prevention of aggregate force between granules from falling apart, the filler at the threads will tend to get closer and extra polymer between the filler granules will be squeezed out in spatial confining compression process. The smaller thickness of samples means more extra polymer will be squeezed out, the gap between fillers becomes smaller, as shown in Fig. 10b. The mechanism of forced assembly can be explained as follows. In spatial confining compressing process, characterized by a thickness of sample below characteristic thickness, the compression force could be transmitted to the granules to break the balance of self-assembly network. The granules under compression tend to get much closer until a new balance was established. In this way, the self-assembly network was converted to a forced-assembly network with enhanced TC. This method can improve the polymer composite with high thermal conductivity, which provides the possibility to replace thermally conductive materials such as metal with polymeric composites.
Conclusions
In this paper, polymeric composites with high thermal conductivity were prepared by a SCFNA method. The main mechanism of SCFNA method can be explained that the external load applied on the composites with self-assembly network in a confining space induces the extra polymers extruded between fillers to form a compact thermally conductive network. The thermal conductivity of composites was improved because the densification network decreased the gap among fillers. The SEMs showed that a compact thermally conductive network could be obtained by SCFNA method. PDMS/Al2O3 composites with 10 to 80 wt% Al2O3 were prepared by SCFNA method. When the filler content was 80 wt%, the thermal conductivity obtained by SCFNA method was improved by 16.35 times than pure PDMS. Produced PDMS/Al2O3 composite with filler content of 80 wt% was used for heat spreader for heat source, resulting in a significant decrease by about 8.23 °C in the set-point and the saturation temperatures and showing sufficient heat dissipation efficiency.Conflicts of interest
There are no conflicts to declare.Acknowledgements
This work was supported by the National Nature Science Foundation of China (Grant No. 51673020) and by the Fundamental Research Funds for the Central Universities (Grant No. ZY1812, JD1810).References
- H. Im and J. Kim, Enhancement of the thermal conductivity of aluminum oxide-epoxy terminated poly(dimethyl siloxane) with a metal oxide containing polysiloxane, J. Mater. Sci., 2011, 46, 6571–6580 CrossRef CAS.
- S. Choi and J. Kim, Thermal conductivity of epoxy composites with a binary-particle system of aluminum oxide and aluminum nitride fillers, Composites, Part B, 2013, 51, 140–147 CrossRef CAS.
- Z. Zhu, P. Wang and P. Lv, Densely packed polymer/boron nitride composite for superior anisotropic thermal conductivity, Polym. Compos., 2017, 39, E1653–E1658 CrossRef.
- T. L. Li and S. L. C. Hsu, Enhanced thermal conductivity of polyimide films via a hybrid of micro-and nano-sized boron nitride, J. Phys. Chem. B, 2010, 114, 6825–6829 CrossRef CAS PubMed.
- Y. Chen, X. Gao and J. Wang, Properties and application of polyimide-based composites by blending surface functionalized boron nitride nanoplates, J. Appl. Polym. Sci., 2015, 132 DOI:10.1002/app.41889.
- X. Q. You, N. Chen and G. P. Du, Constructing three-dimensionally interwoven structures for ceramic/polymer composites to exhibit colossal dielectric constant and high mechanical strength: CaCu3Ti4O12/epoxy as an example, Composites, Part A, 2018, 105, 214–222 CrossRef CAS.
- Y. Hu and G. Du, A novel approach for Al2O3/epoxy composites with high strength and thermal conductivity, Compos. Sci. Technol., 2016, 124, 36–43 CrossRef CAS.
- Y. Yao, X. Zeng and K. Guo, The effect of interfacial state on the thermal conductivity of functionalized Al2O3 filled glass fibers reinforced polymer composites, Composites, Part A, 2015, 69, 49–55 CrossRef CAS.
- L. Yin, X. Zhou and J. Yu, Fabrication of a polymer composite with high thermal conductivity based on sintered silicon nitride foam, Composites, Part A, 2016, 90, 626–632 CrossRef CAS.
- H. He, R. Fu and Y. Han, Thermal conductivity of ceramic particle filled polymer composites and theoretical predictions, J. Mater. Sci., 2007, 42, 6749–6754 CrossRef CAS.
- D. Thi My Linh, C. Y. Kim and Y. Zhang, Enhanced thermal conductivity of polymer composites via hybrid fillers of anisotropic aluminum nitride whiskers and isotropic spheres, Composites, Part B, 2017, 114, 237–246 CrossRef.
- S. L. Zhong, Z. Y. Zhou and K. Zhang, Formation of thermally conductive networks in isotactic polypropylene/hexagonal boron nitride composites via “Bridge Effect” of multi-wall carbon nanotubes and graphene nanoplatelets, RSC Adv., 2016, 6, 98571–98580 RSC.
- M. Wang, Z. Jiao and Y. Chen, Enhanced thermal conductivity of poly(vinylidene fluoride)/boron nitride nanosheet composites at low filler content, Composites, Part A, 2018, 109, 321–329 CrossRef CAS.
- D. S. Muratov, D. V. Kuznetsov and Y. Chen, Thermal conductivity of polypropylene composites filled with silane-modified hexagonal BN, Compos. Sci. Technol., 2015, 111, 40–43 CrossRef CAS.
- X. Wang and P. Wu, Preparation of highly thermally conductive polymer composite at low filler content via a self-assembly process between polystyrene microspheres and boron nitride nanosheets, ACS Appl. Mater. Interfaces, 2017, 9, 19934–19944 CrossRef CAS PubMed.
- J. Hu, Y. Huang and Y. Yao, Polymer composite with improved thermal conductivity by constructing a Hierarchically ordered three-dimensional interconnected network of BN, ACS Appl. Mater. Interfaces, 2017, 9, 13544–13553 CrossRef CAS PubMed.
- E. S. Lee, S. M. Lee and D. J. Shanefield, Enhanced thermal conductivity of polymer matrix composite via high solids loading of aluminum nitride in epoxy resin, J. Am. Ceram. Soc., 2008, 91, 1169–1174 CrossRef CAS.
- C. S. Wu and H. T. Liao, Study on the preparation and characterization of biodegradable polylactide/multi-walled carbon nanotubes nanocomposites, Polymer, 2007, 48, 4449–4458 CrossRef CAS.
- Y. Jiang, X. Shi and Y. Feng, Enhanced thermal conductivity and ideal dielectric properties of epoxy composites containing polymer modified hexagonal boron nitride, Composites, Part A, 2018, 107, 657–664 CrossRef CAS.
- W. Zhou, Effect of coupling agents on the thermal conductivity of aluminum particle/epoxy resin composites, J. Mater. Sci., 2011, 46, 3883–3889 CrossRef CAS.
- P. Zhang, J. Zeng and S. Zhai, Thermal properties of graphene filled polymer composite thermal interface materials, Macromol. Mater. Eng., 2017, 302 DOI:10.1002/mame.201700068.
- X. Gao, Y. Huang and Y. Liu, Improved electrical conductivity of PDMS/SCF composite sheets with bolting cloth prepared by a spatial confining forced network assembly method, RSC Adv., 2017, 7, 14761–14768 RSC.
- D. Wu, X. Gao and D. Wu, Spatial confining forced network assembly for preparation of high-performance conductive polymeric composites, Composites, Part A, 2017, 102, 88–95 CrossRef CAS.
- X. He, Y. Huang and Y. Liu, Improved thermal conductivity of polydimethylsiloxane/short carbon fiber composites prepared by spatial confining forced network assembly, J. Mater. Sci., 2018, 53, 14299–14310 CrossRef CAS.
- D. Wu, J. Sun and Y. Liu, Rapid Fabrication of microstructure on PMMA substrate by the plate to plate transition-spanning isothermal hot embossing method nearby glass transition temperature, Polym. Eng. Sci., 2017, 57, 268–274 CrossRef CAS.
- J. Sun, D. Wu and Y. Liu, Numerical simulation and experimental study of filling process of micro prism by isothermal hot embossing in solid-like state, Adv. Polym. Technol., 2017, 37, 1581–1591 CrossRef.
- M. Kozako, Y. Okazaki and M. Hikita, Preparation and evaluation of epoxy composite insulating materials toward high thermal conductivity, Proceeding of the 2010 IEEE International Conference on Solid Dielectrics, 2010, DOI:10.1109/ICSD.2010.5568250.
- H. S. Ju, D. H. Im and S. D. Park, Thermal conductivity of Al2O3/poly(vinyl butyral) composites, Jpn. J. Appl. Phys., 2012, 51 DOI:10.1143/JJAP.51.09ML01.
Footnote |
| † The first two authors contributed equally to this paper and should be considered co-first authors. |
| This journal is © The Royal Society of Chemistry 2018 |

