
 Open Access Article
 This Open Access Article is licensed under a Creative Commons Attribution-Non Commercial 3.0 Unported Licence
Convenient and sensitive colorimetric detection of melamine in dairy products based on Cu(II)-H2O2-3,3′,5,5′-tetramethylbenzidine system†
Xue Han,
Zhixin Qin,
Mengyao Zhao,
Jiajia Song,
Fei Qu ,
Fengli Qu and
Rong-Mei Kong*
,
Fengli Qu and
Rong-Mei Kong*
College of Chemistry and Chemical Engineering, Qufu Normal University, Qufu, Shandong 273165, P. R. China. E-mail: kongrongmei@126.com
First published on 11th October 2018
Abstract
The illegal adulteration of melamine in dairy products for false protein content increase is a strong hazard to human health. Herein, a simple and sensitive colorimetric method was developed for the quantification of melamine in dairy products based on a Cu2+-hydrogen peroxide (H2O2)-3,3′,5,5′-tetramethylbenzidine (TMB) system. In this strategy, Cu2+ exhibits peroxidase-like activity and can catalyze the oxidation of TMB to oxidized TMB (oxTMB) in the presence of H2O2 with a blue colour change of the solution. However, the presence of melamine quickly interacts with H2O2 leading to the consumption of H2O2 and thus strongly hinders the oxidation of TMB. Under the optimal conditions, the absorbance change of oxTMB has a linear response to the concentration of melamine from 1 to 100 μM with a detection limit of 0.5 μM for melamine. The proposed method has many merits including more simplicity, good selectivity, and more cost-effectiveness without using any nanomaterials. The method was further successfully applied to detect melamine in dairy products including milk and infant formula powder.
1 Introduction
Melamine (C3H6N6), as a well-known industrial chemical product has been widely used in the synthesis of melamine formaldehyde resins for manufacturing laminates, plastics, commercial filters, dishware and so on.1 Since the classical Kjeldahl protein analysis method cannot avoid the interference of nonprotein nitrogen (NPN) reagent, melamine has been used to illegally adulterate dairy products for the purpose of inflating the apparent protein level due to its high nitrogen content (66%).2,3 However, the consumption of dairy products contaminated with melamine can lead to urinary system damage, urinary calculi, acute renal failure, bladder cancer, and even infant death,4 because of the precipitation of insoluble melamine cyanurate through a reaction of melamine and its hydrolyzate cyanuric acid.5 Considering its adverse effects, the U.S. Food and Drug Administration (FDA) strictly stipulated the limit dosage of melamine which is 1 ppm (8.0 μM) for infant milk and 2.5 ppm (20 μM) for other dairy products.6,7 Therefore, it is highly desirable to develop facile and reliable methods for the quantificational detection of melamine in dairy products.Up to now, some efficient and selective detection methods have been implemented to detect melamine such as high performance liquid chromatography (HPLC),8 gas chromatography/mass spectroscopy (GC/MS),9 liquid chromatography/mass spectrometry (LC/MS),10 capillary electrophoresis (CE),11 surface-enhanced Raman scattering (SERS),12,13 and enzyme-linked immune sorbent assay (ELISA).14 However, these traditional instrumental analysis measurements always require expensive instruments and complicated sample preparation, which greatly limit their applications for routine melamine detection. In recent years, the determination of melamine based on electrochemical,3,15,16 fluorescent17–23 and colorimetric assays24–29 have attracted increasing attention from researchers. Although many of the above methods were well-established without a complicated pretreatment process and instrumentation during the assay operations, the disadvantages such as time-consuming, sophisticated experimental design and operation involved may also limit their practical applications. Particularly with the development of nanoscience and nanotechnology, various kinds of nanomaterials have been applied for the determination of melamine due to their unique properties such as fluorescence performance. For instance, Wang et al. designed and developed an abasic-site-containing triplex molecular beacon (tMB) for sensitive recognition of melamine by integrating tMBs and fluorescent silver nanoclusters.18 Tang et al. established a sensitive “turn-on” fluorescent sensor for melamine based on FRET effect between polydopamine-glutathione nanoparticles and Ag nanoparticles.22 However, the nanomaterial based methods are usually complicated and costly due to the time-consuming synthesis procedure and the complex modification process. Therefore, it is necessary to explore cost effective, facile and reliable sensing strategy for melamine detection using generic laboratory equipment.
Alternatively, chemistry reaction based biological sensing system has gained growing popularity on account of the controllability and flexibility for manipulating the detection performance with high selectivity and speediness.30 Three typical chemical reactions including “click chemistry” reaction, Michael reaction and Fenton reaction are usually applied for building excellent sensing platform especially for the effective signal translation and amplification.31–34 Among them, Fenton reaction as an inorganic reaction, has attracted significant interest due to its unique characteristic of simplicity, rapidness and convenience.33,35–37 Among various Fenton reaction based methods for bioanalysis, colorimetric assay that only utilized the oxidation of the hydroxyl radicals (·OH) produced by the Fenton reaction, has attracted significant interest due to its rapidness, obvious colour change, no need to use expensive analytical instruments and simple readout with the naked eye. The reaction between 3,3′,5,5′-tetramethylbenzidine (TMB) and hydrogen peroxide (H2O2) was one of the most widely used colorimetric reactions for the detection of various targets including glucose,38–40 histidine and cysteine,41 cholesterol,42 Cu2+,33,43 UA,44,45 glyphosate,46 and cancer cells.47 The catalysts of these TMB-H2O2 based colorimetric assays can be classified into four kinds, including horseradish peroxidase (HRP), HRP-mimic DNAzyme, nanomaterial and metal ions. Compared with the other three catalysts, metal ions such as Cu2+ catalytic H2O2-TMB system not only exhibits high sensitivity, but also possesses some unique advantages including convenience, high stability, low cost and Cu2+ can be used directly in the TMB-H2O2 reaction.45,46
Considering the fact that melamine can quickly interact with H2O2 producing the addition compound of C3H6N6·H2O2 which is stable even under 100 °C according to the thermal analysis results,48 the determination of melamine based on the consumption of H2O2 in H2O2 related reaction have been reported.28,49 Inspired by the above reports, herein, we explored a new simple Cu2+-H2O2-TMB system based colorimetric method for the detection of melamine without any modification or preparation of nanomaterials. In this method, Cu2+ can catalyse the oxidation of TMB to oxidized TMB (oxTMB) with the colour changing from colourless to blue in the presence of H2O2 due to the generation of ·OH by the Cu2+-based Fenton reaction. However, the presence of melamine quickly interacts with H2O2 to form stable C3H6N6·H2O2 complex, resulting the consumption of H2O2 and thus strongly inhibits the oxidation of TMB. The degree of colour change or absorbance decrease can be used for the detection of melamine by either the visually observed directly or the spectrometer. Taking advantages of the stable addition compound of C3H6N6·H2O2 for consumption of H2O2 and the effective Cu2+-H2O2-TMB catalyst system, the proposed method does not need any modification of probe or complicated operations, making it simple but reliable, and can be successfully applied for the detection of melamine in dairy products.
2 Experimental section
2.1 Reagents and apparatus
Melamine and 3,3′,5,5′-tetramethylbenzidine (TMB), glucose (Glu), sucrose (Suc), galactose (Gal), glycine (Gly), aspartic acid (Asp), alanine (Ala), arginine (Arg) and leucine (Leu) were purchased from Aladdin Reagent Co., Ltd. (Shanghai, China). Hydrogen peroxide (H2O2, 30 wt%), and the metal salts include NaCl, KCl, CaCl2 and Zn(Ac)2 were obtained from Sinopharm Chemical Reagent Co. Ltd. The milk and infant formula powder were obtained from local supermarkets. A 50 mM HAc–NaAc buffer (pH 4.0) was used in the experiments. Ultrapure water with a resistivity > 18 MΩ cm produced using a Millipore system was utilized in the preparation of all aqueous solutions. The ultraviolet-visible (UV-vis) absorption spectra were recorded using a Cary 300 Bio UV-vis spectrophotometer.2.2 Detection of melamine
Typically, 50 μL of melamine with different concentrations, 20 μL of 5 mM H2O2, and 20 μL of 20 mM Cu2+ were first added into a 1.5 mL centrifuge tube and mixed together. Then, 860 μL of HAc–NaAc buffer and 50 μL of 10 mM TMB were added in the above reaction solution to give a final volume of 1 mL. The mixed solution was incubated in a 40 °C water bath for 60 min. Finally, the UV-vis absorption spectrum of the reacted mixture was recorded over the wavelength ranging from 500 nm to 800 nm.2.3 Detection of melamine in dairy products
The milk and infant formula powder samples were prepared according to a previous report with a minor modification.28 In this work, 2.0 mL liquid milk or 20 mg infant formula powder was added to the solution containing 7.0 mL of water and 1.0 mL of acetonitrile. 1.0 mL trichloroacetic acid (2 M) was then added into the above solution. Then, the mixture was treated under ultrasonic for 20 min and further shaken for 15 min. After that, the mixture was centrifuged at 10![[thin space (1/6-em)]](https://www.rsc.org/images/entities/char_2009.gif) 000 rpm for 10 min to separate the deposit. The supernatant was adjusted to pH 7.0 with NaOH solution (1 M) and used for the following detection as that in HAc–NaAc buffer. The liquid milk and infant formula powder spiked melamine samples for the recovery experiments were treated as the same procedures aforementioned.
000 rpm for 10 min to separate the deposit. The supernatant was adjusted to pH 7.0 with NaOH solution (1 M) and used for the following detection as that in HAc–NaAc buffer. The liquid milk and infant formula powder spiked melamine samples for the recovery experiments were treated as the same procedures aforementioned.
3 Results and discussion
3.1 Mechanism of colorimetric assay
A simple and reliable Cu2+-H2O2-TMB system based colorimetric method was constructed for the detection of melamine without any modification or preparation of nanomaterials, which is presented schematically in Scheme 1. Two reactions were involved for the determination of melamine by this method. As reported previously, Cu2+ can work as Fenton-like agent and catalyse the oxidation of peroxidase substrate TMB in the presence of H2O2, leading to a blue coloured product oxTMB (Reaction 1).45,46 There are three amino groups in melamine molecule which endows it excellent reducibility.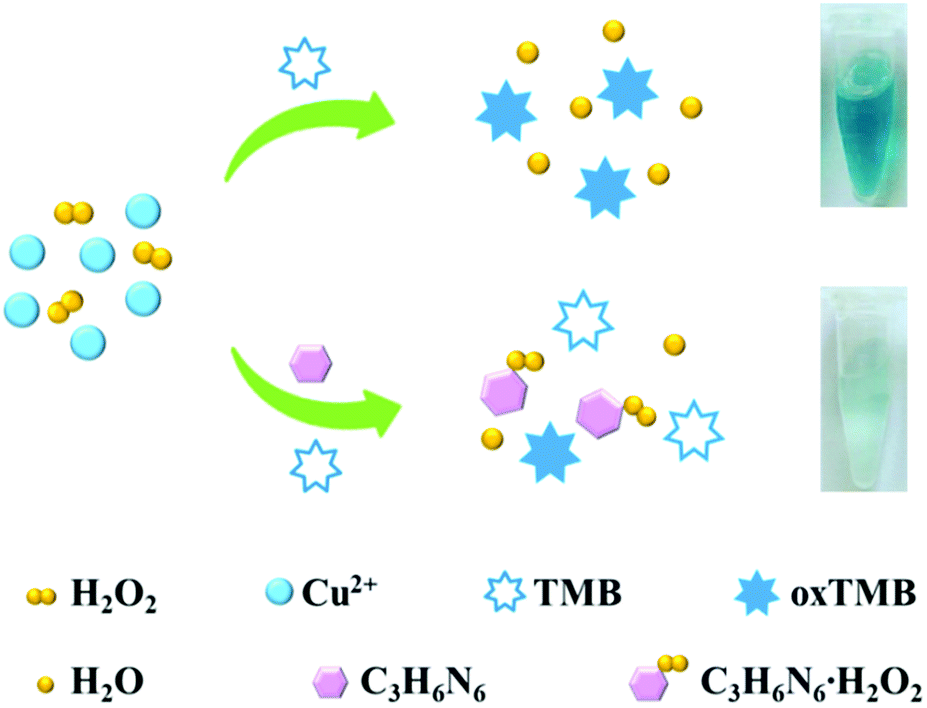 | ||
| Scheme 1 Schematic illustration of the colorimetric sensing system for melamine detection. | ||
Therefore, when added melamine into the system, melamine can quickly react with H2O2 which possesses good oxidation property to generate a stable addition compound C3H6N6·H2O2 (Reaction 2).28,49
 | (1) |
| C3H6N6 + H2O2 → C3H6N6·H2O2 | (2) |
On the basis of the above two reactions, the presence of melamine leads to the quickly consumption of H2O2 and thus inhibits the Cu2+-based Fenton-like reaction, resulting in a low efficiency of the Cu2+-H2O2-TMB reaction. Consequently, the solution colour changed from blue to colourless with a remarkable decrease of peak absorbance. The degree of colour change or absorbance increase was directly related to the amount of melamine. Compared with the traditional sensing system for melamine, the Cu2+-H2O2-TMB system based colorimetric method is relatively easy to implement and inexpensive, since it offers a convenient “mix-and-detect” protocol for homogeneous detection and does not require complicated synthesis, modification, strict storage conditions, and expensive equipment.
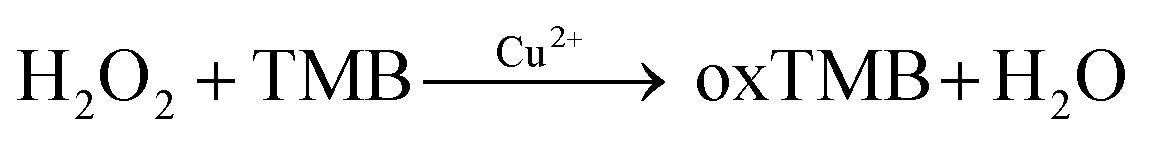
In order to verify the colorimetric sensing mechanism, the catalytic oxidation TMB under different conditions was investigated. As shown in Fig. 1, the aqueous solution of TMB remains colourless and exhibits negligible absorbance at 652 nm (curve a), and no obvious change of absorption spectra is observed after the addition of Cu2+ to TMB solution (curve b). In contrast, the introduction of H2O2 and Cu2+ essentially triggers the oxidative reaction of TMB, during which the original colourless gradually turns to blue in colour and exhibits a remarkable absorption peaks at 652 nm (curve c). As expected, when melamine is added into the Cu2+-H2O2-TMB system, the blue colour fades and the absorbance at 652 nm decreases obviously (curve d). The results confirmed that the reaction activity of Cu2+-H2O2-TMB system is indeed inhibited by melamine owing to the consumption of H2O2 by formation of C3H6N6·H2O2 complex.
 | ||
| Fig. 1 UV-vis absorption spectra of the colorimetric sensing system at different conditions: (a) TMB, (b) TMB + Cu2+, (c) TMB + Cu2+ + H2O2, (d) TMB + Cu2+ + H2O2 + melamine. The concentrations of TMB, Cu2+, H2O2 and melamine are 0.5 mM, 400 μM, 100 μM and 100 μM, respectively. | ||
These results substantially indicate that the proposed method is suitable for the sensitive detection of melamine.
3.2 Optimization of assay conditions
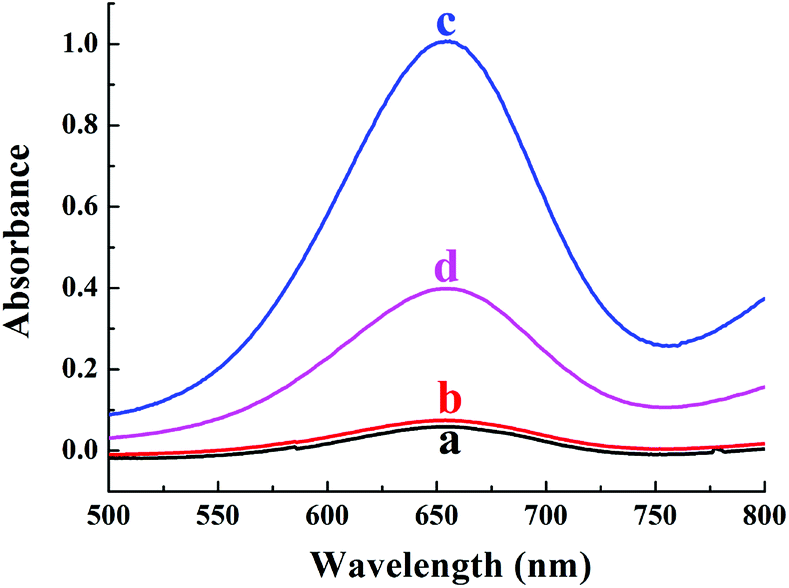
To explore a highly sensitive response to melamine in UV-vis detection, several important reaction conditions were optimized before the standard melamine assay, including the concentrations of TMB, Cu2+ and H2O2, the pH of reaction buffer, the incubation time and temperature. The absorbance difference ΔA652 = A0 − A was employed to evaluate the optimization of the variables, where A0 and A represented the absorbance at 652 nm in the absence and presence of 100 μM melamine, respectively. As shown in Fig. 2A, the absorbance is enhanced significantly as TMB concentration is increased, and then reached a maximum value until 0.5 mM. Hence, 0.5 mM was chosen as the optimal TMB concentration in the following experiments. Considering the fact that the oxidative of TMB requires the coexistence of the metal ion mimic peroxidase Cu2+ and H2O2, the concentrations of them were optimized then. Fig. 2B and C show the absorbance changes of Cu2+-H2O2-TMB sensing system upon the treatment with different concentrations of Cu2+ and H2O2 while fixing the concentration of melamine at 100 μM, respectively. The results indicated that the optimum concentrations of Cu2+ and H2O2 are 400 μM and 100 μM, respectively. It is well-known that the oxidative reaction of TMB is strongly dependent on the pH of reaction buffer. Therefore, the effect of pH on catalytic activity of Cu2+-H2O2-TMB sensing system was studied in the range of 3.0–6.0. As shown in Fig. 2D, the value of ΔA652 increases gradually and reaches a maximum at pH 4.0 and then decreases with further increasing pH value. Thus, the HAc–NaAc buffer with pH 4.0 was chosen in the following experiments. Moreover, the investigation results of incubation time indicate that the maximum value of ΔA652 can be obtained when reaction time is 60 min (Fig. S1†). Subsequently, the incubation temperature in the range of 25–50 °C was investigated and shown in Fig. S2.† It can be seen that the temperature being neither too high nor too low is suitable for this enzyme mimetic reaction. Therefore, 40 °C was selected as the optimal incubation temperature. | ||
| Fig. 2 Optimization of the detection conditions for melamine. The absorbance changes at 652 nm versus the concentrations of (A) TMB, (B) Cu2+, (C) H2O2 and the (D) pH values. Error bars were estimated from three replicate measurements. | ||
3.3 Analytical performance for the detection of melamine
Under the optimal conditions, the quantitative analysis capacity of the developed colorimetric sensing system for melamine was investigated. As shown in Fig. 3A, it is clearly seen that with the increase of melamine concentrations ranging from 0 to 500 μM, the absorbance at 652 nm of the Cu2+-H2O2-TMB sensing system decreases gradually while ΔA652 increases systematically, indicating that the inhibition of the oxidation of TMB by H2O2 is dependent on the concentration of melamine. Fig. 3B exhibits that a good linear correlation is obtained between the absorbance at 652 nm and the melamine concentration ranging from 1 to 100 μM, with the regression equation of ΔA652 = 0.01403 + 0.00621CMelamine (μM), and the correlation coefficient of R2 = 0.9905. The detection limit of the melamine assay is estimated to be 0.5 μM based on 3σ/slope, which is comparable to or lower than those of previously reported traditional instrumental assays such as HPLC and LC/MS.8,10 In addition, we compared the analytical performance of the proposed sensing system with other recently reported methods including electrochemical, fluorescent and colorimetric assays. As shown in Table S1,† the sensitivity of the Cu2+-H2O2-TMB sensing system is superior or comparable to most reported strategies. More importantly, our strategy is label-free and does not require complicated synthesis or strict storage conditions which endows it many advantages including low cost, simple operation and thus more practical. At the same time, the colour of the Cu2+-H2O2-TMB system gradually turns initially from blue to colourless and the obvious colour variation is depicted in Fig. 3C. The colour change can be distinguished by the naked eye with the concentration of melamine around 20 μM, indicating the simplicity and convenience in the detection of melamine compared with those methods that require expensive instruments.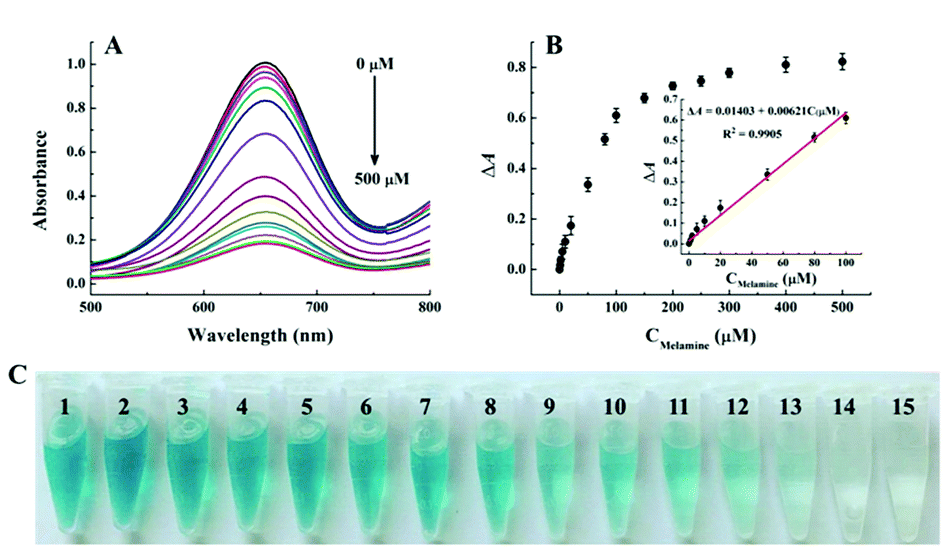 | ||
| Fig. 3 (A) The UV-vis absorption spectra of the colorimetric sensing system in the presence of different concentrations of melamine. (B) The relationship between melamine concentration and absorbance changes at 652 nm. Inset: the linear region at low melamine concentrations. (C) Typical photographs for different concentrations of melamine under the optimum conditions, from 1 to 15 are 0, 1, 2, 5, 10, 20, 50, 80, 100, 150, 200, 250, 300, 400 and 500 μM, respectively. Error bars were estimated from three replicate measurements. | ||
As the nutrient contents of dairy products are complicated, it is important to evaluate the specificity of the proposed colorimetric method for melamine detection, we investigated the absorbance changes as induced by some possible interference including some metal ions, amino acids, and sugars. As shown in Fig. 4, melamine exhibits the highest value of ΔA652 and the values of ΔA652 of other interferences are almost negligible even if others concentration is 100 times higher than melamine. The good selectivity may be attributed to the specific additional reaction of melamine with H2O2. These results proved the good sensitivity and selectivity of this method and the possibility for detecting melamine in dairy products.
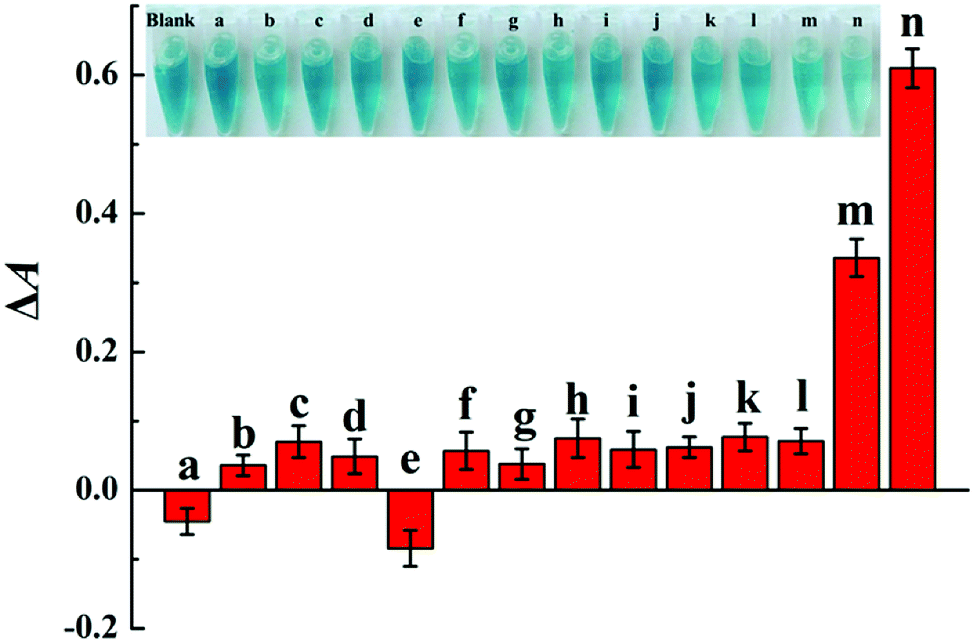 | ||
| Fig. 4 Selectivity of the colorimetric sensing system for melamine detection. From a to n are Na+, K+, Ca2+, Zn2+, Glu, Suc, Gal, Asp, Gly, Ala, Arg, Leu, 50 μM melamine and 100 μM melamine, respectively. The concentration of the interference substances are all 100 μM, respectively. The inset is the corresponding photographs. Error bars were estimated from three replicate measurements. | ||
3.4 Detection of melamine in dairy product samples
In order to evaluate the feasibility of the colorimetric sensing system in real samples, the recovery experiments of melamine were investigated by spiking melamine with different concentrations into liquid milk and infant formula powder according to the same detection procedure as in HAc–NaAc buffer. It is worth noting that ascorbic acid, namely vitamin C (Vit C), as an essential nutrient added into dairy products may be a potential interfering substance due to its antioxidant property. Therefore, the controlling experiment was first conducted in dairy product samples to confirm that the necessity of melamine to induce the absorbance change while the presence of Vit C has no obvious interference. As shown in Fig. 5, compared to the absorbance change of the sensing system upon the addition of melamine (20 μM), weaker absorbance changes are observed by Vit C even though at the concentration of 5 times as that of melamine. The result implied the necessity of melamine for the consumption of H2O2 and thus inducing absorbance change and the weak interference of Vit C added as an essential nutrient in both liquid milk and infant formula powder. The weak interference of Vit C might be owing to the following two accounts: the milk proteins in dairy products might induce “disappearance” of Vit C and slowed down the auto-oxidation of Vit C significantly; the excellent reducibility of the three amino groups endows melamine with prior redox of melamine–H2O2 in contrast to Vit C.49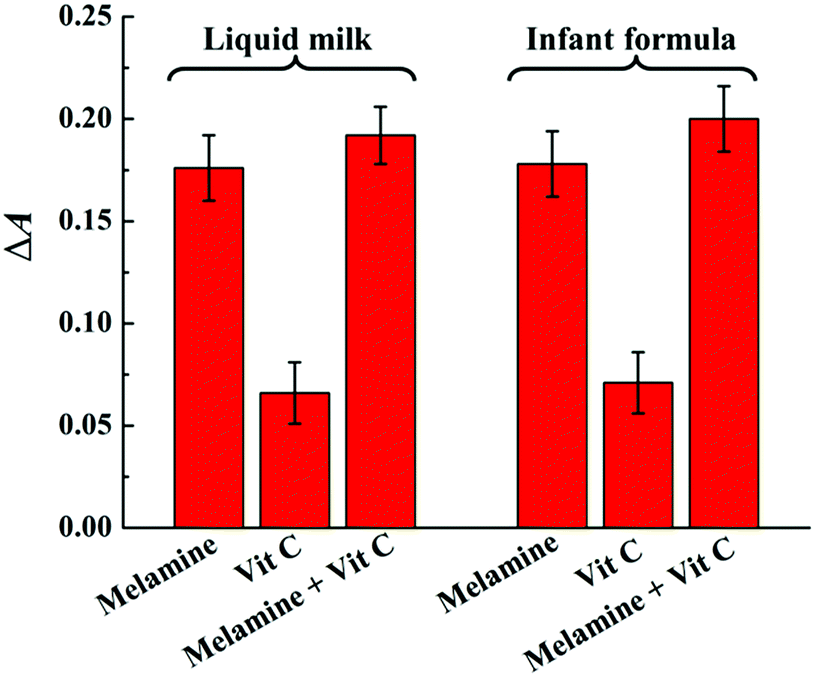 | ||
| Fig. 5 The responses of the colorimetric sensing system for melamine (20 μM) and Vit C (100 μM) detection in liquid milk and infant formula powder samples. Error bars were estimated from three replicate measurements. | ||
Then, the recovery experiments were carried out by spiking different concentrations of melamine in each sample to evaluate the accuracy of the colorimetric sensing system as no melamine was found in both liquid milk and infant formula powder. As shown in Table 1, the recoveries for melamine are ranging from 96.0% to 104.5%, and the relative standard deviations (RSDs) are all below 4.7%, demonstrating no severe interference in the tested dairy product samples. In addition, under the optimal conditions, a weak decrease in absorbance can be observed for all the samples, which may be due to a slight interference in the oxidization of TMB reaction by some possible reducing components in the milk samples. Fortunately, the calibration curve of the assay between ΔA652 and the spiked melamine concentration for the liquid milk samples was similar to that in the buffer system (Fig. S3A†), and the colour change can also be distinguished by the naked eye with the concentration of melamine around 20 μM as similar to that in buffer system (Fig. S3B†). Therefore, the encouraging results demonstrate the great promise of this method for monitoring melamine in real samples.
| Sample | Added (μM) | Found (μM) | Recovery (%) | RSD (n = 3, %) |
|---|---|---|---|---|
| Liquid milk | 5.0 | 4.8 | 96.0 | 4.5 |
| 20.0 | 20.3 | 101.5 | 3.9 | |
| 50.0 | 50.1 | 100.2 | 3.8 | |
| Infant formula powder | 5.0 | 5.2 | 104.0 | 4.2 |
| 20.0 | 20.9 | 104.5 | 4.7 | |
| 50.0 | 51.9 | 103.8 | 3.2 |
4 Conclusions
In summary, we demonstrated a convenient label free colorimetric Cu2+-H2O2-TMB sensing system for sensitive detection of melamine based on the consumption of H2O2 by melamine induced inhibition effect of Cu2+-H2O2-TMB reaction. Cu2+ can catalyse the oxidation of TMB to oxTMB in the presence of H2O2 with a blue colour change of the solution. However, the quickly and stable addition reaction between melamine and H2O2 disturbed the Cu2+-H2O2-TMB reaction, resulting in a fading change of the reaction system which can be distinguished by naked eyes for about 20 μM melamine. Since no complicated synthesis and modification of signal probes or tedious procedures involved, the developed visual assay is cost-effective and convenient compared with the traditional melamine assays. Using the sensitive and selective sensing system, the liquid milk and infant formula powder samples contained melamine could also be detected successfully. Therefore, the present sensing system holds the potential for reliable screening melamine in real dairy products, ensuring both public health and food security.Conflicts of interest
There are no conflicts of interest to declare.Acknowledgements
Xue Han and Zhixin Qin contributed equally to this work. This work was supported by the National Natural Science Foundation of China (21775089), the Natural Science Foundation Projects of Shandong Province (ZR2017QB008, ZR2017JL010), and the National Undergraduate Innovation and Entrepreneurship Training Program (201710446039).Notes and references
- T. L. Fodey, C. S. Thompson, I. M. Traynor, S. A. Haughey, K. D. Glenn and S. R. H. Crooks, Anal. Chem., 2011, 83, 5012–5016 CrossRef CAS PubMed.
- K. L. Ai, Y. L. Liu and L. H. Lu, J. Am. Chem. Soc., 2009, 131, 9496–9497 CrossRef CAS PubMed.
- C. Fu, C. Liu, Y. Li, Y. Guo, F. Luo, P. Wang, L. Guo, B. Qiu and Z. Lin, Anal. Chem., 2016, 88, 10176–10182 CrossRef CAS PubMed.
- R. Reimschuessel and B. Puschner, J. Med. Toxicol., 2010, 6, 468–469 CrossRef PubMed.
- L. Zhu, G. Gamez, H. Chen, K. Chingin and R. Zenobi, Chem. Commun., 2009, 5, 559–561 RSC.
- http://www.fda.gov/NewsEvents/PublicHealthFocus/ucm179005.htm, 2009.
- F. Sun, W. Ma, L. Xu, Y. Zhu, L. Liu, C. Peng, L. Wang, H. Kuang and C. Xu, Trends Anal. Chem., 2010, 29, 1239–1249 CrossRef CAS.
- Y. Zhang, S. Lin, P. Jiang, X. Zhu, J. Ling, W. Zhang and X. Dong, J. Chromatogr. A, 2014, 1337, 17–21 CrossRef CAS PubMed.
- H. Miao, S. Fan, Y. N. Wu, L. Zhang, P. P. Zhou, J. G. Li, H. J. Chen, Y. F. Zhao and J. G. Li, Biomed. Environ. Sci., 2009, 22, 87–94 CrossRef CAS PubMed.
- M. S. Filigenzi, B. Puschner, L. S. Aston and R. H. Poppenga, J. Agric. Food Chem., 2008, 56, 7593–7599 CrossRef CAS PubMed.
- N. Yan, L. Zhou, Z. F. Zhu and X. Chen, J. Agric. Food Chem., 2009, 57, 807–811 CrossRef CAS PubMed.
- P. Ma, F. Liang, Y. Sun, Y. Jin, Y. Chen, X. Wang, H. Zhang, D. Gao and D. Song, Microchim. Acta, 2013, 180, 1173–1180 CrossRef CAS.
- C. Han, Y. Li, Q. Jia, L. H. Bradley, Y. Gan, Y. Yao, L. Qu, H. Li and Y. Zhao, Microchim. Acta, 2017, 184, 2909–2917 CrossRef CAS.
- H. Lei, Y. Shen, L. Song, J. Yang, O. P. Chevallier, S. A. Haughey, H. Wang, Y. Sun and C. T. Elliott, Anal. Chim. Acta, 2010, 665, 84–90 CrossRef CAS PubMed.
- X. Liu, M. Song and F. Li, Sci. Rep., 2017, 7, 4490 CrossRef PubMed.
- N. Chen, Y. Cheng, C. Li, C. Zhang, K. Zhao and Y. Xian, Microchim. Acta, 2015, 182, 1967–1975 CrossRef CAS.
- H. W. Zhu, W. X. Dai, X. D. Yu, J. J. Xu and H. Y. Chen, Talanta, 2015, 144, 642–647 CrossRef CAS PubMed.
- Y. Wang, Q. Sun, L. Zhu, J. Zhang, F. Wang, L. Lu, H. Yu, Z. Xu and W. Zhang, Chem. Commun., 2015, 51, 7958–7961 RSC.
- X. Liu, N. Xu, P. Gai and F. Li, Talanta, 2018, 185, 352–358 CrossRef CAS PubMed.
- Q. Du, F. Qu, B. Mao, S. Zhu and J. You, New J. Chem., 2016, 40, 8459–8464 RSC.
- F. Qu, X. Xu and J. You, New J. Chem., 2017, 41, 9438–9443 RSC.
- L. Tang, S. Mo, S. G. Liu, Y. Ling, X. F. Zhang, N. B. Li and H. Q. Luo, J. Agric. Food Chem., 2018, 66, 2174–2179 CrossRef CAS PubMed.
- L. Zhang and L. Chen, Microchim. Acta, 2018, 185, 135 CrossRef PubMed.
- N. Ding, N. Yan, C. Ren and X. Chen, Anal. Chem., 2010, 82, 5897–5899 CrossRef CAS PubMed.
- H. Hu, J. Zhang, Y. Ding, X. Zhang, K. Xu, X. Hou and P. Wu, Anal. Chem., 2017, 89, 5101–5106 CrossRef CAS PubMed.
- W. F. Wang, Y. Qiang, X. H. Meng, J. L. Yang and Y. P. Shi, Sens. Actuators, B, 2018, 260, 808–815 CrossRef CAS.
- P. J. Ni, H. C. Dai, Y. L. Wang, Y. J. Sun, Y. Shi, J. T. Hu and Z. Li, Biosens. Bioelectron., 2014, 60, 286–291 CrossRef CAS PubMed.
- J. Song, F. Wu, Y. Wan and L. H. Ma, Microchim. Acta, 2014, 181, 1267–1274 CrossRef CAS.
- G. Wang, Y. Zhu, X. He, L. Chen, L. Wang and X. Zhang, Microchim. Acta, 2014, 181, 411–418 CrossRef CAS.
- H. Chen, Q. Lu, K. He, M. Liu, Y. Zhang and S. Yao, Sens. Actuators, B, 2018, 260, 908–917 CrossRef CAS.
- Y. Chen, Y. Xianyu, J. Wu, B. Yin and X. Jiang, Theranostics, 2016, 6, 969–985 CrossRef CAS PubMed.
- S. Krishnan, R. M. Miller, B. Tian, R. D. Mullins, M. P. Jacobson and J. Taunton, J. Am. Chem. Soc., 2014, 136, 12624–12630 CrossRef CAS PubMed.
- Z. Shan, M. Lu, L. Wang, B. MacDonald, J. MacInnis, M. Mkandawire, X. Zhang and K. D. Oakes, Chem. Commun., 2016, 52, 2087–2090 RSC.
- Z. Mao, Z. Qing, T. Qing, F. Xu, L. Wen, X. He, D. He, H. Shi and K. Wang, Anal. Chem., 2015, 87, 7454–7460 CrossRef CAS PubMed.
- Y. B. Ruan, C. Li, J. Tang and J. Xie, Chem. Commun., 2010, 46, 9220–9222 RSC.
- W. Cui, H. Qin, Y. Zhou and J. Du, Microchim. Acta, 2017, 184, 1103–1108 CrossRef CAS.
- L. Zhang, M. Li, Y. Qin, Z. Chu and S. Zhao, Analyst, 2014, 139, 6298–6303 RSC.
- F. Qiao, L. Chen, X. Li, L. Li and S. Ai, Sens. Actuators, B, 2014, 193, 255–262 CrossRef CAS.
- T. Lin, L. Zhong, Z. Song, L. Guo, H. Wu, Q. Guo and G. Chen, Biosens. Bioelectron., 2014, 62, 302–307 CrossRef CAS PubMed.
- X. Tian, X. Wang, C. Dai, Y. Li, C. Yang, Z. Zhou and Y. Wang, Sens. Actuators, B, 2017, 245, 221–229 CrossRef CAS.
- C. Wu, D. Fan, C. Zhou, Y. Liu and E. Wang, Anal. Chem., 2016, 88, 2899–2903 CrossRef CAS PubMed.
- N. R. Nirala, S. Abraham, V. Kumar, A. Bansal, A. Srivastava and P. S. Saxena, Sens. Actuators, B, 2015, 218, 42–50 CrossRef CAS.
- W. Li, X. Zhao, J. Zhang and Y. Fu, Biosens. Bioelectron., 2014, 60, 252–258 CrossRef CAS PubMed.
- Q. Lu, J. Deng, Y. Hou, H. Wang, H. Li and Y. Zhang, Chem. Commun., 2015, 51, 12251–12253 RSC.
- H. F. Lu, J. Y. Li, M. M. Zhang, D. Wu and Q. L. Zhang, Sens. Actuators, B, 2017, 244, 77–83 CrossRef CAS.
- Y. Q. Chang, Z. Zhang, J. H. Hao, W. S. Yang and J. L. Tang, Sens. Actuators, B, 2016, 228, 410–415 CrossRef CAS.
- W. Zhou, W. Liang, X. Li, Y. Chai, R. Yuan and Y. Xiang, Nanoscale, 2015, 7, 9055–9061 RSC.
- J. Wielicka, A. Ptasiewicz-Malinowska, T. Jędrych, M. Minda, B. Wiejak, T. Pajer, W. Ratajczak, M. Michalska and W. Capała, Pol. J. Chem. Technol., 2003, 5, 19–21 CAS.
- W. L. Li, F. Z. Kong, Q. Zhang, W. W. Liu, H. Kong, X. P. Liu, M. I. Khan, A. Wahid, S. Saud, H. Xiao, C. X. Cao and L. Y. Fan, Anal. Chem., 2018, 90, 6710–6717 CrossRef CAS PubMed.
Footnote |
| † Electronic supplementary information (ESI) available. See DOI: 10.1039/c8ra07167e |
| This journal is © The Royal Society of Chemistry 2018 |