 Open Access Article
A novel analytical method based on HPLC-PDA coupled post-column derivatization to evaluate the ability to inhibit tyrosine nitration in lotus leaf extracts†
Yin Qiana,
Xi Chena,
Jin Qi *a and
Xuming Liu*b
aJiangsu Key Laboratory of TCM Evaluation and Translational Research, School of Traditional Chinese Pharmacy, China Pharmaceutical University, Nanjing 211198, PR China. E-mail: qijin2006@163.com
bSchool of Life Science and Technology, China Pharmaceutical University, Nanjing 211198, PR China. E-mail: liuxm@cpu.edu.cn
First published on 16th November 2018
Abstract
Protein tyrosine nitration plays a key role in many inflammatory and cardiovascular diseases and diabetes. Many natural products are used to treat these diseases through their ability to potentially interfere this reaction. Here, we describe a novel method to provide active fingerprinting of inhibition of tyrosine nitration by natural products based on post-column tyrosine nitration reaction analysis using high-performance liquid chromatography coupled to a photometric diode array. Results indicated that lotus leaf extracts exhibited obvious inhibitory activity against tyrosine nitration by peroxynitrite, and that chemical and active fingerprints were simultaneously established, with the active fingerprints indicating the active compounds of the lotus leaves. Additionally, flavonoids were screened as the principal active compounds involved in inhibiting tyrosine nitration in the lotus leaf extracts, with quercetin-3-O-glucuronide and quercetin-3-O-glucoside exhibiting the greatest contributions. Moreover, our results suggested that lotus leaves from three regions (Nanjing, Suzhou, and Hangzhou) exhibited the best inhibitory activity. These findings indicated the usefulness of this method for screening active compounds involved in inhibiting protein tyrosine nitration, and that similar strategies can likely be applied to evaluate the inhibitory activity against tyrosine nitration of other natural products.
1. Introduction
Protein tyrosine nitration is a selective post-translational modification that mainly affects protein function and structure, with 3-nitrotyrosine (3-NT), the product of protein tyrosine nitration, representing a biomarker of this modification.1Generally, 3-NT is present in many pathological conditions ranging from acute to chronic diseases,2 such as inflammation,3 atherosclerosis,4 neurodegenerative diseases,5 cardiovascular diseases,6 and diabetes.7 Protein tyrosine nitration results in modification of tyrosine or cysteine in proteins, resulting in the inactivation of enzymes, such as superoxide dismutase, tyrosine hydroxylase, and protein kinase C.8 Therefore, this reaction can potentially result in a series of cytotoxic effects and/or prevent normal intracellular metabolism, suggesting an important role in the occurrence and development of several diseases.
Currently, 3-NT detection is the most commonly used strategy for detecting the occurrence of protein tyrosine nitration and is undertaken mainly by immunoassays,9 spectrophotometry,10 high-performance liquid chromatography (HPLC),11 and mass spectrometry (MS).12 Several natural products are capable of interfering with 3-NT generation; however, it is difficult to identify the active compounds involved in this process through searches of secondary metabolites.
Lotus leaves (Nelumbo nucifera Gaertn.) have a complicated chemical composition that includes flavonoids, alkaloids and glycosides.13 Modern pharmacological studies indicate that lotus leaves are commonly used to prevent obesity14,15 and treat cardiovascular disease,16 with their use also exhibiting antioxidant,17–20 anti-HIV,21 and anticancer22–24 effects. Later experiment in this study proved that lotus leaf extracts exhibited obvious inhibitory activity against tyrosine nitration.
In this study, we developed an effective method for evaluating the inhibitory activity against tyrosine nitration of natural products based on HPLC-photometric diode array (PDA)-coupled post-column analysis. The results showed that this method provided active fingerprinting to rapidly screen the active compounds involved in inhibiting protein tyrosine nitration in 14 batches of lotus leaf extracts. These findings suggest that similar strategies can be applied to evaluate the inhibitory activity against tyrosine nitration of other natural products.
2. Materials and methods
2.1 Instrumentation and reagents
The Shimadzu LC-2010CHT HPLC system (Shimadzu, Tokyo, Japan), consisting of a binary pump, autosampler, thermostatted column compartment, and photodiode array detector (PDA).HPLC-grade acetonitrile (Tedia Company, Fairfield, OH, USA), HPLC-grade methanol (Nanjing Chemical Reagent Corp., Jiangsu, China), analytical-grade ammonium acetate (Nanjing Chemical Reagent Corp., Jiangsu, China) and HPLC-grade formic acid (Aladdin Bio-Chem Technology Corp., Shanghai, China) were used for the chromatographic separations. H2O2 (30% in water), MnO2 (Xilong Chemical Co., Ltd, Shantou, China), sodium nitrite, hydrochloric acid, and sodium hydroxide (Nanjing Chemical Reagent Corp., Jiangsu, China) were used for the preparation of ONOO−. Analytical-grade Na2HPO4·12H2O and NaH2PO4·2H2O (Nanjing Chemical Reagent Corp., Jiangsu, China) were used for the preparation of phosphate buffer.
The purity of tyrosine and 3-nitrotyrosine (Nanjing Zelang Medical Technology Co., LTD. Jiangsu, China) were determined to be ≥98%. Water was purified using a Milli-Q water purification system (Millipore, Bedford, MA, USA).
2.2 Materials
Fourteen batches of lotus leaves were obtained from markets in different regions of China. Their code and purchased locations are as follows: S01 (Nanjing, Jiangsu), S02 (Nanjing, Jiangsu), S03 (Suzhou, Anhui), S04 (Bozhou, Anhui), S05 (Chongqing), S06 (Chenzhou, Hunan), S07 (Ganzhou, Jiangxi), S08 (Nanchang, Jiangxi), S09 (Nanchang, Jiangxi), S10 (Zhengzhou, Henan), S11 (Laiwu, Shandong), S12 (Laiwu, Shandong), S13 (Qingdao, Shandong), S14 (Hangzhou, Zhejiang). All of the samples were authenticated by Professor Jin Qi. Their voucher specimens were deposited in the Jiangsu Key Laboratory of TCM Evaluation and Translational Research, China Pharmaceutical University, Nanjing, China.0.2 M phosphate buffer were prepared with 0.2 M Na2HPO4·12H2O and 0.2 M NaH2PO4·2H2O, pH value was adjusted to 7.4 and the buffer solution was stored at 4 °C until use.
2.3 Preparation of ONOO− solution
An improved method was used to synthesize the peroxynitrite from nitrite and hydrogen peroxide,25–27 briefly, a 10 mL of solution I (0.6 M H2O2 and 0.7 M HCl) was mixed with 10 mL of solution II (0.6 M NaNO2) in ice water bath, followed by addition to 20 mL of 1.2 M NaOH solution. MnO2 was then added, followed by mixing for 5 min to remove excess H2O2. ONOO− solution was obtained after filtration, with the solution stored at −20 °C for 1 to 2 weeks. The concentration needs to be measured upon use of the ONOO− solution using the methods provided in the ESI.†2.4 Sample preparation for HPLC fingerprinting
Dried lotus leaf samples were milled into 60-mesh powders, and each sample (0.5 g) was weighed accurately and extracted with a methanol–water solution (70![[thin space (1/6-em)]](https://www.rsc.org/images/entities/char_2009.gif) :
:![[thin space (1/6-em)]](https://www.rsc.org/images/entities/char_2009.gif) 30 v/v, 50 mL) and placed in an ultrasonic water bath for 30 min. The extract was filtered through a membrane (0.45 μm), and aliquot (20 μL) of the sample solution was injected into the HPLC system.
30 v/v, 50 mL) and placed in an ultrasonic water bath for 30 min. The extract was filtered through a membrane (0.45 μm), and aliquot (20 μL) of the sample solution was injected into the HPLC system.
2.5 HPLC fingerprint conditions
Referred to our previous research, the lotus leaves HPLC fingerprint condition was determined.28 Briefly, a Phenomenex Luna C18 column (250 × 4.6 mm, 5 μm; Phenomenex, Torrance, CA, USA) was used for chromatographic separation. The mobile phase comprised 10 mM aqueous ammonium acetate (A) and acetonitrile (B), and the gradient-elution program was as follows: 0–20 min, 5–15% B; 20–40 min, 15–23% B; 40–55 min, 23–50% B; 55–65 min, 50% B. The mobile-phase flow rate was 1.0 mL min−1, the detection wavelength was 270 nm, and the column temperature was set at 30 °C.2.6 HPLC conditions for detecting 3-NT generation
The chromatographic column was used similar to that described in Section 2.5, with slight modifications. Briefly, the mobile phase comprised 0.1% formic acid–water (A) and methanol (B), and an isometric elution program with 90% A and 10% B was used. The flow rate was 1.0 mL min−1, the mobile-phase detection wavelength was 280 nm, and the column temperature was set at 30 °C.2.7 Detecting of the inhibitory activity of lotus leaf extracts
Tyrosine was added to 0.2 M phosphate buffer in order to prepare the 500 μM tyrosine (Tyr) solution. Batches S1, S2, and S14 of lotus leaf extracts were diluted 10 times with 0.2 M phosphate buffer, and 100 μL of each diluted extract solution was mixed with 2 mL of the Tyr solution, followed by addition of 100 μL of the ONOO− solution to a final ONOO− concentration of 500 μM. The mixture was incubated at 37 °C for 10 min, and the supernatant was obtained following centrifugation for 10 min at 12![[thin space (1/6-em)]](https://www.rsc.org/images/entities/char_2009.gif) 000 rpm. An aliquot (10 μL) of the supernatant was injected onto the HPLC column in order to measure 3-NT generation. The blank group comprised replacement of the diluted extract solution with 100 μL of methanol–water solution (70
000 rpm. An aliquot (10 μL) of the supernatant was injected onto the HPLC column in order to measure 3-NT generation. The blank group comprised replacement of the diluted extract solution with 100 μL of methanol–water solution (70![[thin space (1/6-em)]](https://www.rsc.org/images/entities/char_2009.gif) :
:![[thin space (1/6-em)]](https://www.rsc.org/images/entities/char_2009.gif) 30, v/v). The inhibition rate of each fraction was calculated as follows:
30, v/v). The inhibition rate of each fraction was calculated as follows:
 | (1) |
2.8 Detecting inhibition activity associated with common peaks
We collected common peaks (fingerprints) associated with the 14 batches of lotus leaf extracts at 0.5 min intervals. Each fraction was transferred into 2 mL of Tyr solution, followed by the addition of 100 μL of the ONOO− solution to a final ONOO− concentration of 500 μM. After incubating for 10 min at 37 °C, followed by centrifugation for 10 min at 12![[thin space (1/6-em)]](https://www.rsc.org/images/entities/char_2009.gif) 000 rpm, the supernatant was obtained as a sample solution. An aliquot (10 μL) of the sample solution was injected onto the HPLC column in order to measure 3-NT generation, with the blank group constructed by replacing collected fractions with 500 μL of the mobile phase (0.1% formic acid–water and methanol). The inhibition rate observed for each fraction was calculated as follows:
000 rpm, the supernatant was obtained as a sample solution. An aliquot (10 μL) of the sample solution was injected onto the HPLC column in order to measure 3-NT generation, with the blank group constructed by replacing collected fractions with 500 μL of the mobile phase (0.1% formic acid–water and methanol). The inhibition rate observed for each fraction was calculated as follows:
 | (2) |
2.9 Method validation of 3-NT analysis
Matrix effects, linear ranges, limit of detection (LOD), limit of quantification (LOQ), repeatability, intra-day precision, inter-day precision, and recovery were investigated for validation. The matrix effect was measured by comparing the peak-area ratio of the 3-NT generated to that of the matrix sample for three replicates. Linear range was analyzed by establishing the calibration curve calculated from the peak area of 3-NT generated from seven different concentrations versus the 3-NT concentrations. The LOD and LOQ were determined when the signal-to-noise ratio was 3 and 10, respectively. To evaluate repeatability, six independently prepared solutions of generated 3-NT were analyzed. Intra-day precision was calculated by measuring the sample of the reference substance at intermediate concentrations on the same day. Inter-day precision was calculated by measuring this concentration on three consecutive days. Precisions were expressed as relative standard deviations (RSDs, %) of the replicates. To evaluate recovery, standard solutions at three different concentrations (low, medium, and high) were added to the sample of generated 3-NT. Three replicates were performed at each concentration.2.10 Establishment of a dose–effect curve
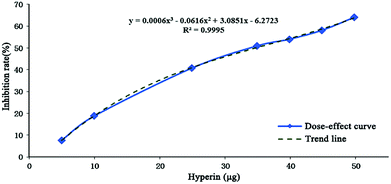
Compounds with wide chromatographic peaks generated more than one collected fraction; however, the inhibition rates of each fraction cannot be additive. Therefore, it was necessary to establish an evaluating index that could be additive in order to measure the efficacy of each peak. Hyperin was chosen as a positive-control compound, and a dose–response curve (Fig. 1) representing inhibition of protein tyrosine nitration was established [y = 0.0006x3 − 0.0616x2 + 3.0851x − 6.2723 (R2 = 0.9995)]. Inhibition rates were correlated with the hyperin content when an equivalent quantity of hyperin for each fraction was obtained. The efficacy of 1 μg of hyperin used as a potency unit was calculated, with potency representing an additive index, and total potency reflecting the inhibitory efficacy associated with each peak.3. Results and discussion
3.1 Optimization of the conditions used for 3-NT determination
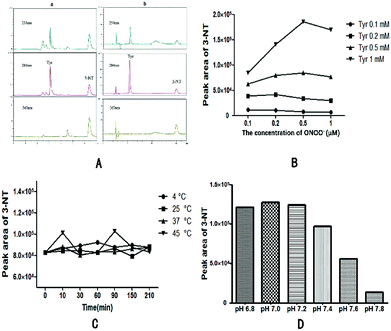
The maximum absorption wavelength of 3-NT is 280 nm according to comparisons of chromatograms obtained at 254 nm, 280 nm, and 360 nm (Fig. 2A), and based on by-product peaks at 280 nm being minimal. Therefore, 280 nm was selected as the optimal detection wavelength.Comparison of different mobile phases, including 0.1% formic acid–water (A) and acetonitrile (B) [Fig. 2A(a)] and 0.1% formic acid–water (A) and methanol (B) [Fig. 2A(b)] was performed. Both sets of mobile phases used an isometric elution program involving 90% A and 10% B. Results showed that the detection time was greatly reduced when 10% acetonitrile and 0.1% formic acid–water were used as the mobile phase, although a dose–response curve could not be generated. Therefore, 10% methanol and 0.1% formic acid–water was chosen as mobile phase after consideration.
As is shown in Fig. 2B, increased levels of 3-NT were generated after increasing the concentration of Tyr solution containing a constant final concentration of ONOO− solution. At 0.1 M Tyr solution and higher ONOO− concentrations, 3-NT content increased at final ONOO− concentrations <0.5 mM and decreased at ONOO− concentrations >0.5 mM. This was likely a result of secondary reactions promoted by the higher ONOO− concentration. Therefore, 0.5 mM Tyr solution containing 0.5 mM ONOO− solution was chosen as the appropriate reaction system.
Different incubation temperatures and times were evaluated to assess their influence on 3-NT peak areas. As showing in Fig. 2C, a significant fluctuation occurred at 45 °C, indicating that high temperatures would likely affect the results. Additionally, we observed that 3-NT generation was relatively consistent (RSD < 1.04%) at different incubation times at 25 °C and 37 °C. Therefore, 10 min was chosen as the optimal incubation time, whereas 37 °C was selected as the incubation temperature in order to mimic physiological conditions.
ONOO− solution is relatively stable in alkaline conditions and rapidly decomposes under neutral and acidic conditions. To simulate neutral physiological conditions, 0.2 M phosphate buffer solution was chosen to control the pH value. We then investigated 3-NT generation according to pH range (Fig. 2D), with the highest amount of 3-NT generated at pH 7.0. At increasing pH levels, 3-NT generation decreased, with these decreases becoming more rapid at pH > 7.6 and indicating that a lower pH might promote protein tyrosine nitration. To simulate physiological conditions, pH 7.4 was chosen as the pH value for subsequent experiments.
3.2 Method validation for HPLC analyses of 3-NT
The quantity of generated 3-NT relative to that in blank matrix samples ranged from 99.55% to 101.29%, indicating the method was free from matrix effect. Moreover, the calibration curve exhibited good linearity in the range of 5 μM to 100 μM, with a correlation coefficient (r) of 0.9999 (A = 2662.2 × C − 1145). Additionally, the LOD and LOQ were 1.10 μM and 3.03 μM, respectively, the RSD of repeatability was 1.03%, and the RSDs for intra-day and inter-day precision were 0.53% and 0.70%, respectively. To evaluate recovery, different concentrations (low, medium, and high) of the standard solution were added to the sample solutions, resulting in recovery RSDs in the range of 100.95% to 104.49%.3.3 Establishment of lotus leaf extracts fingerprint
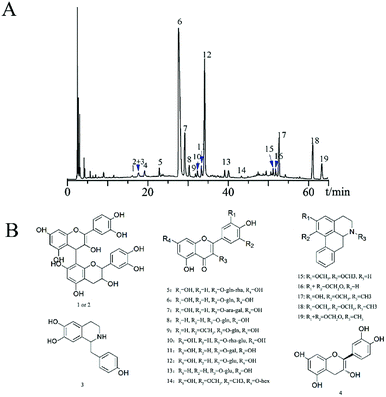
The HPLC-PDA chromatogram fingerprints of lotus leaf extracts from 14 regions of China were established (Fig. 3) referred to Section 2.5, and 19 common peaks were identified from the fingerprints (Fig. 4A). According to previous research data of our research group,28 we determined the chemical structures of the 19 common peaks (Fig. 4B). | ||
| Fig. 4 (A) Common peak chromatogram of lotus leaves extracts HPLC fingerprint; (B) chemical structures of 19 compounds identified in lotus leaves extracts. | ||
3.4 Analysis of the inhibitory activity of lotus leaf extracts
The inhibitory activities of batches S1, S2, and S14 of the lotus leaf extracts were detected under the optimized HPLC conditions. The mean inhibition rates of batches S1, S2 and S14 were 66.78%, 84.09% and 72.87% respectively. The inhibition rates of all the three batches were >60%, compared with 32 traditional Chinese herbs were reported previously,29 which indicated the ability for lotus leaf to inhibit protein tyrosine nitration.3.5 Effect of substrate on 3-NT generation
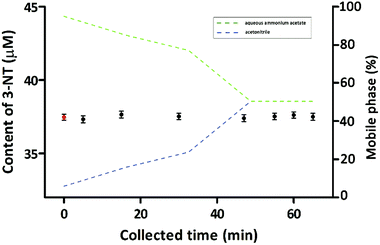
To investigate whether the substrates designated by the collected chromatographic peaks affected protein tyrosine nitration, we collected samples of the mobile phase at 0.5 min intervals during fingerprinting for 5 min, 15 min, 30 min, 47 min, 55 min, 60 min, and 65 min. Comparison of 3-NT generation between the sample groups and the control group (Fig. 5) revealed no significant differences (one-way analysis of variance, p > 0.05). These results suggested that the presence of substrate had no discernible effect on protein tyrosine nitration.3.6 Determination of the active inhibitory compounds in the lotus leaf extracts
Nineteen common peaks associated with the lotus leaf extract fingerprint were collected at 0.5 min intervals (Fig. 6), and each fraction was used to assess its ability to inhibit protein tyrosine nitration. The inhibition rate of each fraction could be calculated referred to the method in Section 2.8 and potency of each fraction was calculated based on dose–effect curve. Total potency was the sum of potencies associated with each peak. Fig. 7 shows that values for batch S4 of lotus leaf extract.Peaks 2 and 3 represented two different compounds according to previous MS data of our research group;28 however, only a single peak was shown in the HPLC chromatogram. Therefore, peaks 2 and 3 were regarded as a combined peak for the following calculations. The inhibition rates of the various fractions (in batch S4; Fig. 7A) indicated that peaks 6 and 12 exhibited higher rates as compared with other peaks, with the total potencies of the various fractions (Fig. 7C) confirming their higher contribution to inhibiting protein tyrosine nitration. Additionally, we found that the total potencies of the other peaks were lower than those for peaks 6 and 12.
Fig. 8A shows that the principal active components involved in inhibiting protein tyrosine nitration were quercetin-3-O-glucuronide and quercetin-3-O-glucoside in peaks 6 and 12, respectively, with both compounds were identified as flavonoids, which was consistent with previous study.30 According to the sum of the total potency of the common peaks of the lotus leaf extracts (Fig. 8B), regions S1 and S8 exhibited lower total potency relative to the other regions. By contrast, regions S2, S3, and S14 showed higher total potencies, suggesting that extracts of lotus leaves from these regions exhibited better inhibitory activity.
 | ||
| Fig. 8 (A) Percentages of total potency of common peaks in various regions of lotus leaves; (B) the sum of total potency of common peaks in various regions of lotus leaves. | ||
4. Conclusion
In this study, we described a novel method for active fingerprinting of compounds from natural products and involved in inhibiting tyrosine nitration by employing HPLC-PDA coupled post-column tyrosine nitration reactions. Our results indicated that lotus leaf extracts exhibited obvious inhibitory activity against tyrosine nitration and the active information of 14 batches of lotus leaves were evaluated. The principal active compounds among these extracts were screened through the multiple treating of data. Quercetin-3-O-glucuronide and quercetin-3-O-glucoside were the principal active components involved in inhibiting protein tyrosine nitration. This method does not involve complex operations, and although insoluble active compounds ordinarily cannot be detected by HPLC, the use of a post-column reaction addresses this issue. These results showed that this technique was effective for screening natural active compounds involved in inhibiting protein tyrosine nitration, and that similar strategies could be potentially applied to evaluate the inhibitory activity of other natural products.Conflicts of interest
There are no conflicts to declare.Acknowledgements
This work was supported by grants from National Natural Scientific Foundation of China (No. 81473317), Qing Lan Project, the Science and Technology Development Fund of Macao SAR (013/2015/A1).References
- R. Radi, Proc. Natl. Acad. Sci. U. S. A., 2004, 101, 4003–4008 CrossRef CAS PubMed.
- J. M. Souza, G. Peluffo and R. Radi, Free Radical Biol. Med., 2008, 45, 357–366 CrossRef CAS PubMed.
- Y. Yonekura, I. Koshiishi, K.-i. Yamada, A. Mori, S. Uchida, T. Nakamura and H. Utsumi, Nitric Oxide, 2003, 8, 164–169 CrossRef CAS PubMed.
- J. S. Beckmann, Y. Z. Ye, P. G. Anderson, J. Chen, M. A. Accavitti, M. M. Tarpey and C. R. White, Biol. Chem. Hoppe-Seyler, 1994, 375, 81–88 CrossRef CAS PubMed.
- A. L. Guillozet-Bongaarts, F. Garcia-Sierra, M. R. Reynolds, P. M. Horowitz, Y. Fu, T. Wang, M. E. Cahill, E. H. Bigio, R. W. Berry and L. I. Binder, Neurobiol. Aging, 2005, 26, 1015–1022 CrossRef CAS PubMed.
- M. J. Mihm, C. M. Coyle, B. L. Schanbacher, D. M. Weinstein and J. A. Bauer, Cardiovasc. Res., 2001, 49, 798–807 CrossRef CAS PubMed.
- A. Ceriello, F. Mercuri, L. Quagliaro, R. Assaloni, E. Motz, L. Tonutti and C. Taboga, Diabetologia, 2001, 44, 834–838 CrossRef CAS PubMed.
- G. Ferrer-Sueta, N. Campolo, M. Trujillo, S. Bartesaghi, S. Carballal, N. Romero, B. Alvarez and R. Radi, Chem. Rev., 2018, 118, 1338–1408 CrossRef CAS PubMed.
- H. Inoue, K.-i. Hisamatsu, K. Ando, R. Ajisaka and N. Kumagai, Nitric Oxide, 2002, 7, 11–17 CrossRef CAS PubMed.
- J. P. Crow and J. S. Beckman, Methods, 1995, 7, 116–120 CrossRef CAS.
- S. Petruzzelli, R. Puntoni, P. Mimotti, N. PulerÁ, F. Baliva, E. D. O. Fornai and C. Giuntini, Am. J. Respir. Crit. Care Med., 1997, 156, 1902–1907 CrossRef CAS PubMed.
- E. Schwedhelm, D. Tsikas, F.-M. Gutzki and J. C. Frölich, Anal. Biochem., 1999, 276, 195–203 CrossRef CAS PubMed.
- F. Zhu, Food Hydrocolloids, 2017, 63, 332–348 CrossRef CAS.
- Y. Ono, E. Hattori, Y. Fukaya, S. Imai and Y. Ohizumi, J. Ethnopharmacol., 2006, 106, 238–244 CrossRef PubMed.
- E. Ohkoshi, H. Miyazaki, K. Shindo, H. Watanabe, A. Yoshida and H. Yajima, Planta Med., 2007, 73, 1255–1259 CrossRef CAS PubMed.
- R. Subashini and M. Rajadurai, Int. J. Pharma Bio Sci., 2011, 2, 285–294 Search PubMed.
- C.-M. Liu, C.-L. Kao, H.-M. Wu, W.-J. Li, C.-T. Huang, H.-T. Li and C.-Y. Chen, Molecules, 2014, 19, 17829–17838 CrossRef PubMed.
- H. A. Jung, J. E. Kim, H. Y. Chung and J. S. Choi, Arch. Pharmacal Res., 2003, 26, 279–285 CrossRef CAS.
- B. Huang, J. He, X. Ban, H. Zeng, X. Yao and Y. Wang, Meat Sci., 2011, 87, 46–53 CrossRef CAS PubMed.
- M. J. Wu, L. Wang, C. Y. Weng and J. H. Yen, Am. J. Chin. Med., 2003, 31, 687–698 CrossRef PubMed.
- Y. Kashiwada, A. Aoshima, Y. Ikeshiro, Y.-P. Chen, H. Furukawa, M. Itoigawa, T. Fujioka, K. Mihashi, L. M. Cosentino, S. L. Morris-Natschke and K.-H. Lee, Bioorg. Med. Chem., 2005, 13, 443–448 CrossRef CAS PubMed.
- J.-S. Yoon, H.-M. Kim, A. K. Yadunandam, N.-H. Kim, H.-A. Jung, J.-S. Choi, C.-Y. Kim and G.-D. Kim, Phytomedicine, 2013, 20, 1013–1022 CrossRef CAS PubMed.
- S. Nakamura, S. Nakashima, G. Tanabe, Y. Oda, N. Yokota, K. Fujimoto, T. Matsumoto, R. Sakuma, T. Ohta, K. Ogawa, S. Nishida, H. Miki, H. Matsuda, O. Muraoka and M. Yoshikawa, Bioorg. Med. Chem., 2013, 21, 779–787 CrossRef CAS PubMed.
- M.-Y. Yang, Y.-C. Chang, K.-C. Chan, Y.-J. Lee and C.-J. Wang, Eur. J. Integr. Med., 2011, 3, e153–e163 CrossRef.
- K. M. Robinson and J. S. Beckman, Methods Enzymol., 2005, 396, 207–214 CAS.
- J. S. Beckman, J. Chen, H. Ischiropoulos and J. P. Crow, Methods Enzymol., 1994, 233, 229–240 CAS.
- A. Saha, S. Goldstein, D. Cabelli and G. Czapski, Free Radical Biol. Med., 1998, 24, 653–659 CrossRef CAS PubMed.
- Y. Guo, X. Chen, J. Qi and B. Yu, J. Sep. Sci., 2016, 39, 2499–2507 CrossRef CAS PubMed.
- Y. Luo, J. Pan, Y. Pan, Z. Han and R. Zhong, Biosci., Biotechnol., Biochem., 2010, 74, 1350–1354 CrossRef CAS PubMed.
- C. G. M. Heijnen, G. R. M. M. Haenen, F. A. A. van Acker, W. J. F. van der Vijgh and A. Bast, Toxicol. in Vitro, 2001, 15, 3–6 CrossRef CAS PubMed.
Footnote |
| † Electronic supplementary information (ESI) available: Determination of ONOO− concentration. See DOI: 10.1039/c8ra07087c |
| This journal is © The Royal Society of Chemistry 2018 |


