DOI:
10.1039/C8RA06998K
(Paper)
RSC Adv., 2018,
8, 38259-38269
Adsorption of mercury(II) from water by a novel sPAN fiber containing sulfhydryl, carboxyl and amino groups
Received
21st August 2018
, Accepted 8th November 2018
First published on 14th November 2018
Abstract
A novel fiber containing sulfhydryl, carboxyl and amino groups (sPAN) with high adsorption capacity for mercury was facilely prepared by chemically grafting cysteine onto a commercial polyacrylonitrile (PAN) fiber in a one-step reaction. The as-prepared sPAN was characterized for its chemical structure, thermal stability, tensile strength, surface morphology and surface binding species. The adsorption and desorption performances for mercury were investigated by both batch and dynamic experiments. The results showed that sPAN was effective for mercury removal over pH 4–7, and ionic strength produced no obvious interference with the adsorption. The equilibrium adsorption capacity of mercury could be as high as 459.3 (±16.0) mg g−1, much higher than for most previously reported materials due to the strong interaction between mercury ions and sulfhydryl, carboxyl, amino groups. More than 99% adsorbed mercury could be eluted by the mixture of hydrochloric acid and thiourea, and the regenerated sPAN could be reused for mercury removal with no significant loss of adsorption capacity even after 10 cycles. The dynamic adsorption results indicated that at initial mercury concentrations of 0.1 and 1.0 mg L−1, the residual mercury concentration was less than 1 μg L−1, which could meet the criterion for drinking water. Moreover, at an initial mercury concentration of 10 mg L−1, the residual mercury concentration was less than 50 μg L−1, which could satisfy the Chinese national industry water discharge standard.
1. Introduction
Mercury, possessing high toxicity, mobility and bioaccumulation,1 is widely distributed in soil,2 the atmosphere,3 water,4 and food5 because of the discharge of wastewater and flue gas from chlor-alkali, plastic, battery and electronic industries. Mercury can cause renal poisoning, nerve injury, birth defects and chromosomal variation. Thus, mercury and its compounds are all listed as priority toxic pollutants.6 The limit values of drinking water and wastewater for mercury are set as 1 μg L−1 (ref. 7) and 50 μg L−1,8 respectively in China. Therefore, it is of significant importance to reduce the mercury concentration below the safety limit.
For the effective removal of mercury from drinking water and wastewater, a variety of physical and chemical strategies have been developed, including chemical precipitation,9 reverse osmosis10 and adsorption, etc., among which adsorption is considered as the most effective method. Several kinds of adsorbents have been developed such as biomass based adsorbents (lignocellulosic fiber,11–13 biochar,14,15 etc.), zeolite16 and functionalized adsorbents (sulfhydryl group-containing adsorbents,17–20 amino group-containing adsorbents,21–24 amidoxime group-containing adsorbents,25 and other nitrogen or sulfur group-containing adsorbents26–28). Since the adsorption efficiency is majorly dependent on the adsorbent properties, it is of vital importance to develop a more efficient adsorbent.1
It has been widely accepted that the functional fiber is a very promising adsorption material possessing high adsorption rate and large adsorption capacity due to its low mass transfer resistance and large external surface area.24 The kinds and amounts of functional groups in the adsorbents always affect the adsorption efficiency for heavy metal ions obviously.28 The sulfhydryl, carboxyl and amino groups have been found to be the effective chelating functional groups for mercury ions removal from aqueous solutions,29,30 because of their strong affinity towards mercury.18,20 However, the preparation of reported chelating fiber adsorbents always took more than two steps, and employed unfriendly reagents or radial. Such as, C. Liu et al.31 prepared PMPS chelating fiber by prepolymerization and coating, and the used mercaptopropylsilsesquioxane reagent was dangerous. R. Liu et al.32 prepared poly(acrylaminophosphonic)-type chelating fiber by hydrazine cross-linking, amination and aminophosphorylation, and the used hydrazine reagent was of high toxicity. N. Ma et al.24 prepared an amino group-containing chelating fiber through radiation and amination, and the γ-rays irradiation procedure was of great danger. In the present work, a novel fiber (sPAN) containing sulfhydryl, carboxyl and amino groups was prepared by grafting cysteine onto polyacrylonitrile (PAN) fiber with a one-step reaction and studied for its physicochemical properties and adsorption behaviours for mercury from aqueous solutions.
2. Experimental
2.1 Materials and reagents
Polyacrylonitrile (PAN) fiber (length 2–10 cm, linear density 1–5 dtex, content of acrylonitrile ≥90%) was obtained from Anqing Petrochemical Co. Ltd., P. R. China. Cysteine (analytical grade) was supplied by Wuhan Grand Hoyo Co., Ltd, P. R. China. All the other reagents (HgCl2, NaNO3, HCl, NaOH, CH4N2S, etc.) were of analytical grade, and used without further purification. The mercury stock solution of 1000 mg L−1 was prepared by dissolving HgCl2 in water, and the working mercury solutions were diluted from the stock solution.
2.2 Preparation of sPAN
The functionalization reaction of cysteine on PAN fiber was shown in Fig. 1. Firstly, 6.9 g cysteine was added into 250 mL glycerol and agitated until it became homogeneous. Then, 10 g PAN fiber was added, and the mixture was reacted for 5 h at 130 °C. After the reaction, the grafted fiber was washed with deionized water and dried for 12 h at 50 °C to constant weight. The weight gain ratio (ω%) was obtained according to the following formula:| |
 | (1) |
where W0 and W1 (g) are the weight of the original and grafted fiber, respectively.
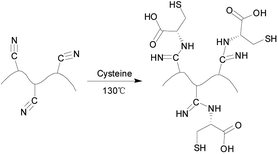 |
| | Fig. 1 The synthesis mechanism of sPAN fiber. | |
2.3 Characterization
Infrared spectra were obtained with a FT-IR Analyzer (Nicolet IR200, USA) in the wavenumbers range of 4000–400 cm−1. Thermo gravimetry (TG) Analyzer (Setaram Labsys Evo, France) was employed for thermal stability analyses. The thermograms were obtained under a nitrogen atmosphere at a uniform heating rate of 10 °C min−1 from 50 °C to 800 °C. The mechanical properties of the fibers were determined by tensile strength. All tensile tests were performed with an electronic tension machine (Lab think, China). The elemental analyzer of Flash 2000 (Thermo, America) was used to measure the elemental composition of sPAN. The morphology analyses and point scanning were carried out on a scanning electron microscope (SEM) of SU8020 with an energy dispersive spectrometer (EDS) HORIBA EX-350 (Hitachi, Japan), with an acceleration voltage of 3.0 kV. The binding energy and atomic ratio on the sorbents surface were analyzed with X-ray photoelectron spectroscopy (XPS) collected on an escalab 250Xi system (Thermo, USA) with monochromatic Al Kα radiation. The concentration of mercury in the various solution was analyzed with an atomic fluorescence spectrophotometer of PF6 (Persee, China).
2.4 Mercury removal
2.4.1 Batch adsorption. The weighed samples (0.025 g of each) were added into 100 mL mercury solutions in PE flasks under various mercury concentrations and pH values. Then the flasks were sealed and shaken for 15 h at a settled temperature in a thermostatic oscillator. The effect of solution initial pH on Hg(II) removal was studied by adjusting pH of the solution to 1.0–7.0 with 0.1 M HCl or NaOH. The effect of the initial mercury concentration was conducted in the range of 20–500 mg L−1, and the reaction time was investigated in the range of 0–7 h. The adsorption capacity was calculated as follows:| |
 | (2) |
where Q is the adsorption capacity (mg g−1), W is the weight of sPAN fiber (g), V is the solution volume (L), C0 and Ce are the mercury concentrations (mg L−1) before and after adsorption, respectively.
2.4.2 Batch desorption. Desorption experiments using different desorption solutions (mixture of 1 M HCl and 5% thiourea solution) were also conducted in a batch mode. The mercury saturated fibers were immersed into 25 mL desorption solutions, respectively. After 5 h, the mercury concentration of desorption solution was measured.
2.4.3 Dynamic adsorption. Dynamic adsorption experiments were further conducted to obtain the adsorption sensitive property for aqueous mercury removal. The mercury solutions were pumped upward through the sPAN fiber column (volume 5 mL, diameter 11.9 mm, length 45.0 mm, fiber mass 1.000 g) under a flux of 1.0 mL min−1 with a peristaltic pump. During the process, 1 mL fresh effluent was taken out at different adsorption time for determination of its mercury concentration.
3. Results and discussion
3.1 Structure of fibers
The sPAN fiber was prepared successfully by grafting cysteine on PAN fiber using a one-step reaction. The weight gain ratio was up to 29.3%, and the sulfur content of sPAN was 5.08% as obtained from elemental analysis. Fig. 2 showed the IR spectra of PAN, sPAN and sPAN chelated with mercury (Hg–sPAN). The peaks of PAN fiber can be assigned as follows: 3446 cm−1(γO–H), 2928 cm−1 and 2869 cm−1 (γC–H asymmetric and symmetric in CH, CH2 groups), 1452 cm−1 (δs C–H), 1383 cm−1 (δs CH2), 2243 cm−1 (γCN), 1732 cm−1 (γC![[double bond, length as m-dash]](https://www.rsc.org/images/entities/char_e001.gif) O of the second or third monomers, such as methyl acrylate, methyl methacrylate, 2-methylene-1,4-succinic acid), where γ and δs represented a stretching vibration and a scissor vibration, respectively. After cysteine grafting, the spectrum of sPAN changed obviously as compared with PAN fiber. The range of 3150–3750 cm−1 was much stronger and wider, which was probably due to the superposition of the absorption of the stretching vibrations of N–H in –NH and –NH2 groups of cysteine.24 Besides, the peak of 2243 cm−1 reduced significantly, and a new peak was observed at 748 cm−1 (γC–S). The peak of 1732 cm−1 disappeared and a new peak appeared at 1688 cm−1 (γC
O of the second or third monomers, such as methyl acrylate, methyl methacrylate, 2-methylene-1,4-succinic acid), where γ and δs represented a stretching vibration and a scissor vibration, respectively. After cysteine grafting, the spectrum of sPAN changed obviously as compared with PAN fiber. The range of 3150–3750 cm−1 was much stronger and wider, which was probably due to the superposition of the absorption of the stretching vibrations of N–H in –NH and –NH2 groups of cysteine.24 Besides, the peak of 2243 cm−1 reduced significantly, and a new peak was observed at 748 cm−1 (γC–S). The peak of 1732 cm−1 disappeared and a new peak appeared at 1688 cm−1 (γC![[double bond, length as m-dash]](https://www.rsc.org/images/entities/char_e001.gif) O in –COO−), which was probably because of the hydrolysis of ester in the second or third monomer and the grafting of cysteine during the functionalization process. These results indicated that cysteine has been grafted onto the PAN fiber through the reaction with CN groups. From the spectrum of Hg–sPAN, it can be seen that the peak of C–S at 748 cm−1 became weaker, the absorption band at 3050–3750 cm−1 got narrower, and the peak at 1398 cm−1 (γC–N) got a red shift to 1384 cm−1 and became stronger and more sharply, whereas the peaks at 1688 cm−1 (γC
O in –COO−), which was probably because of the hydrolysis of ester in the second or third monomer and the grafting of cysteine during the functionalization process. These results indicated that cysteine has been grafted onto the PAN fiber through the reaction with CN groups. From the spectrum of Hg–sPAN, it can be seen that the peak of C–S at 748 cm−1 became weaker, the absorption band at 3050–3750 cm−1 got narrower, and the peak at 1398 cm−1 (γC–N) got a red shift to 1384 cm−1 and became stronger and more sharply, whereas the peaks at 1688 cm−1 (γC![[double bond, length as m-dash]](https://www.rsc.org/images/entities/char_e001.gif) O) and 1630 cm−1 (δs N–H) became weaker. All these changes were probably ascribed to the complexing between mercury and amino, carboxyl and sulfhydryl groups.
O) and 1630 cm−1 (δs N–H) became weaker. All these changes were probably ascribed to the complexing between mercury and amino, carboxyl and sulfhydryl groups.
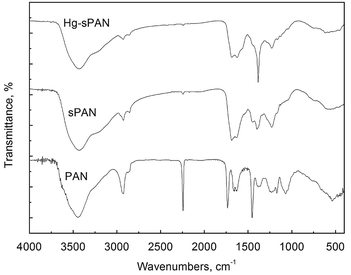 |
| | Fig. 2 FT-IR spectra of fibers. | |
3.2 Thermal and mechanical properties
The TG of PAN, sPAN and Hg–sPAN were presented in Fig. 3. In the case of PAN, there were two platforms and the starting decomposition temperature was 300 °C. It was believed that the first decomposition platform came from the cyclization of the –CN group, and the second was due to the cross-linked oxidation and dehydrogenation of macromolecular chains.33 For sPAN and Hg–sPAN TG curves, after the initial loss of moisture and desorption of gases at about 50–200 °C, there were still two platforms. The second platform of sPAN and Hg–sPAN corresponded to the first platform of PAN, however, the decomposed temperature was much lower than that of PAN because the CN groups were consumed during grafting process, and the third platform came from the grafted cysteine molecules or mercury. However, the residual mass (i.e. char yield) of Hg–sPAN fiber was substantially lower than that of sPAN and PAN fiber, probably due to the fact that the adsorbed mercury decomposed more completely. This result was in line with that reported by Coşkun et al.,34 who insisted that the char yield of heavy metal adsorbed fiber was less than that of original fiber. It should be mentioned that the strength of PAN and sPAN were 10.88 cN/tex and 10.42 cN/tex, respectively, indicating that the grafting process did no detrimental effect on mechanical strength of the raw PAN fiber.
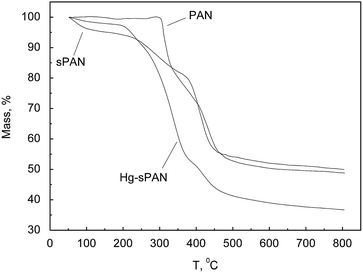 |
| | Fig. 3 TG curves of fibers. | |
3.3 Surface morphology
As mentioned above, the surface modification of PAN fiber with cysteine introduced amino, carboxyl and sulfhydryl groups on the surface of the fibers. Fig. 4 showed the SEM images of PAN, sPAN and Hg–sPAN fiber. It indicated that the diameter of sPAN was greater than that of PAN, which may be caused by the expansion of the fibers during the process of surface modification.35 Clearly, the surface of sPAN appeared many fish scale areas instead of the long ravines of PAN, possibly attributed to the graft of cysteine on the surface. In Fig. 4b and c, after mercury adsorption, the fish scale areas in the surface of sPAN appeared much more obvious, and there appeared many microstructures of polygonal form on Hg–sPAN fiber.
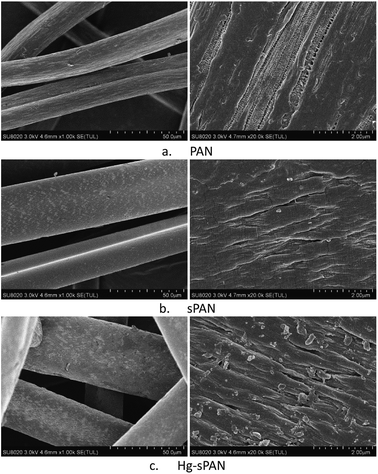 |
| | Fig. 4 SEM of fibers. | |
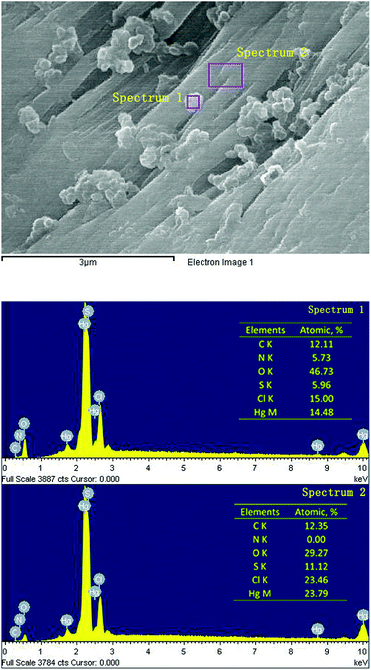
In order to get their chemical composition, SEM-EDS point scanning on and next to the microstructures (Fig. 5) were carried out. The elements distribution of the point on and next to the microstructures indicated that the microstructures of polygonal form seemed to show no significant relationship with mercury and the main elemental composition of microstructures might be carbon, nitrogen and oxygen.
 |
| | Fig. 5 SEM-EDS point scanning of Hg–sPAN. | |
3.4 Surface binding and speciation
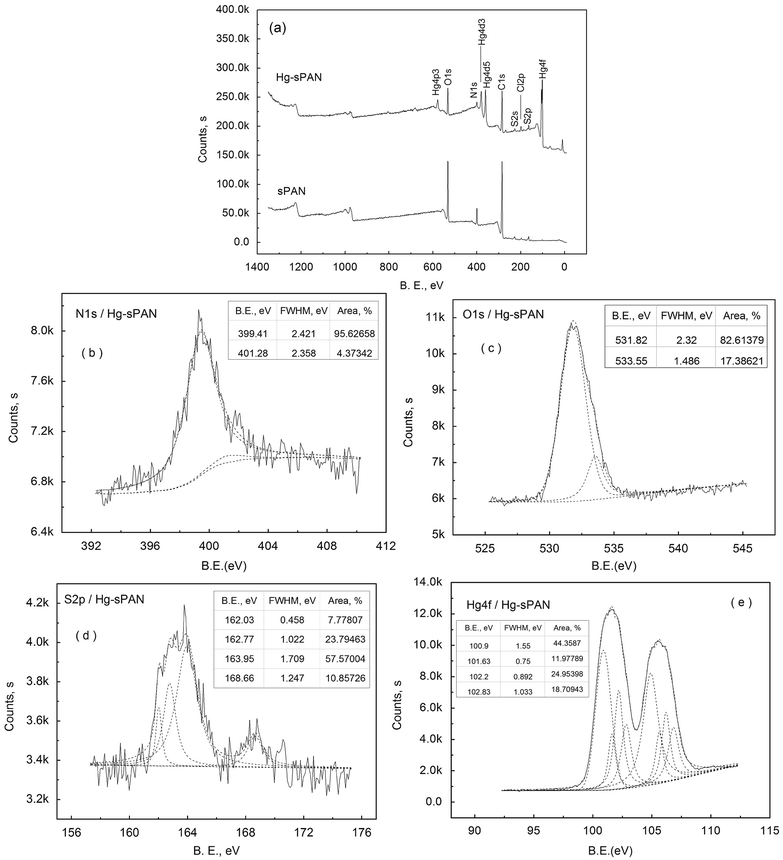
X-ray photoelectron spectroscopy (XPS) is useful in differentiating the forms of elements in a material and analyzing the interactions between adsorbents and adsorbates. The surface binding states and elemental speciations of sPAN and Hg–sPAN were analyzed by XPS and the data were presented in Fig. 6 and Table 1. The XPS spectra confirmed the presence of O1s and S2p on the sPAN surface, and Hg4f on the Hg–sPAN surface. The binding energy (B. E.) of O1s, N1s and S2p on the Hg–sPAN surface changed slightly as compared with those on sPAN (Table 1), which indicated that mercury sorption on the surface of sPAN was likely through the chemical complexing of mercury ions with those atoms (N, O and S) in amino, carboxyl and sulfhydryl functional groups.36,37 Analyses of N1s, O1s and S2p on Hg–sPAN (Fig. 6) revealed that the major N1s peaks came from nitrogen atoms in the groups of amino and cyano groups at 399.41 eV and 401.28 eV, respectively.35 The O1s peaks at 531.82 eV and 533.55 eV could be assigned to oxygen atoms in carboxyl and sulfo groups, respectively.36,38,39 The S2p peaks included sulphur atoms in disulfide, sulfhydryl and sulfo groups39 at 162.03 eV, 162.77–163.95 eV and 168.66 eV, respectively. It must be underlined that the doublet peeks at 162.77 eV and 163.95 eV were the S2p3/2 and S2p1/2 signals of sulfur in sulfhydryl groups (162.2 eV and 164.1 eV reported by G. Dodero et al.40), respectively. Two strong peaks of Hg4f appeared at 101.5 eV and 105.5 eV on Hg–sPAN surface, indicating that the mercury was adsorbed on the surface. The sorption was most likely through the complexation of mercury with amino, carboxyl and sulfhydryl groups on the surface of sPAN fiber. The binding energies of Hg4f at 101.5 eV and 105.5 eV were in agreement with the energy difference predicted by the spin–orbit splitting which presented that the Hg4f doublet could be well fitted into two peaks separated by a spin–orbit splitting of 4.0 eV.36 Furthermore, the Hg4f spectra also could be separated into the peaks from the binding of sulfhydryl, carboxyl and amino groups (![[double bond, length as m-dash]](https://www.rsc.org/images/entities/char_e001.gif) NH and –NH–) with mercury at 100.90 eV, 101.63 eV, 102.20 eV and 102.83 eV,38,41,42 respectively.
NH and –NH–) with mercury at 100.90 eV, 101.63 eV, 102.20 eV and 102.83 eV,38,41,42 respectively.
 |
| | Fig. 6 XPS survey scan and high-resolution scan of N1s, O1s, S2p and Hg4f for fibers (sPAN and Hg–sPAN). | |
Table 1 Binding energy and atomic percent of sPAN and Hg–sPAN
| |
C1s |
N1s |
O1s |
S2p |
Hg4f7/2 |
| sPAN (eV) |
284.75 |
399.56 |
531.57 |
163.76 |
|
| Hg–sPAN (eV) |
284.75 |
399.48 |
531.85 |
163.42 |
101.51 |
| sPAN/% |
68.33 |
9.71 |
16.80 |
5.16 |
|
| Hg–sPAN/% |
62.87 |
9.21 |
15.74 |
4.79 |
7.39 |
3.5 Batch adsorption
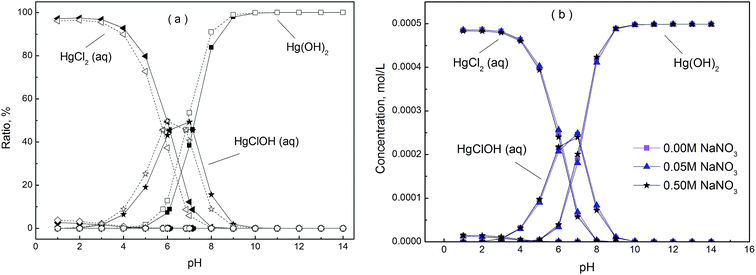
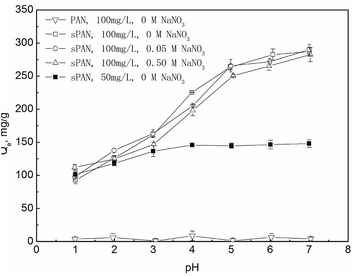
3.5.1 Effect of pH and ionic strength on adsorption. The pH of the solution has a significant effect on the type of mercury. The mercury speciation distribution at different pH and ionic strength in mercury chloride solutions was calculated by MINTEQ 3.1 software (Fig. 7). Results indicated that Hg(OH)2 predominated at a pH higher than 6.85 and 7.15, whereas HgCl2 (aq) mainly existed when the pH was lower than 5.80 and 6.10, at pH 5.80–6.85 and 6.10–7.15 the dominant species was HgClOH (aq), for 50 mg L−1 and 100 mg L−1 mercury solutions, respectively. Similar results have been reported in previous literatures.11,43,44 Previous experiments indicated when pH of the initial mercury solution of 50 mg L−1 was above 7.0, precipitation would occur; therefore the pH was evaluated in the range of 1.0–7.0. Besides, the adsorption performances were investigated at different ionic strength and initial concentrations (Fig. 8). It was noticed that the mercury adsorption performance by pristine PAN fiber was negligible at all the researched pH, whereas that by sPAN fiber was excellent due to the contribution of functional groups. For sPAN, the adsorption capacity increased with the increase of pH, and reached a plateau value at pH 4.0–7.0 and 5.0–7.0 for 50 mg L−1 and 100 mg L−1 mercury solutions, respectively. It could be attributed to the competitive adsorption of H+ and the change of mercury species with pH as pre described in Fig. 7. For the former reason, it was in line with the study of Liu et al.,45 in which they proposed that protons could compete with mercury and occupy the active adsorbent sites below pH 3.0. For the latter reason, HgCl2 (aq) predominated at lower pH, and it was more difficult to complexed than HgClOH (aq) and Hg(OH)2 for sPAN. It was obvious that sPAN could effectively remove mercury in a relatively wide pH range, and the optimum value were 4.0–7.0 and 5.0–7.0 for 50 mg L−1 and 100 mg L−1 mercury solutions, respectively, so the further adsorption experiments were carried out at pH 7.0 if not specified.
 |
| | Fig. 7 Mercury speciation distribution at different pH. (Hollow marks, 50 mg L−1. Solid marks, 100 mg L−1. T = 30 °C. The overlapped marks at the bottom belong to Hg2+, Hg2OH3+, Hg3(OH)33+, HgCl+, HgCl3−, HgCl42−, Hg(NO3)2, HgNO3+ and HgOH+). | |
 |
| | Fig. 8 Effect of pH and ionic strength on the adsorption capacity of sPAN for mercury (C0 = 50 mg L−1, t = 15 h, T = 30 °C). | |
For the effect of ionic strength on mercury removal, the experimental results were shown in Fig. 8a and 9. It indicated that NaNO3 had no significant effect on mercury speciation, and it didn't bring any obvious interference on the adsorption under all the investigated conditions. A different result was reported by Lv et al.,11 who claimed that Hg(II) adsorption by lignin decreased with the increasing ionic strength at pH < 5.0 and the difference disappeared at pH > 5.0. They contributed this phenomenon to the mechanism change from outer-sphere complexation at low pH to inner-sphere complexation at high pH. The negligible effect of NaNO3 on mercury adsorption by sPAN in this study indicated that the binding forces between mercury and sulfhydryl, carboxyl and amino groups in sPAN were much stronger than those carboxylic and phenolic groups in lignin.
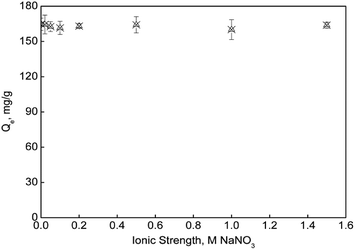 |
| | Fig. 9 Effect of ionic strength. (pH = 7.0, C0 = 50 mg L−1, T = 35 °C). | |
3.5.2 Adsorption isotherms. The equilibrium adsorption capacity of sPAN for mercury was investigated in a series of different initial concentrations of mercury solution. The results were shown in Fig. 10. It could be seen that with the increasing of equilibrium mercury concentration, the adsorption capacity increased until it reached a constant value (ca. 459.3 (±16.0) mg g−1), indicating the saturation of the functional sites by mercury adsorption on sPAN.
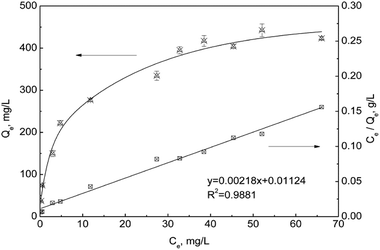 |
| | Fig. 10 Adsorption isotherm and linear fitting using Langmuir equation for the adsorption of mercury on sPAN (pH 7.0, t = 15 h, T = 30 °C). | |
For further study, the equilibrium data were fitted with the Langmuir adsorption equation as follows:
| |
 | (3) |
where
Qe and
Qm are the amount of mercury adsorbed onto sPAN at equilibrium and maximum (mg g
−1), respectively,
b is the adsorption equilibrium constant (L mg
−1) related to adsorption energy,
Ce is the equilibrium mercury concentration (mg L
−1). The plot of
Ce/
Qe vs. Ce for mercury was shown in
Fig. 10. The relationship between
Ce/
Qe and
Ce showed a linear curve (
R2 = 0.9881), which indicated that Langmuir isotherm model was suitable for describing the adsorption behavior of sPAN for mercury in aqueous solutions. From Langmuir equation, the
Qm and
b were calculated to be 459.3 (±16.0) mg g
−1 and 0.2044 (±0.04674) L mg
−1, respectively.
Table 2 showed the adsorption capacity of sPAN fiber in comparison with other adsorbents. It could be seen that the adsorption capacity of sPAN was much higher than most of other excellent mercury adsorbents presented in the literature. It might be due to the large quantity of amino, sulfydryl and carboxyl functional groups on the surface of sPAN and the strong affinity of sulfydryl and amino groups to mercury.
Table 2 The capacity of mercury adsorbents
| Adsorbents |
Adsorption Capacity, mg g−1 |
Ref. |
| sPAN |
459.3 (±16.0) |
This work |
| Thiol modified Fe3O4@SiO2 |
148.8 |
29 |
| Mercapto-functionalized-Fe3O4 |
129–256 |
47 |
| Mercapto functionalized magnetic Zr–MOF |
282 |
48 |
| Magnetic p(GMA–MMA–EGDMA) beads |
124.8 |
49 |
| Cationic exchange resin (PGCP–COOH) |
362.8 |
50 |
| Activated carbon prepared from Ceiba pentandra hulls |
25.88 |
51 |
| Biochars produced from Brazilian pepper BP300 |
24.2 |
14 |
| Sulfur-impregnated activated carbon ACS-400 |
800 |
52 |
| Graphene oxide MNPs |
16.6 |
53 |
| Diatomite |
68.1 |
54 |
| Chitosan-coated diatomite |
116.2 |
| Aminated chitosan beads |
438 |
55 |
| Mercury nano-trap |
1014 |
56 |
| Electrospun sulfur copolymers poly(SDIB)/PMMA fibers |
327.7 |
57 |
| Lignin separated from the by-product of the pulping of wood |
77.7 |
11 |
The Freundlich adsorption isotherm model was also applied to describe the adsorption of Hg(II) by sPAN, and its equation was as follows:
| |
 | (4) |
where
Ce and
Qe are the equilibrium concentration (mg L
−1) and the amount of mercury adsorbed onto sPAN at equilibrium (mg g
−1), respectively.
n and
Kf are Freundlich constants,
n give an indication of how favorable the adsorption process and
Kf (L
n/(g mg
(n−1))) is the parameter related to the adsorption capacity of the adsorbent. Linear plots of lg
![[thin space (1/6-em)]](https://www.rsc.org/images/entities/char_2009.gif) Qe versus
Qe versus lg
![[thin space (1/6-em)]](https://www.rsc.org/images/entities/char_2009.gif) Ce
Ce showed that the adsorption of Hg(
II) onto the sPAN fiber followed the Freundlich isotherm model (
R2 = 0.9633,
Fig. 11). The values of
n and
Kf were calculated from the slope and intercept of the plots as 2.41 ± 0.15 and 88.80 ± 6.74, respectively. The report of K. Kadirvelu,
et al.46 said that the value of
n between 1 and 10 represented an easy adsorption of adsorbate onto adsorbent. The value of
n obtained was 2.40 in this work, representing an easy adsorption of mercury onto sPAN.
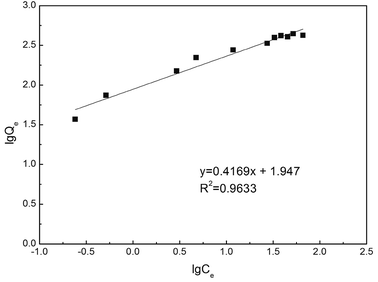 |
| | Fig. 11 Linear fitting using Freundlich equation for the adsorption of mercury on sPAN (pH 7.0, t = 15 h, T = 30 °C). | |
3.5.3 Adsorption kinetics. The adsorption kinetics of sPAN fiber for mercury were presented in Fig. 12, which showed the relationship of adsorption capacity for mercury on sPAN vs. reaction time t. It can be seen that mercury adsorption capacity by sPAN increased sharply with the increasing of reaction time and achieved the equilibrium after 2 h or 4 h for 50 or 100 mg L−1 original concentrations of mercury, respectively.
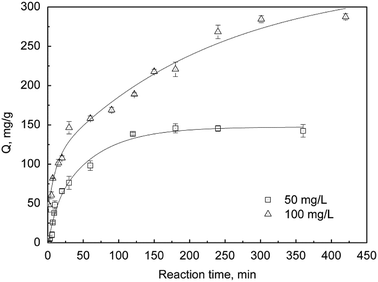 |
| | Fig. 12 Adsorption kinetics of sPAN for mercury ions with various concentrations (pH 7.0, T = 30 °C). | |
For further study of the adsorption kinetics, the pseudo-first-order and pseudo-second-order kinetic models were used to fit the kinetic experimental data. The pseudo-first-order and pseudo-second-order models of Lagergren were given as eqn (5) and (6), respectively.58
| |
ln(Qe − Qt) = ln![[thin space (1/6-em)]](https://www.rsc.org/images/entities/char_2009.gif) Qe − k1t Qe − k1t
| (5) |
| |
 | (6) |
where
Qe and
Qt (mg g
−1) are the adsorption amount of mercury at equilibrium and
t min, respectively. And
k1 (1/min) and
k2 (g
(mg
−1 min
−1)) are the rate constants of pseudo-first-order and pseudo-second-order models, respectively. Values of
k1 and
k2 for mercury adsorption onto sPAN are determined from the straight line plots of ln(
Qe −
Qt) and
t/
Qt versus t (
Fig. 13b). The fitting results (
Table 3) indicated that the data were fitted with a high correlation coefficient (
R2 > 0.9) by pseudo-first-order kinetic model for both 50 mg L
−1 and 100 mg L
−1 mercury solutions, whereas pseudo-second-order kinetic model only gave a high correlation coefficient (
R2 = 0.959) for 100 mg L
−1 mercury solutions. It was to say that the adsorption of mercury on sPAN was primarily a diffusion-controlled process for both 50 mg L
−1 and 100 mg L
−1 mercury solutions,
59 but when mercury concentration was increased up to 100 mg L
−1, the adsorption was also controlled by a chemisorption mechanism.
43,59 By comparing the
k1 value, we could conclude that the adsorption rate of 50 mg L
−1 mercury solution was higher than that of 100 mg L
−1 for the whole process. Similar results have been reported in previous literatures,
60–64 and there is more than one possible mechanism for this phenomenon. One of the mechanisms for this work could be a decrease of pH during the adsorption reaction which may involve the release of HCl due to the binding of HgCl
2 on the functional groups of the sPAN, as already observed on other adsorbent materials.
11,43 After a rapid initial increase of the adsorption capacity (
Fig. 12), the effect of a pH decrease could come into play significantly and can cause a decrease of the adsorption kinetics. This effect may be more pronounced at higher HgCl
2 initial concentrations.
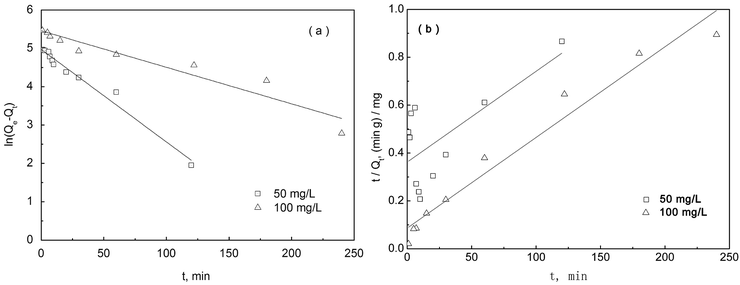 |
| | Fig. 13 Adsorption kinetics, (a) pseudo-first-order, (b) pseudo-second-order, (pH 7.0, T = 30 °C). | |
Table 3 Pseudo-first-order and pseudo-second-order parameters of adsorption kinetic curvesa
| Initial concentration (mg L−1) |
Qe (mg g−1) |
Pseudo-first-order |
Pseudo-second-order |
| Qe.cal (mg g−1) |
k1 (min−1) |
R2 |
Qe.cal (mg g−1) |
k2 (g (mg−1 min−1)) |
R2 |
| Qe.cal: calculated adsorption amount, mg g−1; Qe: experimental adsorption amount, mg g−1. |
| 50 |
145.5 ± 5.8 |
144.5 ± 7.5 |
0.024 ± 0.001 |
0.974 |
300.3 ± 104.6 |
(3.14 ± 0.48) × 10−5 |
0.419 |
| 100 |
284.5 ± 4.5 |
228.0 ± 26.1 |
0.0093 ± 0.001 |
0.908 |
265.2 ± 19.2 |
(1.88 ± 0.66) × 10−4 |
0.959 |
3.6 Desorption and reusability
In order to study the desorption of the adsorbed mercury on sPAN fiber, 1 M HCl (A) and 5% thiourea solution (B) mixtures were used considering the strong competition between H+ and mercury and strong chelation of thiourea with mercury. The desorption efficiencies of different mixed solutions were shown in Fig. 14. The desorption efficiencies were over 99% when the A/B ratio was in the range of 1![[thin space (1/6-em)]](https://www.rsc.org/images/entities/char_2009.gif) :
:![[thin space (1/6-em)]](https://www.rsc.org/images/entities/char_2009.gif) 0.667–1.5. Under the optimal desorption conditions, the reusability of sPAN for mercury removal was shown in Fig. 15. It was amazing to find that the amount of adsorption decreased by only 8.2% after 10 cycles of regeneration. This was better than most of previously reported materials, such as, PAF-1–SH (90%) after 3 cycles,56 Fe3O4@SiO2–SH (69%) after 5 cycles,29 etc. The regeneration results indicated that sPAN fiber had excellent mercury removal performance in aqueous solution, and its structure had good chemical stability under the experimental conditions.
0.667–1.5. Under the optimal desorption conditions, the reusability of sPAN for mercury removal was shown in Fig. 15. It was amazing to find that the amount of adsorption decreased by only 8.2% after 10 cycles of regeneration. This was better than most of previously reported materials, such as, PAF-1–SH (90%) after 3 cycles,56 Fe3O4@SiO2–SH (69%) after 5 cycles,29 etc. The regeneration results indicated that sPAN fiber had excellent mercury removal performance in aqueous solution, and its structure had good chemical stability under the experimental conditions.
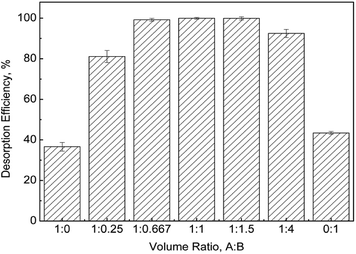 |
| | Fig. 14 Desorption efficiency vs. different desorption solutions (T = 30 °C). | |
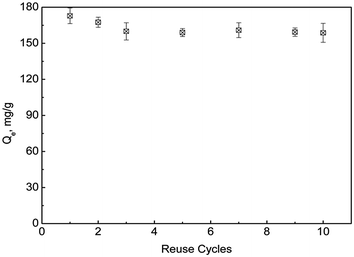 |
| | Fig. 15 Adsorption capacity vs. reuse cycles (T = 35 °C, C0 = 50 mg L−1). | |
3.7 Dynamic adsorption
The dynamic adsorption properties of sPAN at different initial mercury concentrations were investigated (Fig. 16). From the results, we could get that the residual mercury was lower than 1 μg L−1 for all the researched bed volumes (i.e. 0–110 BV) of 0.1 mg L−1 mercury solution and the initial 8 bed volumes of 1.0 mg L−1 mercury solution, and the residual mercury was higher than 1 μg L−1 but lower than 50 μg L−1 for all the researched bed volumes of 10 mg L−1 solution under the experimental conditions. The results indicated that sPAN fiber could not only be used for the purification of water containing low-concentration mercury to meet the Chinese standards for drinking water quality (GB 5749-2006), but also be used for high-concentration industry wastewater purification to meet the Chinese integrated wastewater discharge standard (GB 8978-1996).
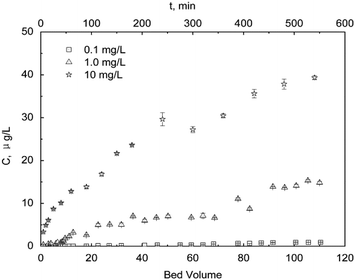 |
| | Fig. 16 Dynamic adsorption (T = 30 °C). | |
3.8 Adsorption mechanism
The ions of mercury with low-charge density was always considered as soft acid that could form a strong covalent bond to soft bases such as sulfhydryl group.65 Besides, mercury ions could complex strongly with amino groups by coordination through the nitrogen lone pair electrons.21 Furthermore, carboxyl could also catch mercury ions through ion exchange mechanism,46 but the affinity between carboxyl and mercury ions was weaker than sulfydryl and amino groups. For our work, the slight change of the B. E. of O1s, N1s and S2p in XPS before and after the adsorption indicated that mercury sorption on the surface of sPAN was likely through the chemical complexing of mercury ions with those atoms (N, O and S) in amino, carboxyl and sulfhydryl functional groups. In addition, the main mercury species in solution were HgClOH (aq), Hg(OH)2 and HgCl2 (aq) at pH 7 (Fig. 7), and the SEM-EDS point scanning (Fig. 5) showed that the atomic ratio between Hg and Cl was close to 1![[thin space (1/6-em)]](https://www.rsc.org/images/entities/char_2009.gif) :
:![[thin space (1/6-em)]](https://www.rsc.org/images/entities/char_2009.gif) 1, that was, chloride was also involved in the adsorption of mercury on sPAN, similarly with the previous report by Nam et al.66 and Baba et al.67 When using 1 M HCl or 5% thiourea solution as the desorption agent separately, the desorption efficiencies were only about 37% and 43% (Fig. 14), indicating that the adsorption process might involve both of coordination and ion exchange, and the affinity between mercury and the functional groups on sPAN was strong.
1, that was, chloride was also involved in the adsorption of mercury on sPAN, similarly with the previous report by Nam et al.66 and Baba et al.67 When using 1 M HCl or 5% thiourea solution as the desorption agent separately, the desorption efficiencies were only about 37% and 43% (Fig. 14), indicating that the adsorption process might involve both of coordination and ion exchange, and the affinity between mercury and the functional groups on sPAN was strong.
4. Conclusion
In conclusion, this study successfully prepared a novel fiber (sPAN) containing sulfhydryl, carboxyl and amino groups by grafting cysteine on PAN fiber with a one-step reaction, and the weight gain ratio was up to 29.3%. The characterization of chemical structure, thermal stability, tensile strength, surface morphology and surface binding species confirmed the existence of sulfhydryl, carboxyl and amino groups on the surface of sPAN. In addition, sPAN kept good mechanical strength as compared with the raw PAN, indicating the modification exhibited no detrimental effect on the fibrous adsorbent. The adsorption of mercury took place mainly on sulfhydryl, carboxyl and amino groups. Batch and dynamic mercury adsorption and desorption experiments indicated the good performance of sPAN for mercury removal. The equilibrium adsorption amount could be as high as 459.3 (±16.0) mg g−1, and more than 99% adsorbed mercury could be eluted by the mixture of hydrochloric acid and thiourea. Furthermore, the residual mercury concentration could meet the Chinese standards for drinking water quality and the Chinese integrated wastewater discharge standard as indicated from the dynamic adsorption tests.
Conflicts of interest
There are no conflicts to declare.
Acknowledgements
The authors gratefully acknowledge the financial support provided by the Program of Science and Technology of Henan province (172102310045 and 181100310100), Major Scientific and Technological project of Henan province (181100310100).
Notes and references
- X. Shen, Q. Wang, W. Chen and Y. Pang, Appl. Surf. Sci., 2014, 317, 1028–1034 CrossRef CAS.
- J. Wang, X. Feng, C. W. N. Anderson, Y. Xing and L. Shang, J. Hazard. Mater., 2012, 221–222, 1–18 CAS.
- X. Fu, X. Feng, J. Sommar and S. Wang, Sci. Total Environ., 2012, 421–422, 73–81 CrossRef CAS PubMed.
- A. Mousavi, R. D. Chávez, A. Ali and S. E. Cabaniss, Environ. Forensics, 2011, 12, 14–18 CrossRef CAS.
- M. Tuzen and M. Soylak, Bull. Environ. Contam. Toxicol., 2005, 74, 968–972 CrossRef CAS PubMed.
- F. Aboufazeli, H. Reza Lotfi Zadeh Zhad, O. Sadeghi, M. Karimi and E. Najafi, J. Macromol. Sci., Part A: Pure Appl. Chem., 2013, 50, 18–24 CrossRef CAS.
- C. M. o. Health, Chinese standards for drinking water quality, 2006, GB 5749-2006 Search PubMed.
- T. N. E. P. A. o. China, Integrated wastewater discharge standard of China, 1996, GB 8978-1996 Search PubMed.
- M. Matlock, B. S. Howerton and D. A. Atwood, J. Hazard. Mater., 2001, 84, 73–82 CrossRef CAS PubMed.
- M. Urgun-Demirtas, P. L. Benda, P. S. Gillenwater, M. C. Negri, H. Xiong and S. W. Snyder, J. Hazard. Mater., 2012, 215–216, 98–107 CrossRef CAS PubMed.
- J. Lv, L. Luo, J. Zhang, P. Christie and S. Zhang, Environ. Pollut., 2012, 162, 255–261 CrossRef CAS PubMed.
- G. Mahajan and D. Sud, J. Environ. Chem. Eng., 2013, 1, 1020–1027 CrossRef CAS.
- D. S. Malik, C. K. Jain and A. K. Yadav, Appl. Water Sci., 2017, 7, 2113–2136 CrossRef CAS.
- X. Dong, L. Ma, Y. Zhu, Y. Li and B. Gu, Environ. Sci. Technol., 2013, 47, 12156–12164 CrossRef CAS PubMed.
- H. Li, X. Dong, E. B. da Silva, L. M. de Oliveira, Y. Chen and L. Q. Ma, Chemosphere, 2017, 178, 466–478 CrossRef CAS PubMed.
- A. Chojnacki, K. Chojnacka, J. Hoffmann and H. Górecki, Miner. Eng., 2004, 17, 933–937 CrossRef CAS.
- V. Smuleac, D. Butterfield, S. Sikdar, R. Varma and D. Bhattacharyya, J. Membr. Sci., 2005, 251, 169–178 CrossRef CAS.
- A. Makkuni, L. G. Bachas, R. S. Varma, S. K. Sikdar and D. Bhattacharyya, Clean Technol. Environ. Policy, 2005, 7, 87–96 CrossRef CAS.
- H. Wu, C. Liao, Y. Pan, C. Yeh and H. Kao, Microporous Mesoporous Mater., 2009, 119, 109–116 CrossRef CAS.
- M. Yu, W. Tian, D. Sun, W. Shen, G. Wang and N. Xu, Anal. Chim. Acta, 2001, 428, 209–218 CrossRef CAS.
- X. Zhu and S. D. Alexandratos, Ind. Eng. Chem. Res., 2005, 44, 8605–8610 CrossRef CAS.
- R. S. Vieira and M. M. Beppu, Colloids Surf., A, 2006, 279, 196–207 CrossRef CAS.
- Q. Lv, Chemistry, 2007, 13, 6009–6018 CrossRef PubMed.
- N. Ma, Y. Yang, S. Chen and Q. Zhang, J. Hazard. Mater., 2009, 171, 288–293 CrossRef CAS PubMed.
- G. Zong, H. Chen, R. Qu, C. Wang and N. Ji, J. Hazard. Mater., 2011, 186, 614–621 CrossRef CAS PubMed.
- N. Bicak, D. C. Sherrington, S. Sungur and N. Tan, React. Funct. Polym., 2003, 54, 141–147 CrossRef CAS.
- R. Say, E. Birlik, Z. Erdemgil, A. Denizli and A. Ersöz, J. Hazard. Mater., 2008, 150, 560–564 CrossRef CAS PubMed.
- S. Kagaya, H. Miyazaki, M. Ito, K. Tohda and T. Kanbara, J. Hazard. Mater., 2010, 175, 1113–1115 CrossRef CAS PubMed.
- S. Zhang, Y. Zhang, J. Liu, Q. Xu, H. Xiao, X. Wang, H. Xu and J. Zhou, Chem. Eng. J., 2013, 226, 30–38 CrossRef CAS.
- A. Mehdinia, M. Akbari, T. Baradaran Kayyal and M. Azad, Environ. Sci. Pollut. Res., 2015, 22, 2155–2165 CrossRef CAS PubMed.
- C. Liu, Y. Huang, N. Naismith, J. Economy and J. Talbott, Environ. Sci. Technol., 2003, 37, 4261–4268 CrossRef CAS PubMed.
- R. Liu, H. Tang and B. Zhang, Chemosphere, 1999, 38, 3169–3179 CrossRef CAS.
- H. Bahrami, P. Bajaj and K. Sen, J. Appl. Polym. Sci., 2003, 88, 685–698 CrossRef.
- R. Coşkun, C. Soykan and M. Saçak, Sep. Purif. Technol., 2006, 49, 107–114 CrossRef.
- S. Deng and R. Bai, J. Colloid Interface Sci., 2004, 280, 36–43 CrossRef CAS PubMed.
- J. Zhu, B. Deng, J. Yang and D. Gang, Carbon, 2009, 47, 2014–2025 CrossRef CAS.
- C. Sun, R. Qu, C. Ji, Q. Wang, C. Wang, Y. Sun and G. Cheng, Eur. Polym. J., 2006, 42, 188–194 CrossRef CAS.
- A. M. Bond, W. Miao and C. Raston, Langmuir, 2000, 16, 6004–6012 CrossRef CAS.
- L. Setiawan, H. Baumann and D. Gribbin, Surf. Interface Anal., 1985, 7, 188–195 CrossRef CAS.
- G. Dodero, L. De Michieli, O. Cavalleri, R. Rolandi, L. Oliveri, A. Daccà and R. Parodi, Colloids Surf., A, 2000, 175, 121–128 CrossRef CAS.
- I. Nefedov, Y. V. Salyn, P. M. Solozhenkin and G. Y. Pulatov, Surf. Interface Anal., 2010, 2, 170–172 CrossRef.
- J. Wang, B. Deng, H. Chen, X. Wang and J. Zheng, Environ. Sci. Technol., 2009, 43, 5223–5228 CrossRef CAS PubMed.
- F. E. A. Arias, A. Beneduci, F. Chidichimo, E. Furiab and S. Strafacea, Chemosphere, 2017, 180, 11–23 CrossRef PubMed.
- K. J. Powell, P. L. Brown, R. H. Byrne, T. Gajda, G. Hefter, S. Sjoberg and H. Wanner, Pure Appl. Chem., 2005, 77, 739–800 CAS.
- Y. Liu, X. Chang, D. Yang, Y. Guo and S. Meng, Anal. Chim. Acta, 2005, 538, 85–91 CrossRef CAS.
- K. Kadirvelu, M. Kavipriya, C. Karthika, N. Vennilamani and S. Pattabhi, Carbon, 2004, 42, 745–752 CrossRef CAS.
- S. Pan, Y. Zhang, H. Shen and M. Hu, Chem. Eng. J., 2012, 210, 564–574 CrossRef CAS.
- B. Hu, L. Huang, M. He and B. Chen, J. Mater. Chem. A, 2016, 4, 5159–5166 RSC.
- G. Bayramoğlu and M. Y. Arica, J. Hazard. Mater., 2007, 144, 449–457 CrossRef PubMed.
- T. S. Anirudhan, L. Divya and M. Ramachandran, J. Hazard. Mater., 2008, 157, 620–627 CrossRef CAS PubMed.
- M. M. Rao, D. H. K. K. Reddy, P. Venkateswarlu and K. Seshaiah, J. Environ. Manage., 2009, 90, 634–643 CrossRef CAS PubMed.
- J. Wang, B. Deng, X. Wang and J. Zheng, Environ. Eng. Sci., 2009, 26, 1693–1699 CrossRef CAS.
- P. Diagboya, B. Olu-Owolabi and K. Adebowale, RSC Adv., 2014, 5, 2536–2542 RSC.
- N. Caner, A. Sarı and M. Tüzen, Ind. Eng. Chem. Res., 2015, 54, 7524–7533 CrossRef CAS.
- C. Jeon and K. Ha Park, Water Res., 2005, 39, 3938–3944 CrossRef CAS PubMed.
- B. Li, Y. Zhang, D. Ma, Z. Shi and S. Ma, Nat. Commun., 2014, 5, 5537 CrossRef CAS PubMed.
- M. Thielke, L. Bultema, D. Brauer, B. Richter, M. Fischer and P. Theato, Polymers, 2016, 8, 266 CrossRef.
- M. Razvigorova, T. Budinova, N. Petrov and V. Minkova, Water Res., 1998, 32, 2135–2139 CrossRef CAS.
- J. P. Simonin, Chem. Eng. J., 2016, 300, 254–263 CrossRef CAS.
- Z. H. Mussa, F. F. Al-Qaim, M. R. Othman, M. P. Abdullah, J. Latip and Z. Zakria, J. Taiwan Inst. Chem. Eng., 2017, 72, 37–44 CrossRef CAS.
- B. H. Hameed and A. A. Rahman, J. Hazard. Mater., 2008, 160, 576–581 CrossRef CAS PubMed.
- Z. Reddad, C. Gerente, Y. Andres and P. Le Cloirec, Environ. Sci. Technol., 2002, 36, 2067–2073 CrossRef CAS PubMed.
- Y. Li, P. Zhang, Q. Du, X. Peng, T. Liu, Z. Wang, Y. Xia, W. Zhang, K. Wang, H. Zhu and D. Wu, J. Colloid Interface Sci., 2011, 363, 348–354 CrossRef CAS PubMed.
- F. C. Wu, R. L. Tseng and R. S. Juang, Water Res., 2001, 35, 613–618 CrossRef CAS PubMed.
- L. Y. Blue, P. Jana and D. A. Atwood, Fuel, 2010, 89, 1326–1330 CrossRef CAS.
- K. H. Nam, S. Gomez-Salazar and L. Tavlarides, Ind. Eng. Chem. Res., 2003, 42, 1955–1964 CrossRef CAS.
- Y. Baba, K. Ohe, Y. Kawasaki and S. D. Kolev, React. Funct. Polym., 2006, 66, 1158–1164 CrossRef CAS.
|
| This journal is © The Royal Society of Chemistry 2018 |
Click here to see how this site uses Cookies. View our privacy policy here.  Open Access Article
 a,
Jing Wang
 a,
Li Changb,
Liang Zhao*a,
Zhenbang Tiana,
Zuohua Huanga and
Weiqing Huanga


![[double bond, length as m-dash]](https://www.rsc.org/images/entities/char_e001.gif) O of the second or third monomers, such as methyl acrylate, methyl methacrylate, 2-methylene-1,4-succinic acid), where γ and δs represented a stretching vibration and a scissor vibration, respectively. After cysteine grafting, the spectrum of sPAN changed obviously as compared with PAN fiber. The range of 3150–3750 cm−1 was much stronger and wider, which was probably due to the superposition of the absorption of the stretching vibrations of N–H in –NH and –NH2 groups of cysteine.24 Besides, the peak of 2243 cm−1 reduced significantly, and a new peak was observed at 748 cm−1 (γC–S). The peak of 1732 cm−1 disappeared and a new peak appeared at 1688 cm−1 (γC
O of the second or third monomers, such as methyl acrylate, methyl methacrylate, 2-methylene-1,4-succinic acid), where γ and δs represented a stretching vibration and a scissor vibration, respectively. After cysteine grafting, the spectrum of sPAN changed obviously as compared with PAN fiber. The range of 3150–3750 cm−1 was much stronger and wider, which was probably due to the superposition of the absorption of the stretching vibrations of N–H in –NH and –NH2 groups of cysteine.24 Besides, the peak of 2243 cm−1 reduced significantly, and a new peak was observed at 748 cm−1 (γC–S). The peak of 1732 cm−1 disappeared and a new peak appeared at 1688 cm−1 (γC![[double bond, length as m-dash]](https://www.rsc.org/images/entities/char_e001.gif) O in –COO−), which was probably because of the hydrolysis of ester in the second or third monomer and the grafting of cysteine during the functionalization process. These results indicated that cysteine has been grafted onto the PAN fiber through the reaction with CN groups. From the spectrum of Hg–sPAN, it can be seen that the peak of C–S at 748 cm−1 became weaker, the absorption band at 3050–3750 cm−1 got narrower, and the peak at 1398 cm−1 (γC–N) got a red shift to 1384 cm−1 and became stronger and more sharply, whereas the peaks at 1688 cm−1 (γC
O in –COO−), which was probably because of the hydrolysis of ester in the second or third monomer and the grafting of cysteine during the functionalization process. These results indicated that cysteine has been grafted onto the PAN fiber through the reaction with CN groups. From the spectrum of Hg–sPAN, it can be seen that the peak of C–S at 748 cm−1 became weaker, the absorption band at 3050–3750 cm−1 got narrower, and the peak at 1398 cm−1 (γC–N) got a red shift to 1384 cm−1 and became stronger and more sharply, whereas the peaks at 1688 cm−1 (γC![[double bond, length as m-dash]](https://www.rsc.org/images/entities/char_e001.gif) O) and 1630 cm−1 (δs N–H) became weaker. All these changes were probably ascribed to the complexing between mercury and amino, carboxyl and sulfhydryl groups.
O) and 1630 cm−1 (δs N–H) became weaker. All these changes were probably ascribed to the complexing between mercury and amino, carboxyl and sulfhydryl groups.
![[double bond, length as m-dash]](https://www.rsc.org/images/entities/char_e001.gif) NH and –NH–) with mercury at 100.90 eV, 101.63 eV, 102.20 eV and 102.83 eV,38,41,42 respectively.
NH and –NH–) with mercury at 100.90 eV, 101.63 eV, 102.20 eV and 102.83 eV,38,41,42 respectively.


![[thin space (1/6-em)]](https://www.rsc.org/images/entities/char_2009.gif) Qe versus lg
Qe versus lg![[thin space (1/6-em)]](https://www.rsc.org/images/entities/char_2009.gif) Ce showed that the adsorption of Hg(II) onto the sPAN fiber followed the Freundlich isotherm model (R2 = 0.9633, Fig. 11). The values of n and Kf were calculated from the slope and intercept of the plots as 2.41 ± 0.15 and 88.80 ± 6.74, respectively. The report of K. Kadirvelu, et al.46 said that the value of n between 1 and 10 represented an easy adsorption of adsorbate onto adsorbent. The value of n obtained was 2.40 in this work, representing an easy adsorption of mercury onto sPAN.
Ce showed that the adsorption of Hg(II) onto the sPAN fiber followed the Freundlich isotherm model (R2 = 0.9633, Fig. 11). The values of n and Kf were calculated from the slope and intercept of the plots as 2.41 ± 0.15 and 88.80 ± 6.74, respectively. The report of K. Kadirvelu, et al.46 said that the value of n between 1 and 10 represented an easy adsorption of adsorbate onto adsorbent. The value of n obtained was 2.40 in this work, representing an easy adsorption of mercury onto sPAN.

![[thin space (1/6-em)]](https://www.rsc.org/images/entities/char_2009.gif) Qe − k1t
Qe − k1t

![[thin space (1/6-em)]](https://www.rsc.org/images/entities/char_2009.gif) :
:![[thin space (1/6-em)]](https://www.rsc.org/images/entities/char_2009.gif) 0.667–1.5. Under the optimal desorption conditions, the reusability of sPAN for mercury removal was shown in Fig. 15. It was amazing to find that the amount of adsorption decreased by only 8.2% after 10 cycles of regeneration. This was better than most of previously reported materials, such as, PAF-1–SH (90%) after 3 cycles,56 Fe3O4@SiO2–SH (69%) after 5 cycles,29 etc. The regeneration results indicated that sPAN fiber had excellent mercury removal performance in aqueous solution, and its structure had good chemical stability under the experimental conditions.
0.667–1.5. Under the optimal desorption conditions, the reusability of sPAN for mercury removal was shown in Fig. 15. It was amazing to find that the amount of adsorption decreased by only 8.2% after 10 cycles of regeneration. This was better than most of previously reported materials, such as, PAF-1–SH (90%) after 3 cycles,56 Fe3O4@SiO2–SH (69%) after 5 cycles,29 etc. The regeneration results indicated that sPAN fiber had excellent mercury removal performance in aqueous solution, and its structure had good chemical stability under the experimental conditions.
![[thin space (1/6-em)]](https://www.rsc.org/images/entities/char_2009.gif) :
:![[thin space (1/6-em)]](https://www.rsc.org/images/entities/char_2009.gif) 1, that was, chloride was also involved in the adsorption of mercury on sPAN, similarly with the previous report by Nam et al.66 and Baba et al.67 When using 1 M HCl or 5% thiourea solution as the desorption agent separately, the desorption efficiencies were only about 37% and 43% (Fig. 14), indicating that the adsorption process might involve both of coordination and ion exchange, and the affinity between mercury and the functional groups on sPAN was strong.
1, that was, chloride was also involved in the adsorption of mercury on sPAN, similarly with the previous report by Nam et al.66 and Baba et al.67 When using 1 M HCl or 5% thiourea solution as the desorption agent separately, the desorption efficiencies were only about 37% and 43% (Fig. 14), indicating that the adsorption process might involve both of coordination and ion exchange, and the affinity between mercury and the functional groups on sPAN was strong.


