 Open Access Article
Physical modification of biochar to expose the inner pores and their functional groups to enhance lead adsorption†
Alaa Hasan Fahmi ab,
Abd Wahid Samsuri
 *a,
Hamdan Jola and
Daljit Singha
aDepartment of Land Management, Faculty of Agriculture, Universiti Putra Malaysia, 43400 UPM Serdang, Selangor, Malaysia. E-mail: samsuriaw@upm.edu.my; Tel: +60389474864
bDepartment of Soil Science and Water Resources, College of Agriculture, University of Diyala, Diyala, Iraq
First published on 14th November 2018
Abstract
Biochars have been successfully used to treat wastewater and contaminated soils. The efficiency of biochar as a biosorbent of heavy metals can be increased by reducing the particle size, exposing the inner pores and their functional groups. In this study, the empty fruit bunch biochar (EFBB) of oil palm was separated into three particle sizes, fine (F-EFBB < 50 μm), medium (M-EFBB 250–500 μm) and coarse (C-EFBB > 2000 μm) to compare their physical and chemical characteristics and their adsorption capacity for lead. Results revealed that the F-EFBB had greater surface area and exposed more micropores compared to the other particle sizes. Similarly, the F-EFBB had the most oxygen containing functional groups, CEC, and negative charges as measured by the zeta potential. The F-EFBB had the highest adsorption capacity for Pb, followed by M-EFBB and C-EFBB with the lowest. Therefore, the F-EFBB are able to adsorb more heavy metals as compared to M-EFBB and C-EFBB, as suggested by the more favourable physical and chemical characteristics.
Introduction
Biochar has been used as an option to treat heavy metal contamination in soil and water.1 Biochar is a carbon-rich product made by charring feedstocks, mainly from the biological by-products in the absence of air. The use of biochar as a biosorbent for the treatment of wastewater and soil contaminated with heavy metals is a better alternative to conventional high cost sorbents such as activated carbon.2Existing research suggests the types of feedstock and pyrolysis temperature are responsible for the structure and properties of biochars.3 The porosity, functional groups and surface area of biochars are controlled by production temperature, heating rate, pressure, retention time and ash content.4 The biochar produced at low temperature pyrolysis (<500 °C) has higher cation exchange capacity (CEC),5 nitrogen content, exchangeable bases and number of functional groups.6 The low temperature biochar production also produces a higher yield7 while consuming less energy.8 However, the biochar produced at a low temperature has low pH and surface area and contains unexposed functional groups which results in biochar with low adsorption capacity for heavy metals and organic pollutants.9 The resulting low surface area and unexposed functional groups of biochar produced at low temperatures can be attributed to pore closing or blockage by volatile materials10 and ash,11 or to the bottle neck phenomenon.12 Therefore, the properties of biochar must be improved before it can be used efficiently as a biosorbent for heavy metals.
Biochar pore size and surface functional groups are important properties affecting its efficiency as an adsorbent of heavy metals.11,12 A biochar's high adsorption capacity for metals can be attributed to the functional group, zeta potential and CEC.13 The adsorption of metals by biosorbents can be via complexation between the metals and various functional groups on the surface of the biosorbents, or electrostatic attractions between metal cations with negative charges and the functional groups.14 According to Mohan et al.,15 functional groups can be found throughout the biochar matrix. Therefore, crushing the biochar will expose the functional groups which can adsorb the metals. Moreover, the heavy metal adsorption by biochar can take place both on the surface (outer pores) and inside the pore structure of the biochar (inner pores).16 According to the terminology used by the International Union of Pure and Applied Chemistry (IUPAC), pores can be divided into three sizes: micropores (<2 nm), mesopores (2–50 nm), and macropores (>50 nm).17 The micropores and mesopores are more important in the adsorption of heavy metals3 and are located mainly inside the pore structure of the biochar, hence the term inner pores. It has been suggested that the macropores (>50 nm) behave as a channel that transports heavy metals to the micro- and mesopores because adsorption occurs only at the walls and not in the void volume of the pores.10,17 If the macropores channelling the heavy metals to the meso- and micropores are blocked, the adsorption capacity of biochar for heavy metals will be reduced. Several previous studies have suggested if the macropores are blocked, the ability of the inner pores to adsorb metals will be reduced.4
Crushing biochar into smaller particle sizes has been used to improve the adsorptive capacity of biochar for heavy metals. However, all previous studies used biochars with particle sizes much larger than 50 μm in treating wastewater and contaminated soils and the authors found particle size had very little effect on the adsorption of heavy metals.18,19 One possible reason is the bottlenecks in the biochars were still present even though the particle size had been reduced. Therefore, crushing the biochars into particle sizes much larger than 50 μm did not increase the adsorption capacity of the biochars because the inner pores of the biochar porous structure were still not exposed. Dieguez-Alonso12 mentions the biochar particle size should be at least two orders of magnitude larger than the maximum size of the expected pores. For instance, if we expect pore diameters up to 100 nm, the minimum particle size of the biochar should be >10 μm. Therefore, to expose micro (<2 nm) and mesopores (2–50 nm) the size selected should be <50 μm to increase the destruction of macropores (less important) and expose the maximum number of micro and mesopores on the surface of the biochar. Therefore, this study offers a relatively simple and environmentally friendly method of biochar modification to enhance its capacity to adsorb heavy metals. The biochar was physically modified by pulverizing it into a very fine particle size and compared its Pb adsorption capacity with coarser particle biochars.
To be best of our knowledge, there is no reported study on the effects of biochar particle size reduction to <50 μm on its properties, especially on the exposure of inner pores and surface functional groups. Therefore, in this study an empty fruit bunch biochar (EFBB) produced by low temperature pyrolysis (250 °C) was crushed to a particle size <50 μm and its physicochemical properties and adsorption capacity for lead (Pb) compared with the same EFBB having larger particle sizes (0.25–0.5 mm and >2 mm). We hypothesised that crushing the EFBB to <50 μm would expose the inner pores and their surface functional groups and as a result increase its adsorption capacity for Pb. The objective of this study was to determine the effect of physical modification of EFBB by crushing its physicochemical properties, especially those related to adsorptive capacity for heavy metals.
Materials and methods
Chemicals and reagents
All the chemical reagents were of analytical grade and the solutions were prepared using a Milli-Q system (Direct-Q® 3 UV) of ultrapure water (18.2 MΩ cm−1 electrical resistivity). Analytical grade sodium nitrate (NaNO3) with 99.99% purity was purchased from Sigma-Aldrich (USA) while barium chloride (BaCl2; 98.00% purity), sodium bicarbonate (NaHCO3; >99.70% purity), sodium carbonate (Na2CO3; 99.90% purity), sodium hydroxide (99.00% purity), hydrochloric acid (HCl; 37.00% ACS grade), nitric acid (HNO3; 65.00% GR grade) and phenolphthalein (C20H14O4; 99.00% ACS grade) were purchased from Merck (Germany).Biochar samples
Empty fruit bunch biochar (EFBB) was purchased from the Malaysian Palm Oil Board (MPOB), located in Bangi Lama, Selangor, Malaysia. The biochar was prepared using low-temperature (250 °C) slow pyrolysis. The biochar was brought to the laboratory where it was lightly crushed using a pestle and mortar and then passed through metal sieves (laboratory test sieve Endecotts Ltd., United Kingdom) to separate into two different particle sizes; coarse EFBB (>2 mm; C-EFBB) and medium EFBB (0.25–0.5 mm; M-EFBB). The fine EFBB (<50 μm; F-EFBB) was produced by milling the EFBB with a planetary milling machine (Pulverisette 4 Vario-Planetary Mill) set at 1200 rpm for 3 h. All three biochar samples (C-EFBB, M-EFBB and F-EFBB) were kept at room temperature prior to analysis.Physical analysis
Chemical analysis
![[thin space (1/6-em)]](https://www.rsc.org/images/entities/char_2009.gif) :
:![[thin space (1/6-em)]](https://www.rsc.org/images/entities/char_2009.gif) 5 (w/v) and agitated for 24 h. The reading was recorded using a CON 700 EC meter (Eutech Instruments, USA).
5 (w/v) and agitated for 24 h. The reading was recorded using a CON 700 EC meter (Eutech Instruments, USA).
 | (1) |
 | (2) |
 | (3) |
log![[thin space (1/6-em)]](https://www.rsc.org/images/entities/char_2009.gif) Qe = log Qe = log![[thin space (1/6-em)]](https://www.rsc.org/images/entities/char_2009.gif) KF + 1/n KF + 1/n![[thin space (1/6-em)]](https://www.rsc.org/images/entities/char_2009.gif) log log![[thin space (1/6-em)]](https://www.rsc.org/images/entities/char_2009.gif) Ce Ce
| (4) |
 | (5) |
 | (6) |
RL > 1, unfavourable; RL = 1, Linear; 0 < RL < 1, favourable; and RL = 0, irreversible.
Statistical analysis
Statistical analysis was carried out using SAS version 9.4 to determine significant differences in physicochemical properties between the different EFBB samples.Results and discussion
Physical properties
| Parameters | C-EFBB | M-EFBB | F-EFBB |
|---|---|---|---|
| a ND: Not detected. | |||
| Ash content (%) | 15.383 ± 0.066a | 15.461 ± 0.957a | 14.771 ± 0.043a |
| pH | 9.333 ± 0.035b | 9.360 ± 0.02b | 9.603 ± 0.025a |
| EC (dS m−1) | 8.250 ± 0.02c | 9.633 ± 0.120b | 11.407 ± 0.150a |
| Total C (%) | 61.817 ± 0.511a | 61.817 ± 0.511a | 61.817 ± 0.511a |
| O (%) | 17.967 ± 0.559a | 17.860 ± 0.484a | 18.580 ± 1.483a |
| H (%) | 3.627 ± 0.005a | 3.627 ± 0.005a | 3.627 ± 0.005a |
| S (%) | 0.109 ± 0.001a | 0.109 ± 0.001a | 0.109 ± 0.001a |
| N (%) | 1.096 ± 0.011a | 1.096 ± 0.011a | 1.096 ± 0.011a |
| K (%) | 4.124 ± 0.018a | 4.124 ± 0.018a | 4.124 ± 0.018a |
| Si (%) | 0.048 ± 0.003a | 0.048 ± 0.003a | 0.048 ± 0.003a |
| H/C ratio | 0.058 ± 0.000a | 0.058 ± 0.000a | 0.058 ± 0.000a |
| O/C ratio | 0.290 ± 0.011a | 0.289 ± 0.026a | 0.301 ± 0.010a |
| (O + N)/C ratio | 0.308 ± 0.011a | 0.307 ± 0.026a | 0.318 ± 0.010a |
| Al (%) | 0.044 ± 0.003a | 0.044 ± 0.003a | 0.044 ± 0.003a |
| Ca (%) | 0.023 ± 0.001a | 0.023 ± 0.001a | 0.023 ± 0.001a |
| Mg (%) | 0.186 ± 0.005a | 0.186 ± 0.005a | 0.186 ± 0.005a |
| Na (%) | 0.031 ± 0.002a | 0.031 ± 0.002a | 0.031 ± 0.002a |
| P (%) | 0.026 ± 0.004a | 0.026 ± 0.004a | 0.026 ± 0.004a |
| Fe (%) | 0.159 ± 0.002a | 0.159 ± 0.002a | 0.159 ± 0.002a |
| Total oxygen-containing functional groups (meq g−1) | 0.470 ± 0.002c | 0.475 ± 0.008b | 0.490 ± 0.005a |
| OH group (meq g−1) | 0.150 ± 0.000b | 0.152 ± 0.002ab | 0.153 ± 0.001a |
| CO group (meq g−1) | 0.093 ± 0.002a | 0.092 ± 0.004a | 0.091 ± 0.003a |
| COOH group (meq g−1) | 0.227 ± 0.002b | 0.230 ± 0.003b | 0.245 ± 0.002a |
| CEC cmol(+)kg−1 by (BaCl2) | 1.842 ± 0.506c | 8.100 ± 0.312b | 16.464 ± 0.280a |
| BET surface area (m2 g−1) | 0.90 | 1.70 | 2.57 |
| Total pore volume (cm3 g−1) | 0.239 | 0.327 | 0.285 |
| Micropore surface area (m2 g−1) | ND | ND | 2.533 |
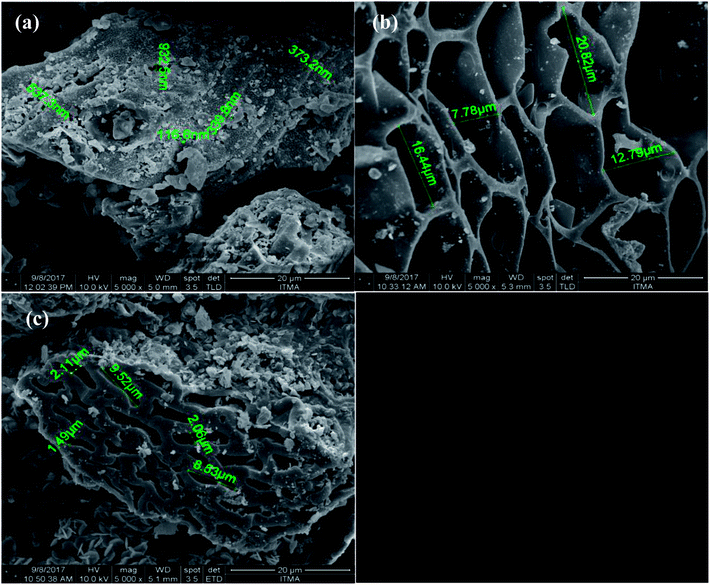
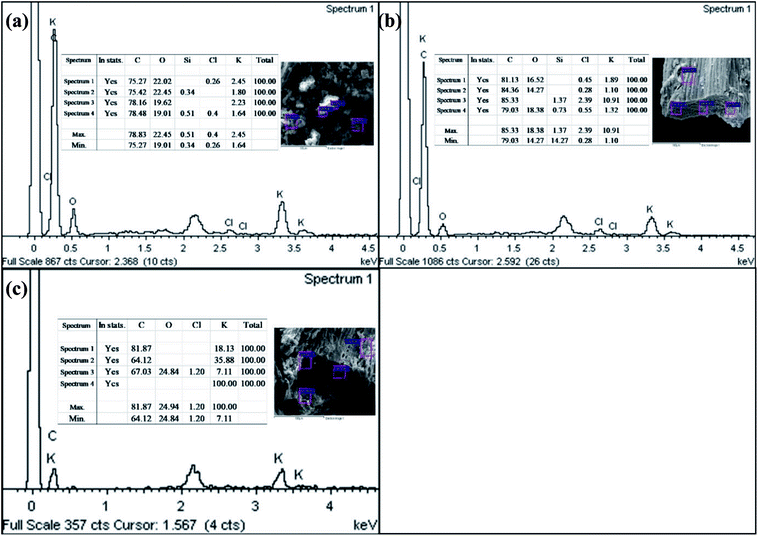
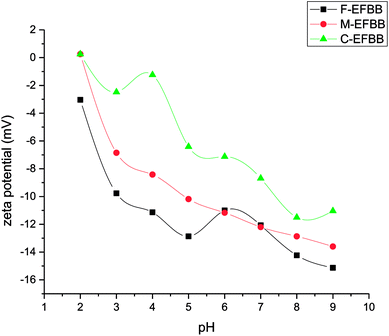
Crushing the EFBB to <50 μm significantly, the smaller size of pores exposed. The Electron Dispersive Spectroscopy (EDS) spectra (Fig. 2) revealed the dominant elements in the EFBB samples. The percentage of oxygen increased as the particle size was reduced, suggesting that crushing the EFBB sample to <50 μm particle size exposed the oxygen functional groups of the biochar. Even though the EDS spectra can only provide qualitative and semi-quantitative information regarding the elemental contents of the biochars, the data are well supported by the data of PZC (Fig. 4), CEC, total acidic functional groups, total oxygen content, O/C ratio and O + N/C ratio (Table 1).
The larger pore diameters of the M-EFBB resulted in higher total pore volume when compared to C-EFBB (Table 1). The lower pore volume of C-EFBB could be due to blockage of the pores.10 According to Dieguez Alonso,12 sample crushing is important to reduce pore diffusion limitations caused by the bottleneck phenomenon, especially for samples with micropores. The F-EFBB had more exposed inner pores, hence a higher surface area (Table 1).
The BET values reported in this study are in the range of values reported by previous researchers.26 The authors observed that the BET values of oak wood and oak bark biochars measured on dry samples was very small (1–3 m2 g−1) compared to commercial activated carbon (∼1000 m2 g−1). However, the maximum adsorption of Cr by these biochars were higher than the commercial activated carbon. The authors attributed this to the swelling of biochar in water and opening of pores and adsorption sites that were otherwise closed when biochar was dry, thus provided more internal adsorption sites for Cr adsorption. Moreover, the BET values of EFB biochars in this study are in the range as reported for EFBB biochar in other studies such as Yavari et al.27 (1.46 m2 g−1) and Samsuri et al.13 (1.890 m2 g−1).
Chemical properties
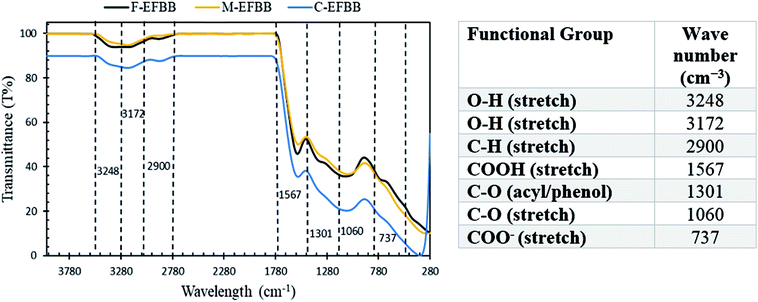
The F-EFBB had the highest percentage of oxygen, acidic functional groups, CEC and zeta potential (lower PZC) which indicates that crushing the EFBB to <50 μm had exposed the functional groups within the biochar matrix and the inner pores. According to Mohan et al.,15 the functional groups are found throughout the matrix of the biochar. The exposure of surface functional groups in the F-EFBB increased the surface negative charges and lowered the PZC. Studies have indicated that adsorption of metal ions in a solution occurs only if the surface of the adsorbent is negatively charged4,16 and adsorption is more effective when the adsorbent has low PZC.38
| Sorbents | Langmuir | Freundlich | ||||||
|---|---|---|---|---|---|---|---|---|
| Qmax (mg g−1) | KL | R2 | RL | 1/n | n | KF (mg g−1) | R2 | |
| C-EFBB | 54.95 | 0.02 | 0.87 | 0.52 | 0.66 | 1.53 | 1.68 | 0.72 |
| M-EFBB | 58.14 | 0.04 | 0.97 | 0.42 | 0.51 | 1.98 | 4.19 | 0.65 |
| F-EFBB | 103.09 | 0.44 | 1.00 | 0.19 | 0.45 | 2.23 | 17.48 | 0.86 |
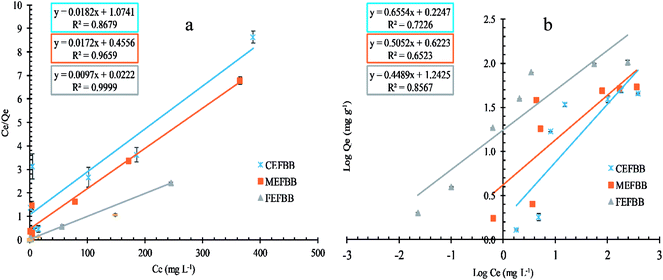 | ||
| Fig. 6 Effect of concentration on the adsorption capacities of EFBBs towards Pb ion ((a) the Langmuir isotherm, (b) the Freundlich isotherm). | ||
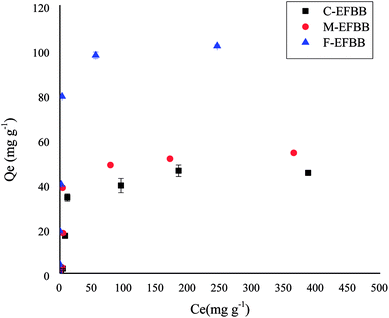
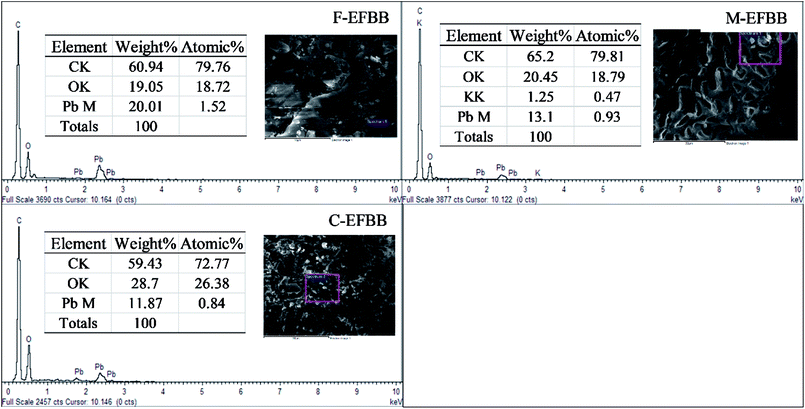
The adsorption capacities of the F-EFBB for Pb was greater than the values of EFBB reported by Samsuri et al.13 which were 58.8 mg g−1. This may be due to the fine particle size (<50 μm) used in the present study. The high adsorption capacity for heavy metals can be attributed to the functional group, zeta potential and CEC.13 This also explains the greater sorption capacity exhibited by the F-EFBB in the present study. The increasing adsorption capacity for Pb (Table 2) with decreasing particle size indicates that crushing the EFBB into finer particles may have exposed the inner pores (Fig. 1 and Table 1) and therefore, increased the presence of oxygen functional groups and CEC (Table 1) of the biochar while lowering the zeta potential (Fig. 4). The present study suggested that particle size reduction led to the exposure of the inner pores containing additional organic functional groups which could increase metal binding by the biochars. This also explains the greater sorption capacity exhibited by the F-EFBB. The higher adsorption capacity of the finer particle size for Pb is consistent with the study by Kołodyńska et al.44 who reported the adsorption of heavy metals increased with the decreasing particle size of biochars. Shen et al.18 compared adsorption of Pb by biochars of 0.15 and 2 mm particle size and found higher adsorption capacity in the 0.15 mm biochar. They attributed this to the greater surface area and CEC of the smaller particle size biochar. The FESEM-EDX analysis (Fig. 7) confirmed adsorption of Pb had occurred on the adsorbent.
| Adsorbent | Cation released (μmol) in 0 mg L−1 Pb | Cation released (μmol) in 500 mg L−1 Pb | Differences in cation (μmol) release | Pb (μmol) adsorb | % of ion exchange mechanism |
|---|---|---|---|---|---|
| a Values represent means of (n = 3). No S.E. | |||||
| F-EFBB | 47.587 ± 0.275 | 106.381 ± 0.506 | 58.793 ± 0.587 | 80.927 ± 0.348 | 72.65% |
| M-EFBB | 37.769 ± 0.314 | 84.841 ± 3.967 | 47.071 ± 3.755 | 53.629 ± 0.025 | 87.78% |
| C-EFBB | 43.074 ± 0.298 | 77.073 ± 0.264 | 33.998 ± 0.559 | 43.607 ± 0.827 | 78.01% |
The release of cations into the solution from the adsorbents increased the solution pH as shown in the 0 mg L−1 Pb solution (Table 4). This is consistent with the results previously reported by other researchers.48,52 However, the pH of a solution containing 500 mg L−1 Pb decreased after the Pb was adsorbed by the adsorbents (Table 4). This can prove that deprotonation of functional groups had occurred. The reduction in pH varied among the adsorbents. This variation could be due to differences in the content and the degree of functional group exposure among the adsorbents. Therefore, the reduction in pH was more significant with F-EFBB than M-EFBB or C-EFBB (Table 4) due to the higher content of functional groups in the former adsorbents. Therefore, it can be concluded that complexation had occurred between the functional groups of the adsorbents, especially F-EFBB and the metals. This result is also evidence that crushing the EFBB exposed the functional groups of the inner pores within the biochar matrix. The pH reduction in the solution was more pronounced with the F-EFBB compared to the M-EFBB and C-EFBB.
| Sorbents | pH of 0 mg L−1 Pb solution | pH of 500 mg L−1 Pb solution | Differences |
|---|---|---|---|
| a Values represent means of (n = 3). No S.E. | |||
| F-EFBB | 9.400 ± 0.015 | 5.963 ± 0.007 | 3.437 ± 0.014 |
| M-EFBB | 9.473 ± 0.031 | 6.367 ± 0.021 | 3.107 ± 0.018 |
| C-EFBB | 8.927 ± 0.098 | 5.830 ± 0.146 | 3.097 ± 0.107 |
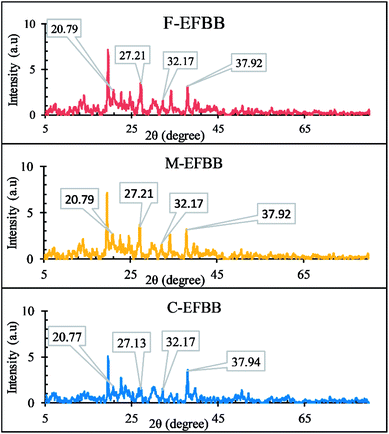
The XRD diffractograms (Fig. 8) show peaks at 2θ°: 37.9, 2θ°: 20.77 and 32, and 2θ°: 27.21 which indicate the presence of Pb3(CO3)2(OH)2,53 Pb9(PO4)6, and Pb3(CO3)(OH),54 respectively. However, all the XRD diffractograms show similar peak intensities suggesting that precipitation mechanism was not the reason for the increasing adsorption capacity of biochar for Pb with decreasing particle sizes.
The results suggest that EFBBs can be used for remediation of acidic soils contaminated with heavy metals due to the high adsorption capacity of the EFBBs for the metals as well as their ability to release nutrients (K, Ca, Mg) for plant growth and increasing soil pH and CEC.
Conclusions
The physical modification to EFBB by crushing it into smaller particle sizes significantly improved its physicochemical properties. The inner pores and functional groups of EFBB were exposed when crushed to <50 μm (F-EFBB). The F-EFBB had the highest BET surface area, micropore surface area, pH, CEC, functional groups, negative charge on the surface and the lowest PZC value. The F-EFBB had the highest adsorption capacity for Pb followed by M-EFBB and the lowest was C-EFBB. Therefore, the results of this study suggest that crushing the EFBB to <50 μm is recommended to increase its adsorption capacity for heavy metals.Conflict of interest
All the authors declared no conflict of interest in conducting this research and no human being or animal was used for experimental purposes in this study.Acknowledgements
The authors would like to thank Universiti Putra Malaysia for providing a research grant to conduct this research under the UPM/IPS/9575800 Research Grant. The authors also would like to acknowledge the University of Diyala for providing a PhD scholarship to the first author.References
- P. Kosolsaksakul, I. W. Oliver and M. C. Graham, J. Environ. Manage., 2018, 215, 49–56 CrossRef CAS PubMed
.
- S. P. Sohi, Science, 2012, 338, 1034–1035 CrossRef CAS PubMed
.
- C. N. B. Yong Sik Ok, M. Sophie and X. Uchimiya Scott, Biochar Production, Characterization, and Applications, CRC press, 2015 Search PubMed
.
- N. Claoston, A. Samsuri, M. Ahmad Husni and M. Mohd Amran, Waste Manag. Res., 2014, 32, 331–339 CrossRef CAS PubMed
.
- L. C. O. A. Melo, A. R. Coscione, C. A. Abreu, A. P. Puga and O. A. Camargo, BioResources, 2013, 8, 4992–5004 CrossRef
.
- J. Lehmann and S. Joseph, Biochar for environmental management: science, technology and implementation, Routledge, 2015 Search PubMed
.
- D. W. Rutherford, R. L. Wershaw and J. B. Reeves III, US Geolegical Surv., 2008, p. 43 Search PubMed
.
- L. Kong, Y. Xiong, L. Sun, S. Tian, X. Xu, C. Zhao, R. Luo, X. Yang, K. Shih and H. Liu, J. Hazard. Mater., 2014, 274, 205–211 CrossRef CAS PubMed
.
- X. Cao, L. Ma, B. Gao and W. Harris, Environ. Sci. Technol., 2009, 43, 3285–3291 CrossRef CAS PubMed
.
- M. Uchimiya, L. H. Wartelle, K. T. Klasson, C. A. Fortier and I. M. Lima, J. Agric. Food Chem., 2011, 59, 2501–2510 CrossRef CAS PubMed
.
- K. T. Klasson, M. Uchimiya, I. M. Lima, K. Thomas Klasson, M. Uchimiya and I. M. Lima, Chemosphere, 2014, 111, 129–134 CrossRef PubMed
.
- A. Dieguez-Alonso, Fixed-bed biomass pyrolysis: mechanisms and biochar production, Dr.-Ing Dissertation, Tecnische Universitat, Berlin, 2015 Search PubMed
.
- A. W. Samsuri, F. Sadegh-Zadeh and B. J. Seh-Bardan, Int. J. Environ. Sci. Technol., 2014, 11, 967–976 CrossRef CAS
.
- J. Wang and C. Chen, Biotechnol. Adv., 2006, 24, 427–451 CrossRef CAS PubMed
.
- D. Mohan, P. Singh, A. Sarswat, P. H. Steele and C. U. Pittman Jr, J. Colloid Interface Sci., 2015, 448, 238–250 CrossRef CAS PubMed
.
- L. Trakal, D. Bingöl, M. Poho\vrel\`y, M. Hruška and M. Komárek, Bioresour. Technol., 2014, 171, 442–451 CrossRef CAS PubMed
.
- M. Thommes, K. Kaneko, A. V Neimark, J. P. Olivier, F. Rodriguez-Reinoso, J. Rouquerol and K. S. W. Sing, Pure Appl. Chem., 2015, 87, 1051–1069 CAS
.
- Z. Shen, F. Jin, F. Wang, O. McMillan and A. Al-Tabbaa, Bioresour. Technol., 2015, 193, 553–556 CrossRef CAS PubMed
.
- Z. Shen, O. McMillan, F. Jin and A. Al-Tabbaa, J. Hazard. Mater., 2016, 316, 214–220 CrossRef CAS PubMed
.
- D. Savova, E. Apak, E. Ekinci, F. Yardim, N. Petrov, T. Budinova, M. Razvigorova and V. Minkova, Biomass Bioenergy, 2001, 21, 133–142 CrossRef CAS
.
- W. Song and M. Guo, J. Anal. Appl. Pyrolysis, 2012, 94, 138–145 CrossRef CAS
.
- S. P. McGrath and C. H. Cunliffe, J. Sci. Food Agric., 1985, 36, 794–798 CrossRef CAS
.
- G. P. Gillman and E. A. Sumpter, Soil Res., 1986, 24, 61–66 CrossRef CAS
.
- J. O. Azeez, S. O. Obanla, A. O. Ojo and A. O. Shokalu, Commun. Soil Sci. Plant Anal., 2010, 41, 108–121 CrossRef CAS
.
- K. Y. Foo and B. H. Hameed, Chem. Eng. J., 2010, 156, 2–10 CrossRef CAS
.
- D. Mohan, S. Rajput, V. K. Singh, P. H. Steele and C. U. Pittman, J. Hazard. Mater., 2011, 188, 319–333 CrossRef CAS PubMed
.
- S. Yavari, A. Malakahmad, N. B. Sapari and S. Yavari, J. Environ. Manage., 2017, 193, 201–210 CrossRef CAS PubMed
.
- IBI, IBI biochar Stand., 2015, pp. 1–61 Search PubMed
.
- Y. Chun, G. Sheng, C. T. Chiou and B. Xing, Environ. Sci. Technol., 2004, 38, 4649–4655 CrossRef CAS PubMed
.
- D. Mohan, P. Singh, A. Sarswat, P. H. Steele and C. U. Pittman, J. Colloid Interface Sci., 2015, 448, 238–250 CrossRef CAS PubMed
.
- W. J. Liu, H. Jiang and H. Q. Yu, Chem. Rev., 2015, 115, 12251–12285 CrossRef CAS PubMed
.
- B. Singh, B. P. Singh and A. L. Cowie, Soil Res., 2010, 48, 516–525 CrossRef CAS
.
- J. E. Amonette and S. Joseph, Characteristics of biochar: microchemical properties, in Biochar for environmental management: Science and technology, Earthscan, London, UK, 2009, vol. 33 Search PubMed
.
- S. Ricordel, S. Taha, I. Cisse and G. Dorange, Sep. Purif. Technol., 2001, 24, 389–401 CrossRef CAS
.
- X. Tong, J. Li, J. Yuan and R. Xu, Chem. Eng. J., 2011, 172, 828–834 CrossRef CAS
.
- J. Ifthikar, J. Wang, Q. Wang, T. Wang, H. Wang, A. Khan, A. Jawad, T. Sun, X. Jiao and Z. Chen, Bioresour. Technol., 2017, 238, 399–406 CrossRef CAS PubMed
.
- D. Kołodyńska, J. Krukowska and P. Thomas, Chem. Eng. J., 2017, 307, 353–363 CrossRef
.
- R. C. Bansal and M. Goyal, Activated carbon adsorption, CRC press, 2005 Search PubMed
.
- C. H. Giles, D. Smith and A. Huitson, J. Colloid Interface Sci., 1974, 47, 755–765 CrossRef CAS
.
- K. H. Tan, Principles of Soil Chemistry, 2010, vol. 18 Search PubMed
.
- D. Tiwari, H. U. Kim and S. M. Lee, Sep. Purif. Technol., 2007, 57, 11–16 CrossRef CAS
.
- X. Ma, X. Liu, D. P. Anderson and P. R. Chang, Food Chem., 2015, 181, 133–139 CrossRef CAS PubMed
.
- T. Ma, P. R. Chang, P. Zheng, F. Zhao and X. Ma, Chem. Eng. J., 2014, 240, 595–600 CrossRef CAS
.
- D. Kołodyńska, R. Wn\ketrzak, J. J. Leahy, M. H. B. Hayes, W. Kwapiński and Z. Hubicki, Chem. Eng. J., 2012, 197, 295–305 CrossRef
.
- A. N. Claoston, Immobilisation of arsenic, copper, manganese and lead in gold mine tailings by oil palm empty fruit bunch and rice husk biochars, Master's thesis, Universiti Putra Malaysia, 2015 Search PubMed
.
- A. S. K. Kumar, T. Gupta, S. S. Kakan, S. Kalidhasan, V. Rajesh, N. Rajesh and others, J. Hazard. Mater., 2012, 239, 213–224 CrossRef PubMed
.
- R. Goswami, J. Shim, S. Deka, D. Kumari, R. Kataki and M. Kumar, Ecol. Eng., 2016, 97, 444–451 CrossRef
.
- H. Li, X. Dong, E. B. da Silva, L. M. de Oliveira, Y. Chen and L. Q. Ma, Chemosphere, 2017, 178, 466–478 CrossRef CAS PubMed
.
- W. Ding, X. Dong, I. M. Ime, B. Gao and L. Q. Ma, Chemosphere, 2014, 105, 68–74 CrossRef CAS PubMed
.
- H. Lu, W. Zhang, Y. Yang, X. Huang, S. Wang and R. Qiu, Water Res., 2012, 46, 854–862 CrossRef CAS PubMed
.
- F. Zhang, X. Wang, D. Yin, B. Peng, C. Tan, Y. Liu, X. Tan and S. Wu, J. Environ. Manage., 2015, 153, 68–73 CrossRef CAS PubMed
.
- L. Qian and B. Chen, J. Agric. Food Chem., 2014, 62, 373–380 CrossRef CAS PubMed
.
- E. F. Zama, Y. G. Zhu, B. J. Reid and G. X. Sun, J. Cleaner Prod., 2017, 148, 127–136 CrossRef CAS
.
- X. Xu, X. Cao and L. Zhao, Chemosphere, 2013, 92, 955–961 CrossRef CAS PubMed
.
Footnote |
| † Electronic supplementary information (ESI) available. See DOI: 10.1039/c8ra06867d |
| This journal is © The Royal Society of Chemistry 2018 |

