 Open Access Article
Cost effective synthesis of p-type Zn-doped MgAgSb by planetary ball-milling with enhanced thermoelectric properties
Yanyan Zhenga,
Chengyan Liua,
Lei Miao *a,
Hong Lin
 b,
Jie Gaoa,
Xiaoyang Wanga,
Junliang Chena,
Shaohai Wua,
Xin Lia and
Huanfu Caic
aGuangxi Key Laboratory of Information Materials, Guangxi Collaborative Innovation Center of Structure and Property for New Energy and Materials, School of Material Science and Engineering, Guilin University of Electronic Technology, Guilin, 541004, P. R. China. E-mail: miaolei@guet.edu.cn
bState Key Laboratory of New Ceramic and Fine Processing, School of Materials Science and Engineering, Tsinghua University, Beijing, 100084, P. R. China
cInstitute of Information Engineering, Guangdong University of Finance, Guangzhou, 510520, P. R. China
First published on 15th October 2018
Abstract
As promising candidates for the progress of low-temperature thermoelectric devices, MgAgSb-based thermoelectric materials have drawn a great deal of attention. However, due to complicated phase changes, high content of impurities and high volatilization of Mg, it is difficult to synthesize pure phase MgAgSb-based thermoelectric materials via conventional methods. Here, MgAgSb alloy was successfully synthesized by a combination of common planetary ball milling and spark plasma sintering. Furthermore, the introduction of Zn improved the purity of alloys, leading to optimization of the electrical transport properties. As a result, the power factor was improved from 1087 μW m−1 K−2 for MgAg0.9Sb0.95 to 1394 μW m−1 K−2 for Mg0.97Zn0.03Ag0.9Sb0.95 at 473 K, and the ZT reached ∼0.7 at 473 K. These results suggest that MgAgSb-based thermoelectric materials have a good thermoelectric application potential and this study can be used as guidance for the synthesis and performance improvement of other thermoelectric materials. Our synthesis route sets forth a new avenue for accelerating commercial applications of MgAgSb-based thermoelectric power generation or refrigeration.
Introduction
Thermoelectric (TE) materials can directly convert thermal energy into electrical energy and have been widely used in power generation and cooling devices in the past decades.1 The energy conversion efficiency of TE materials is mainly determined by the dimensionless figure of merit, ZT = S2σT/κtot, where S, σ, T and κtot are the Seebeck coefficient, the electrical conductivity, the absolute temperature and the thermal conductivity, respectively.2,3 Hence, in order to reach high ZT, it is imperative to minimize heat transport and simultaneously maintain good electrical properties.4 Two state-of-the-art methods for enhancing ZT of existing materials are optimizing the power factor (PF) and reducing the lattice thermal conductivity. For the former, it can be realized through band engineering,5 carrier concentration optimization,6,7 promotion of carrier mobility8,9 and searching for materials with high PF.10 For the latter, controlling the nano-microstructures11 and developing materials with intrinsically low thermal conductivity have proven to be effective ways for enhancing ZT.12–14 Optimization of carrier concentration and microscopic control of nanostructures are the main methods to improve TE performance. Several TE materials with high ZT are being explored widely, including SnSe,15 GeTe,16 Cu2Se17 and Bi2Te3.18 Commercially used TE materials for solid state refrigeration are mainly Bi2Te3-based alloys near room temperature.19,20 However, due to the lack of elemental content, toxicity and poor mechanical stability, commercial applications of the above materials are severely limited. Therefore, it is crucial to develop TE materials with more favorable characteristics.Recently, Mg3Sb2 (ref. 21) and Half-Heusler22–29 compounds have caused significant concern. The common problem is that these compounds are used only at moderate and high temperature ranges. MgAgSb materials have been extensively studied due to their excellent TE performance including intrinsic low thermal conductivity, rich elemental content, good mechanical stability and thermal stability at room temperature.30 Tan et al. has proposed that high ZT can be achieved by band engineering to improve the TE performance of MgAgSb via Zn and Pd doping.31 Although the MgAgSb-based TE materials with high performance can be used at near room temperature, the synthesis of pure phase MgAgSb is still an issue. There are three different crystal structures of MgAgSb: (1) a tetragonal α-phase with a space group of I![[4 with combining macron]](https://www.rsc.org/images/entities/char_0034_0304.gif) c2 at low temperature (room-590 K), (2) a Cu2Sb-related β-phase with a space group of P4/nmm at intermediate temperature (590–630 K), and (3) a Half-Heusler γ-phase with a space group of F
c2 at low temperature (room-590 K), (2) a Cu2Sb-related β-phase with a space group of P4/nmm at intermediate temperature (590–630 K), and (3) a Half-Heusler γ-phase with a space group of F![[4 with combining macron]](https://www.rsc.org/images/entities/char_0034_0304.gif) 3m at high temperature (630–700 K).32 Complicated phase changes and high content of Ag3Sb were generated easily while preparing MgAgSb materials. At the same time, magnesium, the major component of MgAgSb, is active and easily oxidized. Therefore, the air-free environment is essential for the synthesis of MgAgSb. Besides, magnesium can react with the quartz glass tube, making synthesis conditions challenging. Based on the above problems, two synthetic methods for the preparation of MgAgSb materials have been developed: (1) the combination of two-step mechanical alloying by high energy ball-milling and low temperature hot pressing,33 and (2) the combination of high temperature melting, spark plasma sintering and heat treating at high temperature.34 In addition, due to the high cost of high-energy ball milling and the complexity of the high-temperature sintering synthesis process, there are some difficulties for the synthesis of MgAgSb-based TE materials. However, the ordinary ball-milling has lots of advantages, such as low center of gravity, stable performance, easy operation, safety, reliability, and low noise and loss levels.
3m at high temperature (630–700 K).32 Complicated phase changes and high content of Ag3Sb were generated easily while preparing MgAgSb materials. At the same time, magnesium, the major component of MgAgSb, is active and easily oxidized. Therefore, the air-free environment is essential for the synthesis of MgAgSb. Besides, magnesium can react with the quartz glass tube, making synthesis conditions challenging. Based on the above problems, two synthetic methods for the preparation of MgAgSb materials have been developed: (1) the combination of two-step mechanical alloying by high energy ball-milling and low temperature hot pressing,33 and (2) the combination of high temperature melting, spark plasma sintering and heat treating at high temperature.34 In addition, due to the high cost of high-energy ball milling and the complexity of the high-temperature sintering synthesis process, there are some difficulties for the synthesis of MgAgSb-based TE materials. However, the ordinary ball-milling has lots of advantages, such as low center of gravity, stable performance, easy operation, safety, reliability, and low noise and loss levels.
In this study, the combination of adjusting the element ratio, ball milling time of ordinary planetary ball milling and spark plasma sintering has been adapted to prepare MgAgSb successfully. We compared our work with other groups' experimental processes and data. As shown in Table 1, the advantages and some novelties of our materials compared with the commercial Bi2Te3 materials are: (1) MgAgSb materials are cheaper, less toxic, and exhibit richer elemental content, better mechanical stability, thermal stability and lower thermal conductivity at room temperature. (2) At present, this synthesis method of combining a common planetary ball milling and spark plasma sintering has not been reported for MgAgSb materials. Our synthesis method effectively avoids the reaction of Mg with the quartz tube and has the advantages of being easy, fast and highly efficient. This study provides guidance for the synthesis and performance improvement of other thermoelectric materials. In addition, Zn doping has not been reported yet for MgAgSb materials. After doping with Zn, the improvement of total TE performances has been achieved with maximum ZT values of 0.7 at 473 K. Our study proposes that MgAgSb-based materials are promising candidates for the development of low-temperature TE devices, which are beneficial for applications in low temperature power generation and cooling systems with improved energy conversion efficiency.
| Materials | Carrier type | ZT | Method | Ref |
|---|---|---|---|---|
| a BM = high energy ball milling; HP = hot-pressing; SPS = spark plasma sintering; ZM = zone melting; MQG = melting + quenching + grinding; PBM = planetary ball milling. | ||||
| BiSbTe | p | 1.4 (373 K) | BM-HP | 35 |
| Bi0.4Sb1.6Te3 | p | 1.1 (673 K) | Melt-SPS | 36 |
| Bi0.5Sb1.5Te3 | p | 1.3 (10 K) | ZM-HP | 37 |
| α-MgAgSb | p | 0.56 (433 K) | MQG-HP-Anneal | 32 |
| MgAg0.965Ni0.005Sb0.99 | p | 1.4 (450 K) | Two-step BM-HP-Anneal | 33 |
| MgAgSb0.99In0.01 | p | 1.1 (525 K) | MQG-SPS-Anneal | 34 |
| MgAg0.97Sb0.99 | p | 0.85 (375 K) | MQG-SPS-Anneal-Quench | 38 |
| Mg0.97Zn0.03Ag0.9Sb0.95 | p | 0.7 (473 K) | PBM-SPS | This study |
Materials and methods
Synthesis process
The samples were fabricated by combining the ordinary planetary ball-milling (WXQM-1L) and spark plasma sintering (SPS, LABOX-325, SINTER LAND INC.) processes. Mg (99.5%, Aladdin), Ag (99.9%, Macklin), Sb (99.5%, Aladdin), and Zn (99.99%, Aladdin) were weighed with the nominal composition Mg1−xZnxAg0.9Sb0.95 (x = 0%, 2%, 3%, 4% and 5%) and then loaded into the stainless steel jar in a glove-box under argon atmosphere. These powders were subjected to ordinary planetary ball-milling at 600 rpm for 18 h under argon atmosphere. Then they were densified in a graphite die of Φ 15 mm and sintered by SPS at 573 K for 10 min under an axial compressive stress of 50 MPa in vacuum. The relative densities were approximately 94% of the theoretical values. ZT measurement uncertainty: the uncertainties of the electrical resistivity and Seebeck coefficient are 3%; the uncertainty for the total thermal conductivity is about 12%. The uncertainty for the final ZT is about 20%.Characterization
The powder diffractometer (D8 Advance, Bruker) was used to observe X-ray diffraction (XRD) patterns. The morphology observation was performed by field-emission scanning-electron microscopy (FESEM, Hitachi S-4800, Japan). The electrical resistivity and Seebeck coefficient were measured simultaneously by the dynamic direct current (DC) method (CTA-3, Cryall) with temperature gradients of 30 K, 40 K, and 50 K in a low pressure argon (99.999%) atmosphere. The thermal conductivity (κtot) was calculated using the equation κtot = DρCp, where D, ρ and Cp are the thermal diffusivity, the measured density, and the specific heat, respectively. The laser flash thermal analyzer (EM-500, TA) was used to measure the thermal diffusivity coefficient. Density was measured multiple times using the Archimedes method. The differential scanning calorimetry (DSC-404F3, NETZSCH) was used to measure the specific heat. The Hall coefficient (RH) at room temperature was measured by the Physical Properties Measurement System (PPMS, Quantum Design, Inc.). The Hall carrier concentration (n) and mobility (μ) were calculated using equations: RH = 1/ne and σ = neμ, respectively.Results and discussion
Fig. 1(a) displays the XRD patterns of Mg1-xZnxAg0.9Sb0.95 (0% ≤ x ≤ 5%) samples. The diffraction peaks of the samples are well-matched with the calculated results for MgAgSb with I![[4 with combining macron]](https://www.rsc.org/images/entities/char_0034_0304.gif) c2 space group. From the XRD patterns, the impurity of Sb is more obvious without Zn doping and there are co-existing phases consisting of the main phase MgAgSb, and a few impurity phases of Sb and Ag3Sb without doping. The contents of impurity reduced with the increasing doped amount of Zn until the Zn content exceeded 3%. There is only a trace amount of impurity phase of Sb, and Ag3Sb is occasionally observed when x = 3%. Afterwards, metallic Sb and Ag3Sb exist in the main phase of MgAgSb when x > 3%. Therefore, it could be inferred that Zn doping can improve the purity and crystallinity of MgAgSb, enhancing the electrical properties as shown later.
c2 space group. From the XRD patterns, the impurity of Sb is more obvious without Zn doping and there are co-existing phases consisting of the main phase MgAgSb, and a few impurity phases of Sb and Ag3Sb without doping. The contents of impurity reduced with the increasing doped amount of Zn until the Zn content exceeded 3%. There is only a trace amount of impurity phase of Sb, and Ag3Sb is occasionally observed when x = 3%. Afterwards, metallic Sb and Ag3Sb exist in the main phase of MgAgSb when x > 3%. Therefore, it could be inferred that Zn doping can improve the purity and crystallinity of MgAgSb, enhancing the electrical properties as shown later.
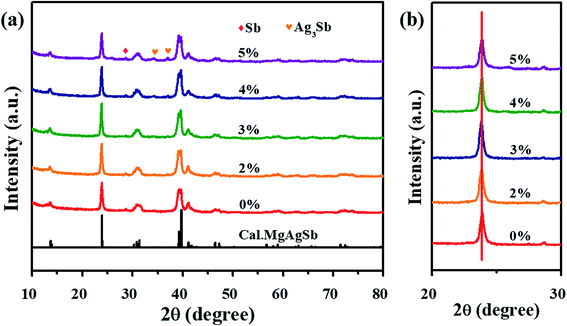 | ||
| Fig. 1 XRD patterns of Mg1−xZnxAg0.9Sb0.95 (x = 0%, 2%, 3%, 4% and 5%) samples. The value we calculated based on refined parameters is shown at the bottom. | ||
Looking at the main peaks in the regions of 20 ∼ 30°, as shown in Fig. 1(b), one can see that these peaks do not shift toward low or high diffraction angles with the increase in Zn content. This suggests that Zn doping has less effect on the lattice structure due to the closer ionic radius between Mg (0.66 Å) and Zn (0.68 Å) than Sb (0.76 Å) and Ag (1.15 Å).39 Thus, it is easier to replace Zn with Mg in the lattice.
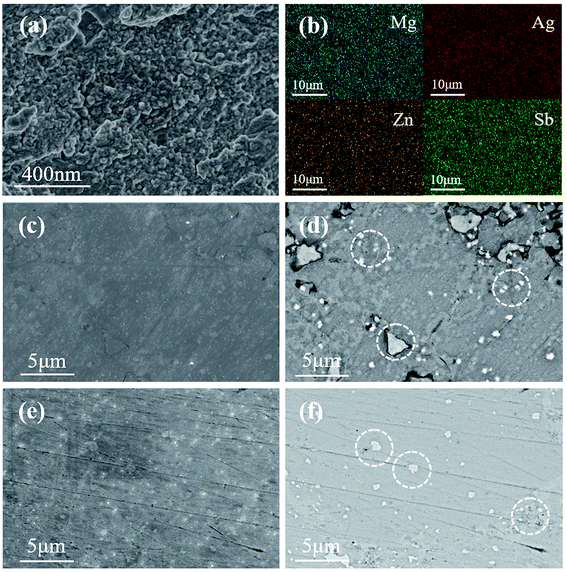
Fig. 2 shows the SEM images of Mg1−xZnxAg0.9Sb0.95 (x = 0% and 3%). The freshly broken surface of Mg0.97Zn0.03Ag0.9Sb0.95 sample was shown in Fig. 2(a), the grain size is from 50 nm to 200 nm. As shown in Fig. 2(b), energy dispersive X-ray spectroscopy (EDX) images show that all the elements are homogeneously distributed in the sample. Due to the low resolution of EDX, the medium magnification TEM images are shown in Fig. 2(c) and (d). There are a few impurities in MgAg0.9Sb0.95 and the grain size of impurities is from 200 nm to 3 μm. Fig. 2(e) and (f) show the polished surface of Mg0.97Zn0.03Ag0.9Sb0.95, indicating that the impurities are reduced by 3% Zn doping and the grain size of impurities were decreased to be varying from 100 nm to 600 nm. It can be inferred that Zn could combine with Sb and Ag3Sb to form ZnAgSb to reduce the concentration of impurities40 which are easily formed in the absence of Zn doping.
Fig. 3 shows the temperature dependence of the electrical properties of Mg1−xZnxAg0.9Sb0.95 (x = 0–5%) samples. When the measured temperature increased from 323 to 573 K, the electrical resistivity first increased and then decreased significantly. The highest electrical resistivity is reached at 423 ∼ 473 K, which is shown in Fig. 3(a). The electrical resistivity of all samples increases with an increase in Zn content. Typically, as the carrier concentration gradually decreases, as shown in Fig. 4(a), the electrical resistivity at 473 K increases from 1.25 × 10⁻⁵ Ω m for MgAg0.9Sb0.95 to 1.54 × 10⁻⁵ Ω m for Mg0.97Zn0.03Ag0.9Sb0.95. The higher electrical resistivity below 450 K for 3% Zn doping and above 450 K for 5% Zn doping is due to the appearance of Sb and Ag3Sb impurities when the Zn content exceeds 3%, which leads to the low resistivity. In addition, the decrease of electrical resistivities above 450 K could be attributed to the bipolar effect.41
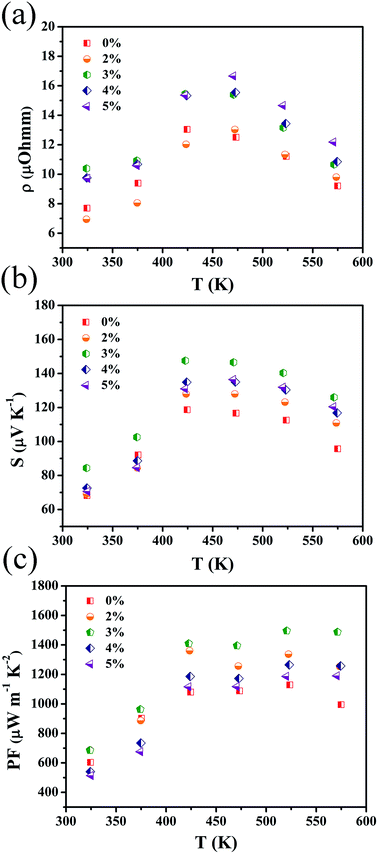 | ||
| Fig. 3 Temperature dependencies of (a) electrical resistivity; (b) Seebeck coefficient and (c) power factor of Mg1−xZnxAg0.9Sb0.95 (x = 0–5%), respectively. | ||
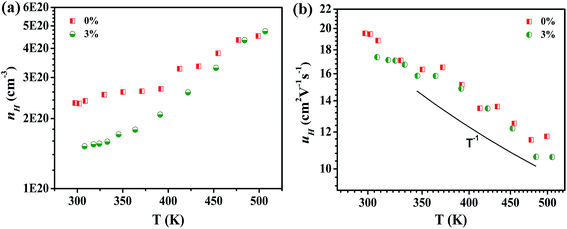 | ||
| Fig. 4 Temperature dependencies of (a) Hall carrier concentration and (b) Hall mobility for Mg1−xZnxAg0.9Sb0.95 (x = 0% and 3%), respectively. | ||
The temperature dependence of the Seebeck coefficient for all the Zn doped samples is shown in Fig. 3(b), which indicates that all the samples are p-type semiconductors. The Seebeck coefficient of Mg1−xZnxAg0.9Sb0.95 samples increases with increasing Zn content (x ≤ 3%) and peak sat 423 K. This observation can be ascribed to the typical characteristic of bipolar diffusion effect caused by a narrow band gap for MgAgSb-based materials.34 The Seebeck coefficient for sample MgAg0.9Sb0.95 at 423 K is 118 μV K−1, which increases to 148 μV K−1 for Mg0.97Zn0.03Ag0.9Sb0.95. The significantly enhanced Seebeck coefficient can be attributed to the reduced carrier concentration caused by Zn doping.
The values of the power factor for all Zn doped samples are obtained as shown in Fig. 3(c). With increasing Zn doped content from x = 0% to 5%, power factor values monotonically increase from 323 K to 523 K. PF values for Zn doped Mg1−xZnxAg0.9Sb0.95 (x = 2–3%) samples are significantly higher than that of the MgAg0.9Sb0.95 sample and the peak value reaches up to 1500 μW m−1 K−2 for Mg0.97Zn0.03Ag0.9Sb0.95 at 523 K.
Fig. 4 shows the temperature dependencies of Hall carrier concentration and Hall mobility of Mg1−xZnxAg0.9Sb0.95 (x = 0% and 3%) samples. The Hall carrier concentration increases with elevating temperature as shown in Fig. 4(a). Notably, the carrier concentration rapidly decreases from 2.32 × 10²⁰ to 1.55 × 1020 cm−3 at 300 K due to the decrease in impurities with Zn doping. As the major component of MgAgSb, Mg is easily volatilized to form the Mg vacancy during the synthesis processes, which leads to the damage of the materials. Owing to the higher stability of Zn, the volatilization is suppressed with Zn doping, contributing to the reduction of the vacancy. The results show that as the Zn content increases, the carrier concentration is significantly reduced. In addition, Ag3Sb is a metal and can reduce the Seebeck coefficient by increasing the carrier concentration. Therefore, it can be inferred that Zn doping improves the purity of MgAgSb, giving rise to its improved electrical properties.
We can see the same trend in Hall mobility of MgAg0.9Sb0.95 and Mg0.97Zn0.03Ag0.9Sb0.95 in Fig. 4(b). The Hall mobility at room temperature reaches 20 cm2 V−1 s−1. The effective concentration of impurities, the carrier concentration and some other material-specific parameters are vital for strengthening the ionized impurity scattering. The carrier relaxation time of ionized impurity scattering under the Born approximation and a coulombic potential screening effect is expressed as:42
Fig. 5 shows the thermal transport properties of Mg1-xZnxAg0.9Sb0.95 (x = 0–5%) samples. Diffusivity coefficients of all samples are plotted in Fig. 5(a). The results show that the diffusivity coefficients of all samples first decrease to the minimum at around 423 ∼ 473 K and then increase with rising temperature. With the increase in Zn content, diffusivity coefficients gradually decrease and then increase. When the content of Zn is 3%, diffusivity coefficient is up to the value of 0.58 mm2 s−1 at 473 K.
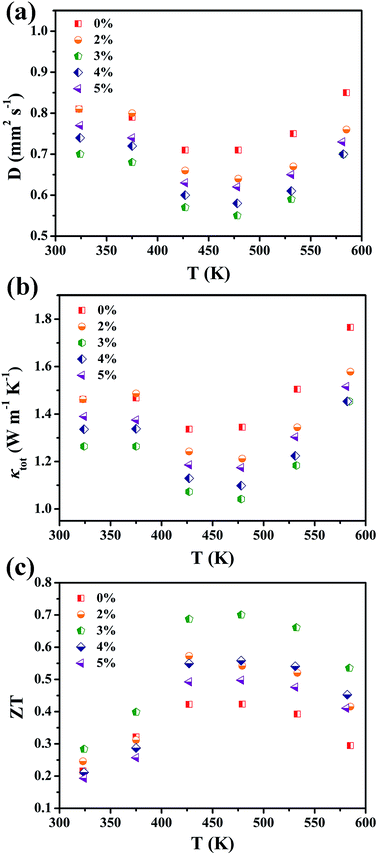 | ||
| Fig. 5 Temperature-dependent (a) diffusivity coefficient; (b) thermal conductivity and (c) ZT values for Mg1−xZnxAg0.9Sb0.95 (x = 0–5%), respectively. | ||
Fig. 5(b) shows the total thermal conductivity κtot of all samples. The thermal conductivity (κtot) is calculated using the equation κtot = DρCp. It is clear that increasing the content of Zn from x = 0% to x = 3% gradually decreases the κtot value within the entire temperature measurement range. The Mg0.97Zn0.03Ag0.9Sb0.95 has a lower κtot of 1.09 W m−1 K−1 than κtot of other samples at 473 K. This may be ascribed to the strong impurity ion scattering and the grain uniformity in the range of 50–200 nm.33 Ionized impurity scattering could play an important role in the carrier transport (T > 300 K) since almost all of the thermoelectric materials are heavily doped semiconductors. The charged impurities not only filter out low energy carriers but also enhance the phonon scattering. It could be inferred that a simultaneous reduction in thermal conductivity can be achieved.44 In addition, ball-milling is an effective top-down industrial approach to obtain fine particles and large quantities of nanoparticles.45 All of the grain boundaries, nanointerfaces between nanograins and nanoprecipitates affect the transport of electrons and phonons.46 The combination of ionized impurity scattering and the grain boundaries scattering drastically suppresses thermal conductivity. With the increase in Zn content, the total thermal conductivity gradually increases, which may be due to the presence of Sb and Ag3Sb impurities as shown in Fig. 1.
Fig. 5(c) shows the values of ZT by combining the corresponding results of the electrical and thermal properties. ZT values appear to increase first and then decrease at the recorded temperature. The highest ZT value of 0.7 at 473 K is achieved for Mg0.97Zn0.03Ag0.9Sb0.95, and then it decreases above 473 K. This phenomenon might be ascribed to the bipolar effect,33,41 which is consistent with total thermal conductivity curves. Compared with the ZT value of 0.42 at 473 K for MgAg0.9Sb0.95, the ZT value of Mg0.97Zn0.03Ag0.9Sb0.95 increases by around 40%.
Conclusion
We combined the ordinary planetary ball-milling and spark plasma sintering to synthesize MgAgSb-based alloys and improve their thermoelectric performance. On one hand, Zn substituted Mg in Mg1−xZnxAg0.9Sb0.95 (x = 2–5%) enhances the purity and crystallinity, which possibly contribute to the reduction of the vacancy formation. This substitution could improve electrical performance of the sample to a certain extent. On the other hand, the benefits of combining ionized impurity scattering and the grain boundaries scattering drastically suppress thermal conductivity. Therefore, a peak value of ZT ∼ 0.7 is obtained at 473 K for Mg0.97Zn0.03Ag0.9Sb0.95 by simultaneously optimized electrical and thermal performance. Our research presents a simple and economical ordinary planetary ball-milling method instead of the high energy ball milling to fabricate MgAgSb alloys with enhanced thermoelectric properties. This method could be further extended to preparation of other thermoelectric materials.Conflicts of interest
There are no conflicts to declare.Acknowledgements
This study was supported by National Natural Science Foundation of China under Grant No. 51572049, 51562005, 51772056; Natural Science Foundation of Guangxi Province, China under Grant No. 2015GXNSFFA139002, 2016GXNSFBA380152; and Innovation Project of GUET Graduate Education under Grant No. 2018YJCX89.References
- C. Chang and L. D. Zhao, Mater. Today Phys., 2018, 4, 50–57 CrossRef.
- J. P. Heremans, V. Jovovic, E. S. Toberer, A. Saramat, K. Kurosaki, A. Charoenphakdee, S. Yamanaka and G. J. Snyder, Science, 2008, 321, 554–557 CrossRef CAS PubMed.
- G. J. Snyder and E. S. Toberer, Nat. Mater., 2008, 7, 105–114 CrossRef CAS PubMed.
- J. Yang, L. Xi, W. Qiu, L. Wu, X. Shi, L. Chen, J. Yang, W. Zhang, C. Uher and D. J. Singh, npj Comput. Mater., 2016, 2, 15015 CrossRef CAS.
- Y. Pei, X. Shi, A. Lalonde, H. Wang, L. Chen and G. J. Snyder, Nat. Mater., 2011, 473, 66–69 CrossRef CAS PubMed.
- Y. Pei, A. D. Lalonde, N. A. Heinz, X. Shi, S. Iwanaga, H. Wang, L. Chen and G. J. Snyder, Adv. Mater., 2011, 23, 5674–5678 CrossRef CAS PubMed.
- C. Fu, T. Zhu, Y. Pei, H. Xie, H. Wang, G. J. Snyder, Y. Liu, Y. Liu and X. Zhao, Adv. Energy Mater., 2014, 4, 1400600 CrossRef.
- W. Zhao, Z. Liu, P. Wei, Q. Zhang, W. Zhu, X. Su, X. Tang, J. Yang, Y. Liu, J. Shi, Y. Chao, S. Lin and Y. Pei, Nat. Nanotechnol., 2017, 12, 55–60 CrossRef CAS PubMed.
- W. Zhao, Z. Liu, Z. Sun, Q. Zhang, P. Wei, X. Mu, H. Zhou, C. Li, S. Ma, D. He, P. Ji, W. Zhu, X. Nie, X. Su, X. Tang, B. Shen, X. Dong, J. Yang, Y. Liu and J. Shi, Nat. Mater., 2017, 549, 247–251 CrossRef CAS PubMed.
- R. He, D. Kraemer, J. Mao, L. Zeng, Q. Jie, Y. Lan, C. Li, J. Shuai, H. S. Kim, Y. Liu, D. Broido, C. W. Chu, G. Chen and Z. Ren, Proc. Natl. Acad. Sci. U. S. A., 2016, 113, 13576–13581 CrossRef CAS PubMed.
- X. Zhou, Y. Yan, X. Lu, H. Zhu, X. Han, G. Chen and Z. Ren, Mater. Today, 2018 DOI:10.1016/j.mattod.2018.03.039.
- L. D. Zhao, S. H. Lo, Y. Zhang, H. Sun, G. Tan, C. Uher, C. Wolverton, V. P. Dravid and M. G. Kanatzidis, Nat. Mater., 2016, 508, 373–377 CrossRef PubMed.
- W. Li, S. Lin, B. Ge, J. Yang, W. Zhang and Y. Pei, Adv. Sci., 2016, 3, 1600196 CrossRef PubMed.
- L. Li, Y. Liu, J. Dai, A. Hong, M. Zeng, Z. Yan, J. Xu, D. Zhang, D. Shan, S. Liu, Z. Ren and J.-M. Liu, J. Mater. Chem. C, 2016, 4, 5806–5813 RSC.
- C. Chang, M. H. Wu, D. S. He, Y. L. Pei, C. F. Wu, X. F. Wu, H. L. Yu, F. Y. Zhu, K. D. Wang, Y. Chen, L. Huang, J. F. Li, J. Q. He and L. D. Zhao, Science, 2018, 360, 778–782 CrossRef CAS PubMed.
- J. Li, X. Zhang, Z. Chen, S. Lin, W. Li, J. Shen, I. T. Witting, A. Faghaninia, Y. Chen, A. Jain, L. Chen, G. J. Snyder and Y. Pei, Joule, 2018, 2, 976–987 CrossRef CAS.
- R. Nunna, P. Qiu, M. Yin, H. Chen, R. Hanus, Q. Song, T. Zhang, M. Y. Chou, M. T. Agne and J. He, Energy Environ. Sci., 2017, 10, 1928–1935 RSC.
- R. Deng, X. Su, S. Hao, Z. Zheng, M. Zhang, H. Xie, W. Liu, Y. Yan, C. Wolverton, C. Uher, M. G. Kanatzidis and X. Tang, Energy Environ. Sci., 2018, 11, 1520–1535 RSC.
- Y. Pan, U. Aydemir, F. H. Sun, C. F. Wu, T. C. Chasapis, G. J. Snyder and J. F. Li, Adv. Sci., 2017, 4, 1700259 CrossRef PubMed.
- H. S. Kim, W. Liu and Z. Ren, Energy Environ. Sci., 2017, 10, 69–85 RSC.
- J. Shuai, B. Ge, J. Mao, S. Song, Y. Wang and Z. Ren, J. Am. Chem. Soc., 2018, 140, 1910–1915 CrossRef CAS PubMed.
- S. Anand, K. Xia, V. I. Hegde, U. Aydemir, V. Kocevski, T. Zhu, C. Wolverton and G. J. Snyder, Energy Environ. Sci., 2018, 11, 140–1488 RSC.
- K. Xia, Y. Liu, S. Anand, G. J. Snyder, J. Xin, J. Yu, X. Zhao and T. Zhu, Adv. Funct. Mater., 2018, 28, 1705845 CrossRef.
- C. Fu, S. Bai, Y. Liu, Y. Tang, L. Chen, X. Zhao and T. Zhu, Nat. Commun., 2015, 6, 8144 CrossRef PubMed.
- J. Yu, C. Fu, Y. Liu, K. Xia, U. Aydemir, T. C. Chasapis, G. J. Snyder, X. Zhao and T. Zhu, Adv. Energy Mater., 2018, 8, 1701313 CrossRef.
- G. Joshi, R. He, M. Engber, G. Samsonidze, T. Pantha, E. Dahal, K. Dahal, J. Yang, Y. Lan, B. Kozinsky and Z. Ren, Energy Environ. Sci., 2014, 7, 4070–4076 RSC.
- L. Huang, Y. Wang, J. Shuai, H. Zhang, S. Yang, Q. Zhang and Z. Ren, RSC Adv., 2015, 5, 102469–102476 RSC.
- J.-L. Chen, C. Liu, L. Miao, J. Gao, Y.-y. Zheng, X. Wang, J. Lu and M. Shu, J. Electron. Mater., 2017, 47, 3248–3253 CrossRef.
- H. Zhao, B. Cao, S. Li, N. Liu, J. Shen, S. Li, J. Jian, L. Gu, Y. Pei, G. J. Snyder, Z. Ren and X. Chen, Adv. Energy Mater., 2017, 7, 1700446 CrossRef.
- Z. Liu, J. Mao, J. Sui and Z. Ren, Energy Environ. Sci., 2018, 11, 23–44 RSC.
- X. Tan, L. Wang, H. Shao, S. Yue, J. Xu, G. Liu, H. Jiang and J. Jiang, Adv. Energy Mater., 2017, 7, 1700076 CrossRef.
- M. J. Kirkham, A. M. dos Santos, C. J. Rawn, E. Lara-Curzio, J. W. Sharp and A. J. Thompson, Phys. Rev. B: Condens. Matter Mater. Phys., 2012, 85, 4506 CrossRef.
- H. Zhao, J. Sui, Z. Tang, Y. Lan, Q. Jie, D. Kraemer, K. McEnaney, A. Guloy, G. Chen and Z. Ren, Nano Energy, 2014, 7, 97–103 CrossRef CAS.
- P. Ying, X. Liu, C. Fu, X. Yue, H. Xie, X. Zhao, W. Zhang and T. Zhu, Chem. Mater., 2015, 27, 909–913 CrossRef CAS.
- B. Poudel, Q. Hao, Y. Ma, Y. Lan, A. Minnich, B. Yu, X. Yan, D. Wang, A. Muto, D. Vashaee, X. Chen, J. Liu, M. S. Dresselhaus, G. Chen and Z. Ren, Science, 2008, 2, 634–638 CrossRef PubMed.
- Z. Wang, T. Akao, T. Onda and Z. Chen, Scr. Mater., 2017, 136, 111–114 CrossRef CAS.
- T. Zhu, Z. Xu, J. He, J. Shen, S. Zhu, L. Hu, T. M. Tritt and X. Zhao, J. Mater. Chem. A, 2013, 1, 11589 RSC.
- J. Lei, D. Zhang, W. Guan, Z. Cheng, C. Wang and Y. Wang, Phys. Chem. Chem. Phys., 2018, 20, 16729–16735 RSC.
- B. Cordero, V. Gomez, A. E. Platero-Prats, M. Reves, J. Echeverria, E. Cremades, F. Barragan and S. Alvarez, Dalton Trans., 2008, 21, 2832–2838 RSC.
- J. Mi, P. Ying, M. Sist, H. Reardon, P. Zhang, T. Zhu, X. Zhao and B. B. Iversen, Chem. Mater., 2017, 29, 6378–6388 CrossRef CAS.
- Z. Liu, Y. Wang, J. Mao, H. Geng, J. Shuai, Y. Wang, R. He, W. Cai, J. Sui and Z. Ren, Adv. Energy Mater., 2016, 6, 1502269 CrossRef.
- S. Wang, J. Yang, L. Wu, P. Wei, W. Zhang and J. Yang, Adv. Funct. Mater., 2015, 25, 6660–6670 CrossRef CAS.
- T. Zhu, Y. Liu, C. Fu, J. P. Heremans, J. G. Snyder and X. Zhao, Adv. Mater., 2017, 29, 1605884 CrossRef PubMed.
- J. Mao, J. Shuai, S. Song, Y. Wu, R. Dally, J. Zhou, Z. Liu, J. Sun, Q. Zhang, C. Dela Cruz, S. Wilson, Y. Pei, D. J. Singh, G. Chen, C. W. Chu and Z. Ren, Proc. Natl. Acad. Sci. U. S. A., 2017, 114, 10548–10553 CrossRef CAS PubMed.
- Y. Lan, A. J. Minnich, G. Chen and Z. Ren, Adv. Funct. Mater., 2010, 20, 357–376 CrossRef CAS.
- D. L. Medlin and G. J. Snyder, Curr. Opin. Colloid Interface Sci., 2009, 14, 226–235 CrossRef CAS.
| This journal is © The Royal Society of Chemistry 2018 |

