 Open Access Article
Design, synthesis and characterization of novel chromone based-copper(II) antitumor agents with N,N-donor ligands: comparative DNA/RNA binding profile and cytotoxicity†
Farukh Arjmand *a,
Zeenat Afsan
 a and
Thierry Roisnelb
aDepartment of Chemistry, Aligarh Muslim University, Aligarh 202002, India. E-mail: farukh_arjmand@yahoo.co.in; Tel: +91 5712703893
bInstitut des Sciences Chimiques de Rennes, UMR 6226, Université de Rennes 1, Campus de Beaulieu Bâtiment 10B, Bureau, 15335042 Rennes, France
First published on 6th November 2018
Abstract
A series of new chromone based-Cu(II) complexes 1–3 derived from bioactive pharmacophore, 3-formylchromone and N,N-donor ligands viz., 1,10-phenanthroline, 2,2′-bipyridine and 1R,2R-DACH were synthesized as potential antitumor agents and thoroughly characterized by UV-vis, FT-IR, EPR, ESI-MS and elemental analysis. Single X-crystal diffraction studies of complex 2 revealed triclinic P![[1 with combining macron]](https://www.rsc.org/images/entities/char_0031_0304.gif) space group with square pyramidal geometry around the Cu(II) center. Comparative in vitro binding studies with ct-DNA and tRNA were carried out using absorption and emission titration experiments which revealed intercalative mode of binding with higher binding propensity of complexes 1–3 towards tRNA as compared to ct-DNA. Additionally, complex 1 exhibited high binding affinity among all the three complexes due to the involvement of phen co-ligands via π-stacking interactions in between nucleic acid base pairs. Furthermore, Hirshfeld surface analysis was carried out for complex 2 to investigate various intra and intermolecular non-covalent interactions (H-bonding, C–H⋯π etc.) accountable for stabilization of crystal lattice. The cleavage activity of complex 1 was performed by gel electrophoretic assay with pBR322 DNA and tRNA which revealed efficient DNA/tRNA cleaving ability of complex, suggesting tRNA cleavage both concentration and time dependent. Furthermore, in vitro cytotoxic activity of complexes 1–3 on a selected panel of human cancer cell lines was performed which revealed that all three complexes exhibited remarkably good cytotoxic activity with GI50 value < 10 μg mL−1 (<20 μM).
space group with square pyramidal geometry around the Cu(II) center. Comparative in vitro binding studies with ct-DNA and tRNA were carried out using absorption and emission titration experiments which revealed intercalative mode of binding with higher binding propensity of complexes 1–3 towards tRNA as compared to ct-DNA. Additionally, complex 1 exhibited high binding affinity among all the three complexes due to the involvement of phen co-ligands via π-stacking interactions in between nucleic acid base pairs. Furthermore, Hirshfeld surface analysis was carried out for complex 2 to investigate various intra and intermolecular non-covalent interactions (H-bonding, C–H⋯π etc.) accountable for stabilization of crystal lattice. The cleavage activity of complex 1 was performed by gel electrophoretic assay with pBR322 DNA and tRNA which revealed efficient DNA/tRNA cleaving ability of complex, suggesting tRNA cleavage both concentration and time dependent. Furthermore, in vitro cytotoxic activity of complexes 1–3 on a selected panel of human cancer cell lines was performed which revealed that all three complexes exhibited remarkably good cytotoxic activity with GI50 value < 10 μg mL−1 (<20 μM).
Introduction
Copper – an essential metal ion (150 mg in the human body of an adult) with d9 configuration is a cofactor for numerous enzymatic reactions that are crucial for life. Copper-coordinated complexes have attracted much attention owing to their unique biological,1 spectroscopic2 and catalytic properties.3 Cu(II) exhibits strong and kinetically inert bonds with various chosen ligands in the biological environments such as imine-nitrogen atom in the imidazole ring of histidines or chelating atoms of polypyridyls. A wide range of copper complexes as cytotoxic agents have been explored, appearing in many review articles.4,5 Literature reports reveal the importance of Cu in angiogenesis,5 which plays a pivotal role in growth and development, in cell proliferation and metastasis of tumour.6 As a matter of fact, copper complexes have met the criteria for design of efficacious drug candidates due to their potential to (i) interact strongly with biomolecules (ii) control the toxicity at trace levels and (iii) induce apoptosis [kills the cancerous cells without affecting the normal cells].Keeping in mind the complexity of cancers which show diverse phenotypes and multiple etiologies, a “one-size-fits-all” drug design strategy for the development of cancer chemotherapeutics does not yield successful results. In lieu of this, copper(II)-based therapeutics with some naturally occurring compounds such as flavonoids, coumarins, chromones7,8 etc. that could block/inhibit the cell proliferation pathway in a specific manner, are much desired. It has been demonstrated in literature that copper-based complexes are more potent antitumor agents than free metal salts or organic ligands. The cytotoxicity of complexes is highly dependent on ligand scaffold around the copper ion. Chromones have been demonstrated in the literature previously as privileged medicinal scaffold which have found application as an anti-inflammatory, antibacterial and anticancer agents.9,10 Furthermore, chromone based drugs have been found to inhibit different types of cancer targets,11 nucleic acids (DNA/RNA),12,13 enzymes (kinase inhibitors and topoisomerases)14 and other membrane receptors.15
Many copper-chromone complexes have been investigated for their anticancer activity and most of the synthesised compounds showed improved cytotoxicities against different phenotypes of cancer cell lines with varied potencies.16–19 In our laboratory, the cytotoxic potential of chromone-Cu(II) drug entity was validated on human breast (MCF-7) and liver cancer (HepG2) cell lines which revealed significantly lower IC50 values (5–10 μg mL−1) for both cancer cell lines, which was much lower than the IC50 values of previously reported other similar Cu(II) complexes.13 Recently, Prabhakaran et al. have synthesized chromone-based Cu(II) complexes and analysed their binding profile and cytotoxic activities.16
To further modulate the biological activity of the complexes, the incorporation of secondary ancillary ligands (hydrophobic/hydrophilic) is considered as a much desired option. In this work, N,N-donor ligand framework viz. 1,10-phenanthroline, 2,2′-bipyridine and 1R,2R-DACH were judicially chosen as they exhibit relatively higher affinity towards copper ion.20,21 Moreover, the extended aromatic ring systems in 1,10-phenanthroline and 2,2′-bipyridine can induce facile intercalation/groove binding interaction with the base pairs of nucleic acids; on the other hand, DACH have been demonstrated to improve the pharmacological efficacy of platinum-based drug (oxaliplatin) significantly by inhibiting DNA mismatch repair and increasing cellular uptake.22
DNA is the primary target of several prominent metal-based anticancer drugs. However, recent studies have been focused on RNA as a drug target23 as RNAs are highly structured with tertiary folding that are responsible for myriad functions in cells in vivo, for example, protein synthesis gene expression and transcription and translation. Furthermore, presence of binding pockets (much shallow and wide minor groove and narrow major groove pulled deeply into the interior of the molecule) in RNA structure are more suited for ligands involving non-covalent interactions.24,25 Inorganic metal complexes possess RNA recognition properties as they are (i) coordinatively saturated and inert to substitution (ii) induce RNA strand scission, thus marking their specific binding sites.26 Few metal complexes have demonstrated to show selectivity and efficiency in targeting non-duplex 3-dimensional RNA.27,28 Consequently, microRNAs (miRNAs) have emerged as newer metallo-drug therapeutic target for cancers, since the abnormal expression of these noncoding RNAs is associated with the pathogenesis of human cancer.29,30
In pursuit of our continuous interest for design of new targeted metal-based antitumor chemotherapeutic agents,31,32 herein, we report a series of novel tRNA targeted chromone copper-based complexes 1–3 as potent anticancer agents against selected human cancer cell line with GI50 < 10 μg mL−1 (<20 μM) as determined by SRB assay.
Results and discussion
Synthesis and characterization
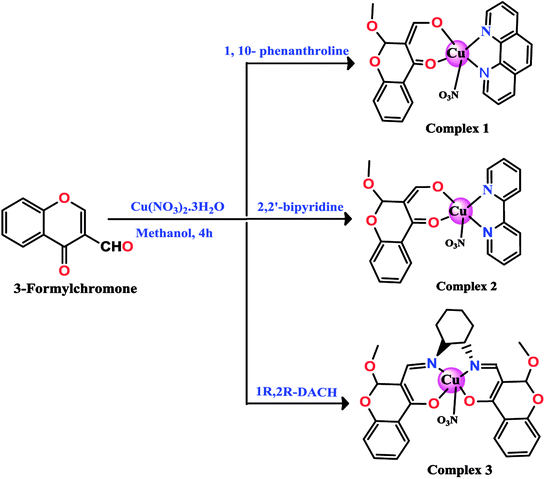
The chromone-based copper(II) complexes 1–3 were synthesized and thoroughly characterized by elemental analysis and other spectroscopic techniques viz., UV-vis, FT-IR, EPR and ESI-MS (Scheme 1). The molecular structure of complex 2 was established by single X-ray diffraction studies. The synthesis of complexes involved formation of an in situ intermediate (4-hydroxy-2-methoxy-2H-chromene-3-carbaldehyde) via methoxylation at the 2-position of the chromone ligand (Scheme 2).13,33 However, complex 3 followed in situ formation of azomethine bonds, which was authenticated by characteristic strong band of ν(C![[double bond, length as m-dash]](https://www.rsc.org/images/entities/char_e001.gif) N) at 1607 cm−1 in FT-IR and ESI-MS data. All synthesized complexes were found to be stable towards air and soluble in organic solvents, such as MeOH, DCM, DMF and DMSO. The molar conductance values in DMSO for complexes 1–3 revealed their non-electrolytic nature (9.13, 9.61 and 8.17 Ω−1 cm2 mol−1), respectively.
N) at 1607 cm−1 in FT-IR and ESI-MS data. All synthesized complexes were found to be stable towards air and soluble in organic solvents, such as MeOH, DCM, DMF and DMSO. The molar conductance values in DMSO for complexes 1–3 revealed their non-electrolytic nature (9.13, 9.61 and 8.17 Ω−1 cm2 mol−1), respectively.
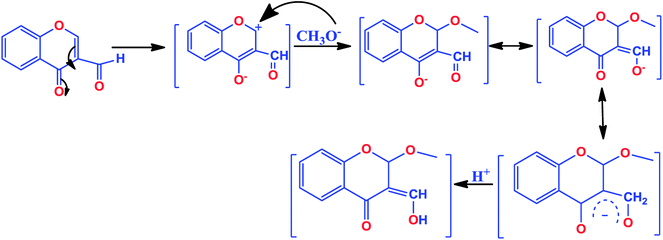 | ||
| Scheme 2 Mechanism of in situ nucleophilic substitution of methoxide anion at 2-position of 3-formylchromone. | ||
Spectroscopic characterisation
In FT-IR spectra of complexes 1–3, the characteristic bands assignable to ν(HC![[double bond, length as m-dash]](https://www.rsc.org/images/entities/char_e001.gif) O) and ν(C
O) and ν(C![[double bond, length as m-dash]](https://www.rsc.org/images/entities/char_e001.gif) O) of 3-formylchromone at 1694 and 1643 cm−1 respectively, were shifted to lower wave number indicating possible enolization and their contribution in complex formation (Fig. S1†).34 IR spectra of complex 3 depicted strong diagnostic band at 1607 cm−1 was assigned to ν(C
O) of 3-formylchromone at 1694 and 1643 cm−1 respectively, were shifted to lower wave number indicating possible enolization and their contribution in complex formation (Fig. S1†).34 IR spectra of complex 3 depicted strong diagnostic band at 1607 cm−1 was assigned to ν(C![[double bond, length as m-dash]](https://www.rsc.org/images/entities/char_e001.gif) N) stretching vibration of the coordinated azomethine group.33,35 Characteristic bands observed at 2972–2900 and 2874–2824 cm−1 corresponds to asymmetric and symmetric C–H stretching modes of the CH3 from methoxy groups ν(Ar–O–CH3) which confirmed methoxylation of the chromone ligand in complexes.36 The characteristic band consistent with the asymmetric stretching (Δν = 58, 79 and 51 cm−1 for complexes 1–3, respectively) in the region 1484–1405 cm−1 and in plane bending vibrations (Δν = 37, 38 and 48 cm−1 for complexes 1–3, respectively) in the region 769–719 cm−1 was observed which split into two bands with comparatively small separation, validates unidentate coordination of nitrate ion to the Cu(II) ion in the complexes.37 In far-IR region, medium intensity signature bands at 500–530 cm−1 and 430–410 cm−1 were witnessed, attributed to the formation of M–N and M–O vibrations, respectively in all the complexes.38
N) stretching vibration of the coordinated azomethine group.33,35 Characteristic bands observed at 2972–2900 and 2874–2824 cm−1 corresponds to asymmetric and symmetric C–H stretching modes of the CH3 from methoxy groups ν(Ar–O–CH3) which confirmed methoxylation of the chromone ligand in complexes.36 The characteristic band consistent with the asymmetric stretching (Δν = 58, 79 and 51 cm−1 for complexes 1–3, respectively) in the region 1484–1405 cm−1 and in plane bending vibrations (Δν = 37, 38 and 48 cm−1 for complexes 1–3, respectively) in the region 769–719 cm−1 was observed which split into two bands with comparatively small separation, validates unidentate coordination of nitrate ion to the Cu(II) ion in the complexes.37 In far-IR region, medium intensity signature bands at 500–530 cm−1 and 430–410 cm−1 were witnessed, attributed to the formation of M–N and M–O vibrations, respectively in all the complexes.38
ESI-MS spectra of complexes 1–3 depicted prominent peaks at m/z 510.80, 486.10 and 613.00 which corresponds to the molecular ion peak [C22H16CuN3O7]+, [C20H16CuN3O7]+ and [C28H30CuN3O9]+, respectively. Other fragmentation peaks for complexes 1–3 were observed at m/z 448.80, 425.60 and 551.00 which were assigned to [C22H16CuN3O7–NO3]+, [C20H16CuN3O7–NO3]+ and [C28H30CuN3O9–NO3]+ moieties, respectively (Fig. S2†).
Electronic spectra of complexes 1–3 were recorded in DMSO which exhibited two intense absorption bands in the range 252–280 nm and 305–310 nm attributed to π–π* and n–π* intra-ligand transitions, respectively19 and a lower energy absorption perceived around 350–370 nm was ascribed to LMCT transitions.39 Weak absorptions corresponding to d–d bands, in the visible region at 640–660 nm validate pentacoordinated geometry around the central Cu(II) center of the complexes.
Paramagnetic nature of the complexes was validated employing EPR in solid state at room temperature on 9.1 GHz frequency under a magnetic field strength of 3000 G (Fig. S3†). X-band EPR spectra of complexes exhibited the isotropic band centered at g values given in Table 1. The complexes demonstrated trend g∥ > g⊥ > 2.02, which revealed that the unpaired electron was mainly located in the dx2−y2 orbital i.e. (eg)4(a1g)2(b1g)2(b2g)1, suggesting square pyramidal geometry of copper complexes which is in agreement with the previously reported copper(II) complexes exhibiting similar geometry.40 Moreover, the complexes possess g∥ < 2.3 suggesting an appreciable metal–ligand covalent character.
| Complex | g∥ | g⊥ |
|---|---|---|
| Complex 1 | 2.0940 | 2.037 |
| Complex 2 | 2.0780 | 2.057 |
| Complex 3 | 2.0850 | 2.048 |
Description of the X-ray crystal structure
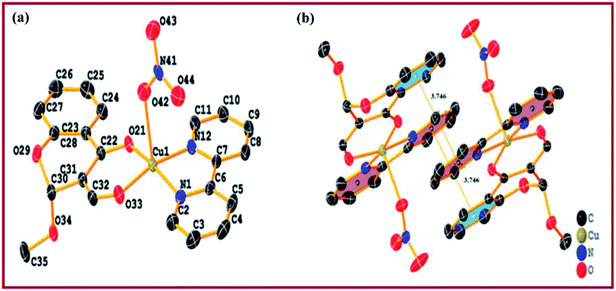
Single crystal X-ray diffraction studies revealed that the complex 2 crystallised in triclinic system with space group P![[1 with combining macron]](https://www.rsc.org/images/entities/char_0031_0304.gif) possessing lattice parameters, a = 9.2748(7) Å, b = 9.3970(8) Å, c = 12.7651(11) Å, α = 89.293(3), β = 70.077(3) and γ = 72.761(3) per unit cell. An ellipsoid view of complex 2 along with the atom numbering scheme is depicted in Fig. 1(a). Selected bond distances and bond angles are summarized in Table 2. The structure of complex 2 represents an asymmetric Cu(II) ion (CuN2O3 coordination environment) coordinated to a chromone ligand moiety through oxygen O,O-atoms with a solvate methoxy group at 2-position, along with two N,N-donor atoms from heterocyclic 2,2′-bipyridine and a NO3− ion. Ligand atoms form square base with oxygen atoms of the chromone carbonyl groups at equatorial positions, viz. [Cu(1)–O(33) = 1.9247(12) Å], [Cu(1)–O(21) = 1.9385(11) Å] and nitrogen atoms of 2,2′-bipyridine [Cu(1)–N(1) = 1.9944(14) Å], [Cu(1)–N(12) = 1.9989(14) Å], while nitrate ion makes a long axial coordination [Cu(1)–O(42) = 2.2673(13) Å], which is longer than the equatorial oxygen atoms expected due to presence of two electrons in the dz2 orbital of Cu(II).38 All Cu–O and Cu–N bond distances observed were within the range of other reported penta-coordinated Cu(II)-based complexes such as [Cu(nal)(bpy)(H2O)](ClO4).38c Moreover, the structural index value τ of 0.018 [τ = (β − α)/60, where α = O(1)–Cu(1)–N(1) = 165.53(9)° and β = O(2)–Cu(1)–N(2) = 170.90(8)°; for perfect square pyramidal and trigonal bipyramidal geometries the τ values are zero and unity, respectively] confirmed slight distorted square pyramidal geometry around copper(II).41 Packing diagram depicted intermolecular π–π stacking interactions between aromatic rings of 3-formylchromone and 2,2′-bipyridine (Fig. 1(b)). Intermolecular hydrogen bonding interactions [C–O⋯H, C–H⋯O and N–O⋯H] involving methoxy oxygen substituted at 2-position of 3-formylchromone, carbonyl oxygen and distorted nitrato oxygen were observed, facilitating stabilization of complex framework in crystal lattice (Fig. S4†).
possessing lattice parameters, a = 9.2748(7) Å, b = 9.3970(8) Å, c = 12.7651(11) Å, α = 89.293(3), β = 70.077(3) and γ = 72.761(3) per unit cell. An ellipsoid view of complex 2 along with the atom numbering scheme is depicted in Fig. 1(a). Selected bond distances and bond angles are summarized in Table 2. The structure of complex 2 represents an asymmetric Cu(II) ion (CuN2O3 coordination environment) coordinated to a chromone ligand moiety through oxygen O,O-atoms with a solvate methoxy group at 2-position, along with two N,N-donor atoms from heterocyclic 2,2′-bipyridine and a NO3− ion. Ligand atoms form square base with oxygen atoms of the chromone carbonyl groups at equatorial positions, viz. [Cu(1)–O(33) = 1.9247(12) Å], [Cu(1)–O(21) = 1.9385(11) Å] and nitrogen atoms of 2,2′-bipyridine [Cu(1)–N(1) = 1.9944(14) Å], [Cu(1)–N(12) = 1.9989(14) Å], while nitrate ion makes a long axial coordination [Cu(1)–O(42) = 2.2673(13) Å], which is longer than the equatorial oxygen atoms expected due to presence of two electrons in the dz2 orbital of Cu(II).38 All Cu–O and Cu–N bond distances observed were within the range of other reported penta-coordinated Cu(II)-based complexes such as [Cu(nal)(bpy)(H2O)](ClO4).38c Moreover, the structural index value τ of 0.018 [τ = (β − α)/60, where α = O(1)–Cu(1)–N(1) = 165.53(9)° and β = O(2)–Cu(1)–N(2) = 170.90(8)°; for perfect square pyramidal and trigonal bipyramidal geometries the τ values are zero and unity, respectively] confirmed slight distorted square pyramidal geometry around copper(II).41 Packing diagram depicted intermolecular π–π stacking interactions between aromatic rings of 3-formylchromone and 2,2′-bipyridine (Fig. 1(b)). Intermolecular hydrogen bonding interactions [C–O⋯H, C–H⋯O and N–O⋯H] involving methoxy oxygen substituted at 2-position of 3-formylchromone, carbonyl oxygen and distorted nitrato oxygen were observed, facilitating stabilization of complex framework in crystal lattice (Fig. S4†).
| 2 | |
|---|---|
| Bond length [Å] | |
| Cu1–O33 | 1.9247(12) |
| Cu1–O21 | 1.9385(11) |
| Cu1–N1 | 1.9944(14) |
| Cu1–N12 | 1.9989(14) |
| Cu1–O42 | 2.2673(13) |
![[thin space (1/6-em)]](https://www.rsc.org/images/entities/char_2009.gif) |
|
| Bond angles [deg] | |
| O33–Cu1–O21 | 93.74(5) |
| O33–Cu1–N1 | 89.58(5) |
| O21–Cu1–N12 | 93.15(5) |
| N1–Cu1–N12 | 81.48(6) |
| O21–Cu1–N1 | 166.64(5) |
| O33–Cu1–N12 | 167.75(5) |
| O33–Cu1–O42 | 94.12(5) |
| O21–Cu1–O42 | 88.52(5) |
| N1–Cu1–O42 | 104.16(5) |
| N12–Cu1–O42 | 96.18(5) |
| C2–N1–C6 | 119.32(15) |
| C2–N1–Cu1 | 125.99(12) |
| C6–N1–Cu1 | 114.40(11) |
Solution stability studies
The stability of complexes 1–3 has been confirmed using UV-vis spectroscopy by recording absorption spectra in Tris–HCl buffer under physiological conditions (pH = 3.40 & T = 310 K) and at different time intervals (0 h, 2 h, 12 h and 24 h) (Fig. S5†). No change in absorption spectra were recorded in either the intensity or the position of the absorption bands.Moreover, results did not show any appreciable change in absorption spectra of complexes 1–3 even after 24 h suggesting the stability of complexes under physiological conditions.42
Comparative in vitro ct-DNA/tRNA binding studies
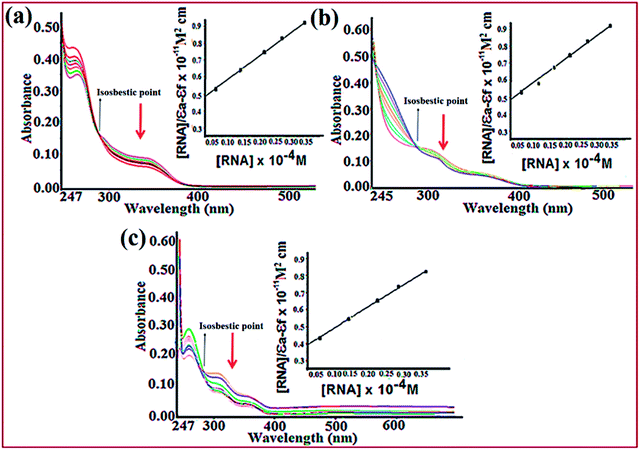
Electronic absorption titration of complexes 1–3 was evaluated in absence and presence of ct-DNA/tRNA. With cumulative addition of ct-DNA/tRNA (0.00–4.0 × 10⁻⁵ M) to the fixed concentration of complexes 1–3 (2 × 10⁻⁴ M), ligand centered LMCT absorption band at 325–400 nm (band I) demonstrated ‘hypochromism’ (56, 33 and 40%) with a red shift of 2–4 nm, suggestive of intercalation binding mode.43 Additionally, the band centered at 265–290 nm (band II) exhibited ‘hyperchromism’ (35, 25 and 30%) accompanied with a blue shift of 5–7 nm indicative of the stabilisation of DNA double helix and RNA.44 Moreover, complexes 1–3 recorded an isosbestic point at 295–298 nm implicating equilibrium between the free and DNA-bound probe in the ground state indicating only one mode of binding is more dominant with ct-DNA and tRNA (Fig. 2).45,46 Typically, intercalation involves π-stacking interaction of aromatic chromophore of ligand with nucleic acid base pairs. The observed hypochromism in complexes 1–3 could be attributed to π–π stacking between the aromatic planar chromophore of chromone and N,N-donor ligand scaffolds with nucleic acid base pairs. To quantitatively compare the binding strengths of complexes 1–3 with ct-DNA/tRNA, the intrinsic binding constant Kb was ascertained, using the Wolfe–Shimer eqn (1):47
 | (1) |
The intrinsic binding constants, Kb values with ct-DNA and tRNA have been calculated which follow the same order for complexes 1 > 3 > 2 but with higher binding propensity for tRNA, greater in magnitude as compared to ct-DNA (Fig. S6†). The observed Kb values are comparable to other reported N,N-donor copper complexes (Table 3).48,49 The experimental findings demonstrate stronger interactions of complexes with nucleic acids, specifically targeted to tRNA than ct-DNA which could be due to striking difference in the 3-dimensional morphology of ct-DNA and tRNA. The ‘shallow groove side’ available in RNA may possibly form hydrogen bonds to the hydroxyl and phosphate groups with the aromatic chromophore ligand viz., chromone and N,N-donor resulting in higher binding affinity of complexes towards tRNA. Previous literature reports reveal that many small molecules have been designed to target RNAs secondary structure such as bulges and helices.50 Recently, efforts have been addressed to use many privileged ligand scaffolds (aminoglycosides, macrolides, tetracyclines and oxazolidinones) including metallodrugs to selectively target ncRNAs viz., bacterial RNAs, viral RNAs, and messenger mRNAs but there are fewer reports on Cu(II) based chromone drug entities targeting to RNA.
| Complexes | Absorption spectroscopy Kb (×104 M−1) | Emission spectroscopy | ||
|---|---|---|---|---|
| K (×104 M−1) | Ksv (×104 M−1) | |||
| 1 | ct-DNA | 5.81(±0.2) | 4.77(±0.31) | 6.12(±0.05) |
| tRNA | 9.4(±0.11) | 8.4(±0.1) | 9.4(±0.4) | |
| 2 | ct-DNA | 2.5(±0.4) | 1.8(±0.08) | 3.8(±0.13) |
| tRNA | 4.7(±0.2) | 5.6(±0.05) | 7.2(±0.1) | |
| 3 | ct-DNA | 3.05(±0.1) | 3.89(±0.4) | 4.68(±0.02) |
| tRNA | 2(±0.12) | 6.8(±0.21) | 8.8(±0.5) | |
Binding affinity was improved by introduction of phen moiety in complex 1 which possess planar aromatic ring systems that stacks easily into A–T base pairs by intercalation.51 Complex 2 showed a relatively less binding affinity which implicates that two non-coplanar pyridyl rings would be engaged in weaker π–π stacking interactions. On the contrary, 1R,2R-DACH lacks any such planar aromatic ring system, therefore also shows much poor interaction.
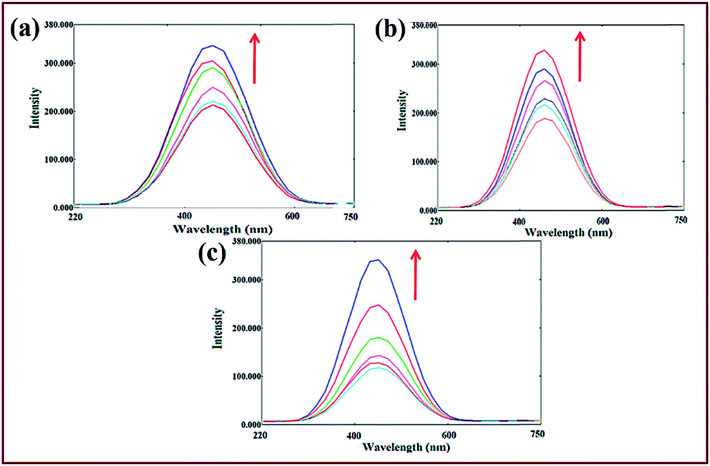
Emission spectral titrations of complexes 1–3 with ct-DNA/tRNA was performed to further substantiate the interaction mode. Fluorescence spectra of complexes 1–3 demonstrated an appreciable fluorescence at ca. 425–430 nm (λem) when excited with a wavelength of 305 nm light (λex) in absence of ct-DNA/tRNA. With concomitant addition of ct-DNA/tRNA (0–4.00 × 10⁻⁵ M), a gradual enhancement in the florescence intensity was observed without any apparent shift in emission maxima (Fig. 3). This enhancement in the intensity could be attributed to insertion of complexes into the hydrophobic environment of the interior ct-DNA/tRNA helix, reducing its accessibility to solvent molecules as well as restricting the mobility of complexes at the binding site, which thereby, causes reduction in vibrational modes leading to higher emission intensity.52
Binding strength of complexes 1–3 with ct-DNA/tRNA was determined by the binding constant (K) value derived from the Scatchard equation53 which corroborated well with absorption spectral studies (Table 3) which further authenticate our contention that complex 1 strongly bound to tRNA as compared to other complexes and ct-DNA (Fig. S7†).
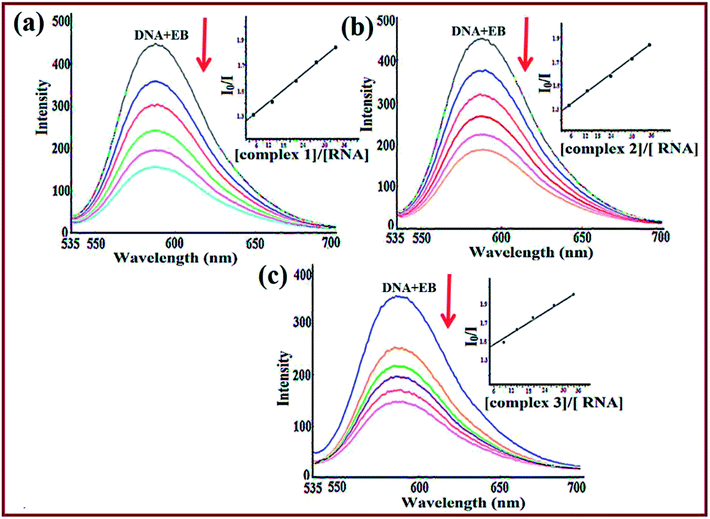
To further validate the binding mode of complexes, competitive binding studies with ethidium bromide was performed. EB is a strong fluorescent probe for the structure of DNA/RNA and emits fluorescence at ca. 600 nm due to strong intercalation between the adjacent base pairs. The enhanced fluorescence intensity was quenched upon addition of the second molecule by replacing the bound EB as the number of binding sites get decreased.54 With the subsequent addition of complexes 1–3 to EB–ctDNA/EB–tRNA system such that [complex]/[DNA or RNA] = 1![[thin space (1/6-em)]](https://www.rsc.org/images/entities/char_2009.gif) :
:![[thin space (1/6-em)]](https://www.rsc.org/images/entities/char_2009.gif) 1 to 6
1 to 6![[thin space (1/6-em)]](https://www.rsc.org/images/entities/char_2009.gif) :
:![[thin space (1/6-em)]](https://www.rsc.org/images/entities/char_2009.gif) 1, a substantial decrease was observed indicative of competition between EB and complexes towards ct-DNA/tRNA binding attributed to strong intercalation of complexes (Fig. 4). To quantify the magnitude of interaction, quenching efficiency was evaluated using the Stern–Volmer equation.55 The calculated Stern–Volmer constant, Ksv values (Table 3) for 1–3 revealed quenching in the order 1 > 3 > 2, well corroborated with spectroscopic studies exhibiting strong affinity for tRNA as compared to ct-DNA (Fig. S8†). The binding constant values revealed that complex 1 replaced EB more effectively as compared to complexes 2 and 3, which is in concordance with the results obtained from UV-vis titration studies.
1, a substantial decrease was observed indicative of competition between EB and complexes towards ct-DNA/tRNA binding attributed to strong intercalation of complexes (Fig. 4). To quantify the magnitude of interaction, quenching efficiency was evaluated using the Stern–Volmer equation.55 The calculated Stern–Volmer constant, Ksv values (Table 3) for 1–3 revealed quenching in the order 1 > 3 > 2, well corroborated with spectroscopic studies exhibiting strong affinity for tRNA as compared to ct-DNA (Fig. S8†). The binding constant values revealed that complex 1 replaced EB more effectively as compared to complexes 2 and 3, which is in concordance with the results obtained from UV-vis titration studies.
Circular dichroism
Circular dichroism (CD) is a powerful technique used to monitor the morphological changes during complex–nucleic acids interaction. CD spectra of complexes 1–3 upon incubation with ct-DNA demonstrated a decrease in the intensity of both positive (ellipticity) and negative (helicity) bands with a red shift suggesting intercalation of complexes with ct-DNA (Fig. S9†). The decrease in positive band implicates that complexes could unwind the helix of ct-DNA leading to the loss of helicity. Moreover, red shift observed in the bands revealed that complexes could induce changes in the helicity and base stacking signatures that may result in B → A conformational change of DNA double helix.56The CD spectrum of free tRNA showed four major peaks at 208 and 240 nm (negative), 221 and 270 nm (positive) corresponding to A-conformation of tRNA. With addition of complexes 1–3 ([complex]/[tRNA] = 1), greater amplification in 208 and 270 nm bands was observed whereas the bands at 221 and 240 nm showed decrease to a lesser extent (Fig. S9†).57 Enhancement in intensity of the band at 270 nm with increase in concentration of complexes 1–3 was in agreement with the intercalative binding mode of complexes with tRNA. Furthermore, absence of any shift in the CD bands at 210 and 270 nm revealed that there was no change in the conformation of tRNA.58
EPR spectroscopic studies of complex–ct-DNA/tRNA interactions
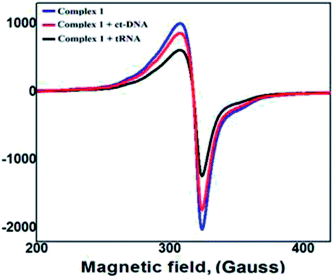
EPR spectra of complexes 1–3 were recorded in the absence and presence of (1.4 mg mL−1) ct-DNA/tRNA which exhibited one parallel (g∥) and one perpendicular signal (g⊥). In presence of ct-DNA/tRNA, EPR spectra of 1 demonstrated weaker signals with slight shift in the g∥ value, indicating that complex get bound to ct-DNA/tRNA.59 However, the spectra of complex–tRNA showed much weaker signals as compared to complex–ct-DNA (Fig. 5). Similarly, complexes 2 and 3 exhibited similar intensity pattern for complex–ct-DNA/tRNA (Fig. S10†).Hirshfeld surface analysis
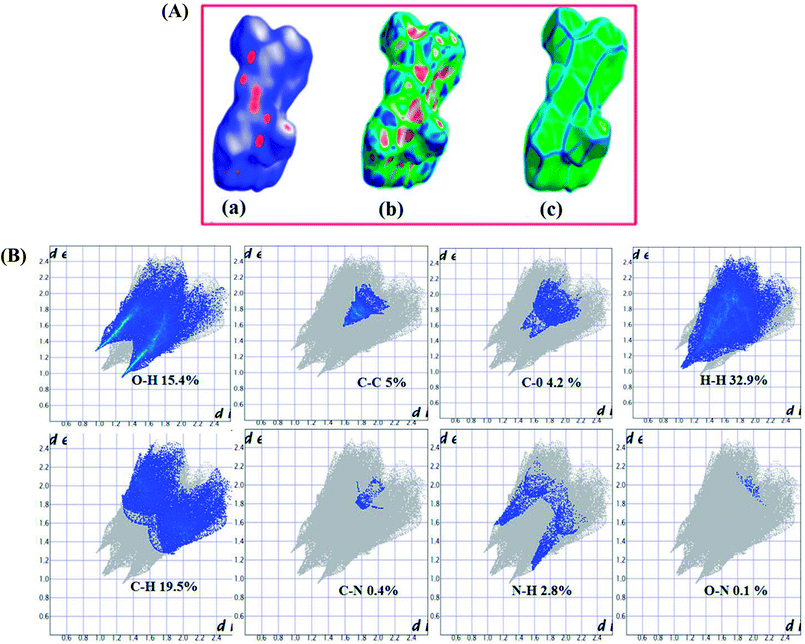
The Hirshfeld surfaces of complex 2 are shown in Fig. 6(A) depicting surfaces that have been mapped over dnorm (−0.5 to 1.5 Å), shape index (−1.0 to 1.0 Å) and curvedness (−4.0 to 0.4 Å). The dnorm parameter of 2 highlights surface with a red-white-blue coloured scheme where deep red regions correspond to close contact interactions, such as hydrogen bonding contacts viz., C–O⋯H and N–O⋯H. White areas depicted contacts around the van der Waals interactions like H⋯H contacts whereas the blue regions are devoid of such close contacts.60 The shape index of complex 2 depicted red concave regions with ‘bow-tie patterns’ which corresponds to C–H⋯π interactions indicative of the presence of aromatic (π⋯π) stacking interactions. The curvedness surface represents the electron density present around the different molecular interactions.The 2D-fingerprint plots of complex 2 provide quantitative information about the contributions arising from various intermolecular interactions to Hirshfeld surfaces (Fig. 6(B)).
Cleavage activity
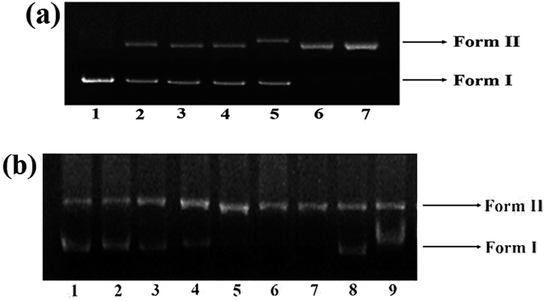
The DNA cleavage ability of complex 1 was assessed by agarose gel electrophoresis as it exhibited higher binding propensity as compared to other complexes. The gel electrophoretic assay was scrutinized employing supercoiled pBR322 DNA as a substrate in a medium of 5 mM Tris–HCl/50 mM NaCl buffer at pH 7.2. By monitoring the conversion of supercoiled, SC form (Form I) to the nicked circular, NC form (Form II) and linear, LC form (Form III).61 A concentration-dependent DNA cleavage was performed in order to determine the ability of 1 to cleave SC DNA in the absence of any reducing agent. With increase in concentration of complex 1 (5–30 μM), a more intensified NC, Form II was observed (Fig. 7(a); lane 2–7) demonstrating sufficient conversion of Form I into Form II at 30 μM concentration, implicating efficient single-strand cleavage of the DNA double helix by the complexes.The cleavage activity of complex 1 was ascertained in presence of exogenous agents viz., ascorbate (Asc), glutathione (GSH), H2O2 and 3-mercaptopropionic acid (MPA) which revealed significant enhancement of cleavage pattern which followed the order H2O2 > MPA ≈ GSH > Asc (Fig. 7(b)) similar to cleavage observed for many previously reported copper(II) complexes.12,62
Furthermore, to predict the mechanistic pathway of complex 1, different reactive oxygen species (ROS) viz., EtOH and DMSO (hydroxyl radical scavengers), NaN3 (singlet oxygen scavenger, 1O2) and SOD (superoxide anion radical, O2˙−) were employed to perform DNA cleavage reactions. No significant quenching efficiency of DNA cleavage was observed in presence of DMSO and EtOH (Fig. 7(b)), ruling out the possibility of hydrolytic cleavage pathway, involving diffusible hydroxyl radicals in the cleavage reaction. However, in presence of NaN3 and SOD, significant inhibition of DNA occurred which implicated oxidative cleavage pathway of complex 1 and suggested that ROS, singlet oxygen quencher, 1O2 and the superoxide anion radical scavenger, O2˙− could be responsible for the cleavage reactions.63 To predict the hypothesis for DNA cleaving ability of complex 1, formation of copper peroxide could be perhaps, the suggested mechanistic pathway for oxidative DNA damage of complexes under physiological conditions.64 In presence of reducing agent viz., H2O2, Cu(II) complex 1 may possibly get reduced to Cu(I), which could react with endogenous oxygen to produce hydrogen peroxide, which consequently reacts with another equivalent of Cu(I) complex to generate copper-oxido species with DNA damaging properties. Mostly, cancer cells possess higher intracellular concentration of H2O2, which assists the generation of highly active copper-oxido and ROS species which could mediate DNA strand scission via oxidative DNA damage the cancerous cells which may induce cell death.61 DNA cleavage mechanism are given below:
| Cu(II) → Cu(I) | (2) |
| Cu(I) + O2 → Cu(II) + O2− | (3) |
| 2O2− + 2H+ → O2 + H2O2 | (4) |
| ROS species + DNA → DNA cleavage | (5) |
The ability of metal ions to promote tRNA cleavage, has the potential to reveal regions of the RNA molecule in close proximity to metal ion on the outer part of the folded RNA molecule. Previous literature reports reveal that single-stranded regions in RNA are spontaneously cleaved 100-fold more effectively than double-stranded regions because single-stranded regions can sample the in-line conformation required for cleavage activity.65
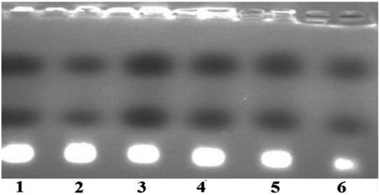
In presence of complex 1, the cleavage pattern of tRNA revealed little effect on tRNA bands after 2 h incubation imitating partial degradation of tRNA. However, pattern of cleavage became more conspicuous on increasing the concentration (6.25–19.37 μM) and with the time of exposure (Fig. 8). The cleavage at a concentration of 19.37 μM was almost complete (80–90%) (Fig. 8; lane 6) and after 6 h, largely diminished intensity band of tRNA was witnessed. Since the cleavage rate enhanced as a function of both incubation time and concentration, therefore it was inferred that tRNA cleavage is both time and concentration dependent.
Cytotoxic studies
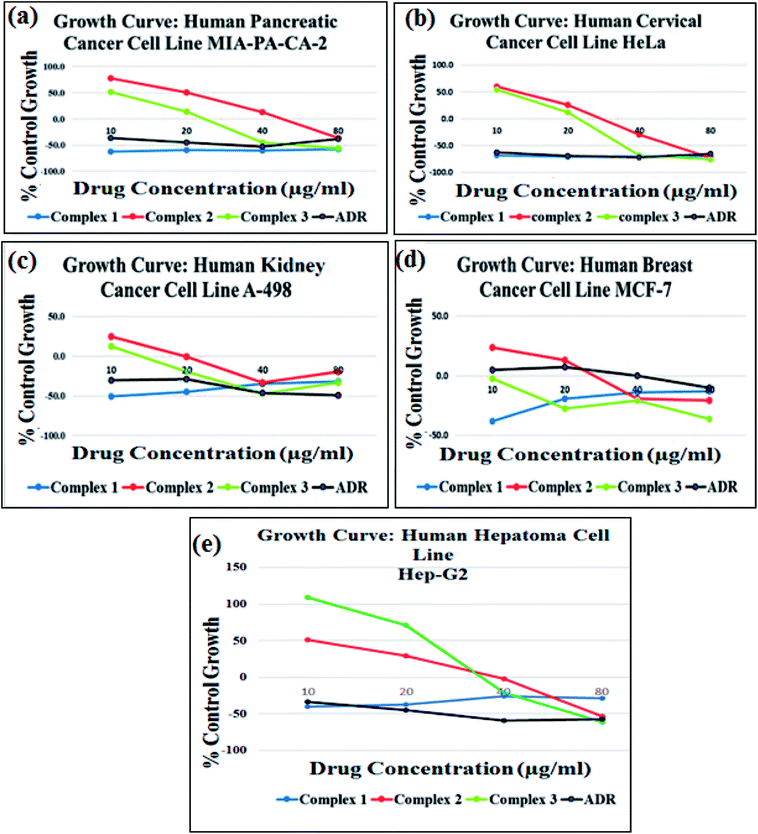
The cytotoxic activity of complexes 1–3 was investigated against a panel of five human cancer cell lines, viz., MIA-PA-CA-2 (pancreas), HeLa (cervix), A-498 (kidney), MCF-7 (breast) and Hep-G2 (human hepatoma) and was evaluated in terms of GI50 values by semi-automated sulforhodamine-B (SRB) assay (Fig. 9). The antitumor screening data revealed excellent anticancer activity complexes 1–3 towards all five cancer cell lines with GI50 < 10 μg mL−1 (<20 μM) values, (Table 4) except complex 2 and complex 3 against MIA-PA-CA-2 and Hep-G2 cell lines, respectively. Interestingly, complex 1 exhibited better anticancer activity towards MIA-Pa-Ca-2, HeLa and MCF-7 cell lines which were even better than that of the standard anticancer drug adriamycin (ADR). The observed results revealed the most potent inhibitory effects of complex 1 against the tested cancer cell lines which corroborated well with the results of binding studies validating the candidature of complex 1 as promising wide spectrum anticancer drug entity. Previous literature reports have also demonstrated remarkable cytotoxicity with significantly lower IC50 values of Cu(II) diimine complexes [Cu(sal)(diimine)(ClO4)]2 (ref. 38a) and [Cu(bimda)(diimine)]38b, [[Cu(nal)(diimine)(H2O)](ClO4)] against selected cancer cell lines.38c| Cell lines | ||||||
|---|---|---|---|---|---|---|
| MIA-PA-CA-2 | HeLa | A-498 | MCF-7 | Hep-G2 | ||
| a GI50 = growth inhibition of 50% (GI50) calculated from [(Ti − Tz)/(C − Tz)]100 = 50, drug concentration that results in a 50% reduction in the net protein increase. ADR = adriamycin (taken as a positive control compound). TGI = tumor growth inhibition. LC50 = lethal concentration of 50% (LC50). NE = non-evaluable data. | ||||||
| GI50 | Complex 1 | <10 | <10 | <10 | <10 | <10 |
| Complex 2 | 22.3 | <10 | <10 | <10 | <10 | |
| Complex 3 | <10 | <10 | <10 | <10 | 26.9 | |
| ADR | <10 | <10 | <10 | <10 | <10 | |
| TGI | Complex 1 | NE | <10 | <10 | NE | <10 |
| Complex 2 | 53.9 | 35.3 | 24.4 | 36.3 | 41.9 | |
| Complex 3 | 31.4 | 26.6 | <10 | <10 | 47.7 | |
| ADR | <10 | <10 | <10 | 39.3 | <10 | |
| LC50 | Complex 1 | NE | <10 | <10 | NE | NE |
| Complex 2 | >80 | 62.6 | NE | NE | 76.2 | |
| Complex 3 | 66.1 | 54.7 | >80 | NE | 68.5 | |
| ADR | NE | NE | NE | NE | 41.9 | |
The morphological changes observed in MIA-Pa-Ca-2 and MCF-7 cells exposed to complexes 1–3 for a period of 48 h are shown in Fig. 10. Upon exposure of complexes 1–3 to MIA-Pa-Ca-2 and MCF-7 cell lines, a reduction in the normal morphology and cell adhesion capacity was witnessed as compared to the control. Complex 1 exhibited greater selectivity towards the cancer cells which could be attributed to the presence of recognition domain, phen moiety which induces the complex to intercalate into the base pairs of the DNA, consequently, exhibiting better cleavage and cytotoxic properties ultimately, leading to cell death.66
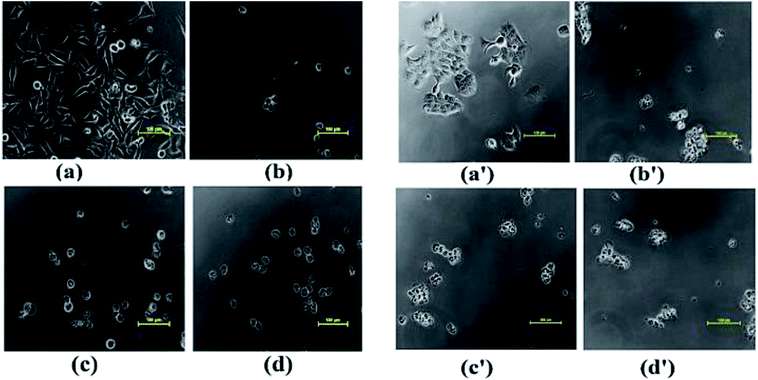 | ||
| Fig. 10 Morphological changes observed in cancer cell lines on treating with (a) MIA-Pa-Ca-2 control, (b) complexes 1, (c) 2 and (d) 3; (a′) MCF-7 control, (b′) complexes, 1 (c′) 2 and (d′) 3. | ||
Molecular docking studies
Molecular docking studies were employed in order to understand the most probable binding site of complexes 1–3 with ct-DNA. The minor groove of DNA helix acts as a preferred target for small molecules as closer vicinity of strands allows more intimate contact in surface area and therefore, get tightly bind with best fitting.67 The planarity of ancillary N,N-donor ligands are compatible for strong π–π stacking interactions of aromatic moieties present in ligands and also for better match of complexes inside ct-DNA strands. The energetically most favorable docked pose revealed that complexes 1–3 interact in the intercalative sites of DNA helix or at the curve contour in narrow and slightly deeper C–G rich region of minor groove of the targeted DNA (Fig. 11(a) and S10†).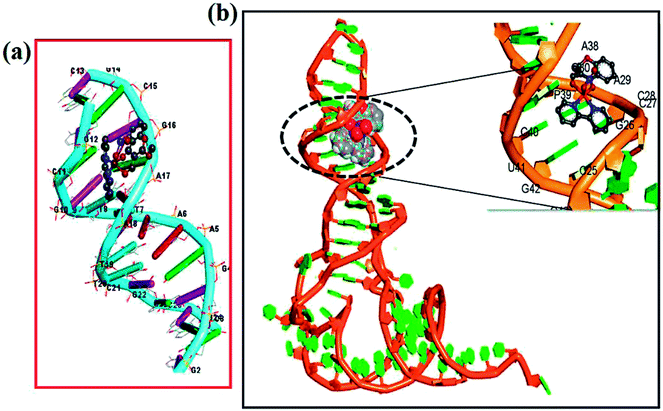 | ||
| Fig. 11 Molecular docked model of complex 2 with (a) ct-DNA (PDB ID: 1BNA) and (b) tRNA (PDB ID: 6TNA). | ||
Docking studies were also performed with tRNA (PDB ID: 6TNA) to corroborate our spectroscopic results. tRNA consists of well defined 3D structure with regions like D arm, T arm, ψ loop, acceptor stem and anticodon arm which participate directly or indirectly to the target for specific recognition process. The docking results implicated that complexes 1–2 inserted into the active pockets of anticodon arm in close proximity to C-40, A-35, A-36, A-38, G-43, C-40, U-41 and C-28 (Fig. 11(b))68 whereas 3 was located between upper and lower stem with close proximity to U-59, U-16, U-8, A-21, A-14, C-48, C-63 and G-57 (Fig. S10b†).
The subsequent binding energies of complexes 1–3 calculated for the best-docked pose with ct-DNA target were found to be −289.38, −235.37 and −267 kJ mol−1, respectively and −345.06, −306 and −327 kJ mol−1, respectively for tRNA. More negative binding energy value signifies greater binding propensity of a metal complex, which correlated well with our in vitro ct-DNA/tRNA binding.
Conclusions
New tailored Cu(II) therapeutic entities 1–3 were synthesized from bioactive chromone pharmacophore and N,N-donor ancillary ligands for their use as antitumor chemotherapeutic agents. The complexes 1–3 were thoroughly characterized by various spectroscopic techniques (IR, UV-vis, EPR and ESI-MS) and single X-ray crystallography in case of complex 2. Structure activity correlation studies {DNA/RNA binding profile} of complexes 1–3 with ct-DNA/tRNA employing UV-vis, fluorescence, EPR and circular dichroism were carried out. The corroborative results of these experiments showed higher binding propensity of tRNA as compared to ct-DNA. It was observed that by varying the N,N-donor ligands such as 1,10-phenanthroline, 2,2′-bipyridine and 1R,2R-DACH (incorporated as recognition domains) in the potential drug molecules, changed the biological activity. For example, complex 1 exhibits structural novelty as it possess an intercalating phen moiety conjugated with 3-formylchromone which showed much pronounced binding with tRNA, higher in the order of magnitude than that of ct-DNA. We also performed the cleavage activity of complexes 1–3 with pBR322 DNA which revealed an efficient single strand cleaving ability in all the complexes; mechanism of cleavage was mediated via oxidative pathway involving ROS, singlet oxygen, 1O2 and the superoxide anion, O2˙− and peroxide-assisted cleavage reactions.Additionally, tRNA cleavage of complexes 1–3 were also employed which revealed efficient cleavage and were both concentration and time dependent. Analysis of Hirshfeld surfaces and fingerprint plots were employed to determine a comparison between intermolecular interactions that involve C–O⋯H, N–O⋯H and C–H⋯O linkages into a two-dimensional framework. In this work, strenuous efforts have been made to design and synthesize successfully tailored tRNA targeted copper-based antitumor drug entities and validated their cytotoxic activity. In vitro cytotoxic activity of 1–3 was carried out on a panel of four human cancer cell lines by SRB assay, which revealed that the synthesized complexes were active towards most of the tested cell lines with GI50 value < 10 μg mL−1 (<20 μM). Moreover, the growth curve data revealed greater potency of complex 1 towards MIA-Pa-Ca-2, HeLa and MCF-7 cell lines which was even better than our standard drug (ADR) and exhibited more potent cytotoxic activity that the other two complexes 2 and 3. The complex 1 is very promising for chemotherapeutic intervention in pancreatic cancers while the others are active on a wide spectrum of the tested cancer cell lines. Further in vivo studies for complex 1 are warranted and are in progress.
Experimental
Materials and instrumentations
3-Formylchromone, 1,10-phenanthroline, 2,2′-bipyridine, 1R,2R-DACH were purchased from Sigma Aldrich. All reagents were of best commercial grade and were used without any further purification. Molar conductance was measured at room temperature on a Eutech con 510 electronic conductivity bridge. Elemental analysis were employed on Carlo Erba Analyzer Model 1106. Fourier-transform infrared (FT-IR) spectrum were recorded on an Interspec 2020 and Spectrum Two (Perkin Elmer) FT-IR spectrometers. The EPR spectrum of copper complexes 1–3 were assessed on a Varian E 112 ESR spectrometer using X-band frequency (9.5 GHz) at room temperature. ESI-MS spectra were recorded on Micromass Quattro II triple quadrupole mass spectrometer. Electronic and emission spectrum were recorded on UV-1700 PharmaSpec UV-vis spectrophotometer (Shimadzu) and RF-5301PC Spectrofluorophotometer (Shimadzu), respectively. CD spectra were obtained on Jasco J-815-CD spectropolarimeter. All experiments involving the interaction of complexes 1–3 with ct-DNA/tRNA were carried out in aerated buffer (5 mM Tris–HCl, 50 mM NaCl, pH = 7.2). The concentration per base pairs for both ct-DNA and tRNA were obtained spectrophotometrically by assuming ε260 nm values to be 6600 and 7700 M−1 cm−1, respectively.69 Cleavage experiments were performed with the help of Axygen electrophoresis supported by a Genei power supply with a potential range of 50–500 V, visualized and photographed by a Vilber-INFINITY gel documentation system.Synthesis of Cu(II) complexes
![[thin space (1/6-em)]](https://www.rsc.org/images/entities/char_2009.gif) :
:![[thin space (1/6-em)]](https://www.rsc.org/images/entities/char_2009.gif) 1
1![[thin space (1/6-em)]](https://www.rsc.org/images/entities/char_2009.gif) :
:![[thin space (1/6-em)]](https://www.rsc.org/images/entities/char_2009.gif) 1 stoichiometric ratio under reflux condition for 4 h. The resulting solution was filtered and kept aside for slow evaporation at room temperature. Green precipitate was collected after 3 days which were soluble in organic solvents like MeOH, DCM, DMF and DMSO.
1 stoichiometric ratio under reflux condition for 4 h. The resulting solution was filtered and kept aside for slow evaporation at room temperature. Green precipitate was collected after 3 days which were soluble in organic solvents like MeOH, DCM, DMF and DMSO.Yield: 84%, melting point: 195 °C. Elemental analysis calculated for C22H16CuN3O7: C, 54.07; H, 3.35; N, 8.22. Found: C, 54.87; H, 3.40; N, 8.12. FT-IR (KBr, υmax/cm−1): 3237 ν(C–H), 1617.01 ν(C![[double bond, length as m-dash]](https://www.rsc.org/images/entities/char_e001.gif) O), 2955.92 νasym(OCH3), 2874.89 νsym(OCH3), 1484, 1426 νasym(NO3), 757, 720 νbend(NO3). UV-vis (1 × 10⁻³ M, DMSO, λmax, nm) 285, 305, 365 and 652 (ε = 225 M−1 cm−1) (d–d transition). ΛM (1 × 10⁻³ M, DMSO): 9.13 Ω−1 cm2 mol−1 (non-electrolyte). ESI-MS (CH3OH): found m/z = 448.80 [Cu(L)(phen)]+ (calcd m/z = 448.05).
O), 2955.92 νasym(OCH3), 2874.89 νsym(OCH3), 1484, 1426 νasym(NO3), 757, 720 νbend(NO3). UV-vis (1 × 10⁻³ M, DMSO, λmax, nm) 285, 305, 365 and 652 (ε = 225 M−1 cm−1) (d–d transition). ΛM (1 × 10⁻³ M, DMSO): 9.13 Ω−1 cm2 mol−1 (non-electrolyte). ESI-MS (CH3OH): found m/z = 448.80 [Cu(L)(phen)]+ (calcd m/z = 448.05).
![[thin space (1/6-em)]](https://www.rsc.org/images/entities/char_2009.gif) :
:![[thin space (1/6-em)]](https://www.rsc.org/images/entities/char_2009.gif) 1
1![[thin space (1/6-em)]](https://www.rsc.org/images/entities/char_2009.gif) :
:![[thin space (1/6-em)]](https://www.rsc.org/images/entities/char_2009.gif) 1 under reflux condition for 4 h. The resulting solution was filtered and allowed to evaporate slowly at room temperature. Blue crystals suitable for single X-ray crystallography were obtained after 3–4 days of slow evaporation of the reaction mixture which were found to be stable towards air and soluble in organic solvents like MeOH, DCM, DMF and DMSO.
1 under reflux condition for 4 h. The resulting solution was filtered and allowed to evaporate slowly at room temperature. Blue crystals suitable for single X-ray crystallography were obtained after 3–4 days of slow evaporation of the reaction mixture which were found to be stable towards air and soluble in organic solvents like MeOH, DCM, DMF and DMSO.Yield: 80%, melting point: 185 °C. CCDC no. 1574863. Elemental analysis calculated for C20H16CuN3O7: calc. C, 51.80; H, 3.52, N, 8.63. Found: C, 51.01; H, 3.34, N, 8.96. FT–IR (KBr, υmax/cm−1): 2918 ν(C–H), 1619.7 ν(C![[double bond, length as m-dash]](https://www.rsc.org/images/entities/char_e001.gif) O), 2927.29 νasym(OCH3) and 2874.48 νsym(OCH3), 1484, 1405 νasym(NO3), 769, 731 νbend(NO3). UV-vis (1 × 10⁻³ M, DMSO, λmax, nm): 293, 306, 362 and 660 (ε = 200 M−1 cm−1) (d–d transition). ΛM (1 × 10⁻³ M, DMSO): 9.61 Ω−1 cm2 mol−1 (non-electrolyte). ESI-MS (CH3OH): found m/z = 425.60 [Cu(L)(bpy)]+ (calcd m/z = 424.05).
O), 2927.29 νasym(OCH3) and 2874.48 νsym(OCH3), 1484, 1405 νasym(NO3), 769, 731 νbend(NO3). UV-vis (1 × 10⁻³ M, DMSO, λmax, nm): 293, 306, 362 and 660 (ε = 200 M−1 cm−1) (d–d transition). ΛM (1 × 10⁻³ M, DMSO): 9.61 Ω−1 cm2 mol−1 (non-electrolyte). ESI-MS (CH3OH): found m/z = 425.60 [Cu(L)(bpy)]+ (calcd m/z = 424.05).
![[thin space (1/6-em)]](https://www.rsc.org/images/entities/char_2009.gif) :
:![[thin space (1/6-em)]](https://www.rsc.org/images/entities/char_2009.gif) 1
1![[thin space (1/6-em)]](https://www.rsc.org/images/entities/char_2009.gif) :
:![[thin space (1/6-em)]](https://www.rsc.org/images/entities/char_2009.gif) 1 under reflux for 4 h. The resulting solution was filtered. Very fine green coloured needle like crystals were obtained upon slow evaporation of solvent at room temperature.
1 under reflux for 4 h. The resulting solution was filtered. Very fine green coloured needle like crystals were obtained upon slow evaporation of solvent at room temperature.Yield: 70%, melting point: 180 °C. Elemental analysis calculated for C28H30CuN3O9: C, 54.76; H, 4.60; N, 6.84; found C, 54.82; H, 4.77; N, 6.71. FT-IR (KBr, υmax/cm−1): 3278 ν(N–H), 1607.00 ν(HC![[double bond, length as m-dash]](https://www.rsc.org/images/entities/char_e001.gif) N), 1666.19 ν(C
N), 1666.19 ν(C![[double bond, length as m-dash]](https://www.rsc.org/images/entities/char_e001.gif) O), 2936.36 νasym(OCH3), 2860.87 νsym(OCH3), 1481, 1433 νasym(NO3), 767, 719 νbend(NO3). UV-vis (1 × 10⁻³ M, DMSO, λmax, nm): 237, 260, 310, 362 and 645 (ε = 110 M−1 cm−1) (d–d transition). ΛM (1 × 10⁻³ M, DMSO): 8.17 Ω−1 cm2 mol−1 (non-electrolyte). ESI-MS (CH3OH): found m/z = 551.00 [Cu(L)(DACH)]+ (calcd m/z = 551.12).
O), 2936.36 νasym(OCH3), 2860.87 νsym(OCH3), 1481, 1433 νasym(NO3), 767, 719 νbend(NO3). UV-vis (1 × 10⁻³ M, DMSO, λmax, nm): 237, 260, 310, 362 and 645 (ε = 110 M−1 cm−1) (d–d transition). ΛM (1 × 10⁻³ M, DMSO): 8.17 Ω−1 cm2 mol−1 (non-electrolyte). ESI-MS (CH3OH): found m/z = 551.00 [Cu(L)(DACH)]+ (calcd m/z = 551.12).
Description of X-ray crystal structure
Single crystal X-ray structural studies of complex 2 was performed on a D8 VENTURE Bruker AXS diffractometer [*], employing graphite-mono-chromated Mo-Kα radiation generated from a fine-focus sealed tube (λ = 0.71073 Å) at 150 K. The structure was solved by dual-space algorithm using the SHELXT program70 and further refined with full-matrix least-square methods based on F2 (SHELXL).71 All non-hydrogen atoms were refined with anisotropic atomic displacement parameters. H atoms were finally included in their calculated position. The drawing of the complex was realized with PLATON.72 A summary of selected crystallographic information for complex 2 is given in Table 5.| Parameters | 2 |
|---|---|
| a GOF is defined as {Σ[w(F02 − Fc2)]/(n − P)}2 where n is the number of data and p is the number of parameters.b R = {Σ||F0| − |Fc||/Σ|F0|}, wR2 = {Σw(F02 − Fc2)2/Σw(F02)2}1/2. | |
| CCDC no. | 1574863 |
| Formula | C21H17CuN3O7 |
| Fw (g mol−1) | 486.92 |
| Crystal system | Triclinic |
| Space group | P![[1 with combining macron]](https://www.rsc.org/images/entities/char_0031_0304.gif) |
| a (Å) | 9.2748(7) |
| b (Å) | 9.3970(8) |
| c (Å) | 12.7651(11) |
| α (deg) | 89.293(3) |
| β (deg) | 70.077(3) |
| γ (deg) | 72.761(3) |
| U (Å3) | 994.09(14) |
| Z | 2 |
| ρcalc (g cm−3) | 1.627 |
| (mm−1) | 1.150 |
| F (000) | 498.0 |
| Crystal size (mm) | 0.150 × 0.060 × 0.020 |
| Temp (K) | 150 K |
| Measured reflns | 23![[thin space (1/6-em)]](https://www.rsc.org/images/entities/char_2009.gif) 356 356 |
| GOFa | 1.055 |
| Rb [I > 2σ(I)] | 0.0254 |
| wR2b (all data) | 0.0679 |
In vitro binding and cleavage experiments
Nucleic acids (ct-DNA/tRNA) binding experiments were carried out in Tris–HCl/NaCl (5![[thin space (1/6-em)]](https://www.rsc.org/images/entities/char_2009.gif) :
:![[thin space (1/6-em)]](https://www.rsc.org/images/entities/char_2009.gif) 50 mM) buffer at pH 7.2 by employing absorption spectroscopy, emission spectroscopy and circular dichroism following previously used standard methods and practices espoused by our laboratory.73 The cleavage experiments of complex 1 using supercoiled pBR322 DNA (300 ng) in Tris–HCl/NaCl (5
50 mM) buffer at pH 7.2 by employing absorption spectroscopy, emission spectroscopy and circular dichroism following previously used standard methods and practices espoused by our laboratory.73 The cleavage experiments of complex 1 using supercoiled pBR322 DNA (300 ng) in Tris–HCl/NaCl (5![[thin space (1/6-em)]](https://www.rsc.org/images/entities/char_2009.gif) :
:![[thin space (1/6-em)]](https://www.rsc.org/images/entities/char_2009.gif) 50 mM) buffer at pH 7.2 were performed using agarose gel electrophoresis. Furthermore, tRNA cleavage experiments were performed in a Tris–HCl 40 mM, pH 8.0 buffer by incubating the reaction mixture containing increasing concentration of complexes 1–3 for 24 h at 37 °C. The gel electrophoresis assay was carried out in presence of Tris–borate–EDTA buffer (TBE) for 180 min at 50 V cm−1. The gel was then allowed soaked for 30 min in and rinsed with distilled water. RNA fragments was further visualized, after incubation with EB (0.6 mg mL−1), using an UV transilluminator.
50 mM) buffer at pH 7.2 were performed using agarose gel electrophoresis. Furthermore, tRNA cleavage experiments were performed in a Tris–HCl 40 mM, pH 8.0 buffer by incubating the reaction mixture containing increasing concentration of complexes 1–3 for 24 h at 37 °C. The gel electrophoresis assay was carried out in presence of Tris–borate–EDTA buffer (TBE) for 180 min at 50 V cm−1. The gel was then allowed soaked for 30 min in and rinsed with distilled water. RNA fragments was further visualized, after incubation with EB (0.6 mg mL−1), using an UV transilluminator.
Hirshfeld surface analysis
Hirshfeld analysis along with 2D fingerprint plot for complex 2 was generated using crystal Explorer 3.1 (ref. 74) software based on results of single crystal X-ray diffraction studies.Molecular docking studies
Molecular docking studies were assessed using HEX 8.0 software.75 The structures of complexes 1–3 were converted into PDB format prior performing docking experiments. The crystal structures of ct-DNA (PDB ID: BDNA) and tRNA (PDB ID: 6TNA) were downloaded from protein data bank (http://www.rcsb.org./pdb). Visualization of complexes 1–3 has been done by Discovery Studio molecular graphics program.Cytotoxic studies
In vitro antitumor screening of 1–3 was performed on human cancer lines of four different histological origin viz., MIA-PA-CA-2 (pancreas), HeLa (cervix), A-498 (kidney) and MCF-7 (breast). The cell lines used in the experiment were obtained from NCI, USA and NCCS, Pune. Human malignant cell lines were grown and obtained in RPMI-1640 medium supplemented with 10% Fetal Bovine Serum (FBS) and antibiotics to study the growth pattern of these cells. The cells proliferation upon treatment with chemotherapy was determined by means of SRB assay.76Conflicts of interest
There are no conflicts to declare.Abbreviations
| phen | 1,10-Phenanthroline |
| Bpy | 2,2′-Bipyridine |
| ct-DNA | Calf thymus DNA |
| 1R,2R-DACH | 1R,2R-Diaminocyclohexane |
| tRNA | Yeast transfer RNA |
| SRB | Sulforhodamine-B |
| ADR | Adriamycin |
Acknowledgements
The authors are thankful to SAIF, CIL, Panjab University, Chandigarh, for ESI-MS and elemental analysis facility. The authors are grateful to ACTREC, Mumbai for carrying out the cytotoxic studies. Financial support to the Department of Chemistry, Aligarh Muslim University from the UGC under SAP DRS II Scheme and the DST under PURSE phase II programme is gratefully acknowledged. The author (Z. Afsan) expresses her gratitude to DST for fellowship under PURSE phase II programme.References
- (a) V. Gandin, F. Tisato, A. Dolmella, M. Pellei, C. Santini, M. Giorgetti, C. Marzano and M. Porchia, J. Med. Chem., 2014, 57, 4745–4760 CrossRef CAS PubMed; (b) Y. Gou, J. Qi, J. P. Ajayi, Y. Zhang, Z. Zhou, X. Wu, F. Yang and H. Liang, Mol. Pharmaceutics, 2015, 12, 3597–3609 CrossRef CAS PubMed.
- T. Hofbeck, U. Monkowius and H. Yersin, J. Am. Chem. Soc., 2015, 137, 99–404 CrossRef PubMed.
- (a) C. Chen, X. H. Xu, B. Yang and F. L. Qing, Org. Lett., 2014, 16, 3372–3375 CrossRef CAS PubMed; (b) B. Kumar Ghosh, S. Hazra, B. Naik and N. N. Ghosh, Powder Technol., 2015, 269, 371–378 CrossRef.
- D. Denoyer, S. Masaldan, S. L. Fontaine and M. A. Cater, Metallomics, 2015, 7, 1459–1476 RSC.
- L. R. Azuara and M. E. B. Gómez, Curr. Med. Chem., 2010, 17, 3606–3615 CrossRef.
- L. Finney, S. Vogt, T. Fukai and D. Glesne, Clin. Exp. Pharmacol. Physiol., 2009, 36, 88–94 CrossRef CAS PubMed.
- M. M. Eatock, A. Schatzlein and S. B. Kaye, Cancer Treat. Rev., 2000, 26, 191–204 CrossRef CAS PubMed.
- M. Grazul and E. Budzisz, Coord. Chem. Rev., 2009, 253, 2588–2598 CrossRef CAS.
- J. Reis, A. Gaspar, N. Milhazes and F. Borges, J. Med. Chem., 2017, 60, 7941–7957 CrossRef CAS PubMed.
- A. Gaspar, M. J. Matos, J. Garrido, E. Uriarte and F. Borges, Chem. Rev., 2014, 114, 4960–4992 CrossRef CAS PubMed.
- R. S. Keri, S. Budagumpi, R. K. Pai and R. G. Balakrishna, Eur. J. Med. Chem., 2014, 78, 340–374 CrossRef CAS PubMed.
- M. Usman, M. Zaki, R. A. Khan, A. Alsalme, M. Ahmad and S. Tabassum, RSC Adv., 2017, 7, 36056–36071 RSC.
- I. Yousuf, F. Arjmand, S. Tabassum, L. Toupet, R. A. Khan and M. A. Siddiqui, Dalton Trans., 2015, 44, 10330–10342 RSC.
- (a) M. Andrs, J. Korabecny, D. Jun, Z. Hodny, J. Bartek and K. Kuca, J. Med. Chem., 2015, 58, 41–71 CrossRef CAS PubMed; (b) S. Singh, A. T. Baviskar, V. Jain, N. Mishra, U. C. Banerjee, P. V. Bharatam, K. Tikoo and M. P. S. Isha, MedChemComm, 2013, 4, 1257–1266 RSC.
- R. H. Erickson, K. J. Natalie, W. Bock, Z. Lu, F. Farzin, R. G. Sherrill, D. J. Meloni, R. J. Sherrill, D. J. Meloni, R. J. Patch, W. J. Rzesotarski, J. Clifton, M. J. Pontecorvo, M. A. Bailey, K. Naper and W. Karbon, J. Med. Chem., 1992, 35, 1526–1535 CrossRef CAS PubMed.
- G. Kalaiarasi, S. R. J. Rajkumar, S. Dharani, V. M. Lynch and R. Prabhakaran, Inorg. Chim. Acta, 2018, 471, 759–776 CrossRef CAS.
- B. D. Wang, Z. Y. Yang, M. H. Lü, J. Hai, Q. Wang and Z. N. Chen, J. Organomet. Chem., 2009, 694, 4069–4075 CrossRef CAS.
- V. Barve, F. Ahmed, S. Adsule, S. Banerjee, S. Kulkarni, P. Katiyar, C. E. Anson, A. K. Powell, S. Padhye and F. H. Sarkar, J. Med. Chem., 2006, 49, 3800–3808 CrossRef CAS PubMed.
- M. Gaber, N. El-Wakiel, K. El-Baradie and S. Hafez, J. Iran. Chem. Soc., 2018 DOI:10.1007/s13738-018-1494-9.
- I. Correia, S. Borovic, I. Cavaco, C. P. Matos, S. Roy, H. M. Santose, L. Fernandese, J. L. Capeloe, L. R. Azuarag and J. C. Pessoa, J. Inorg. Biochem., 2017, 175, 284–297 CrossRef CAS PubMed.
- (a) L. Gasque, R. M. Esparza and L. R. Ramirez, J. Inorg. Biochem., 1992, 48, 121–127 CrossRef CAS; (b) W. L. Kwik and K. P. Ang, J. Inorg. Nucl. Chem., 1980, 42, 303–313 CrossRef CAS.
- E. Wong and C. M. Giandomenico, Chem. Rev., 1999, 99, 2451–2466 CrossRef CAS PubMed.
- G. Gasser, I. Ott and N. M. Nolte, J. Med. Chem., 2011, 54, 3–25 CrossRef CAS PubMed.
- S. Stern, B. Weiser and H. F. Noller, J. Mol. Biol., 1988, 204, 447–481 CrossRef CAS PubMed.
- L. Guan and M. D. Disney, ACS Chem. Biol., 2012, 7, 73–86 CrossRef CAS PubMed.
- C. S. Chow and F. M. Bogdan, Chem. Rev., 1997, 97, 1489–1513 CrossRef CAS PubMed.
- H. Xu, Y. Liang, P. Zhang, F. Du, B. R. Zhou, J. Wu, J. H. Liu, Z. G. Liu and L. N. Ji, J. Biol. Inorg Chem., 2005, 10, 529–538 CrossRef CAS PubMed.
- M. Cusumano, M. Letizia, D. Pietro, A. Giannetto and P. A. Vainiglia, Inorg. Chem., 2007, 46, 7148–7153 CrossRef CAS PubMed.
- K. Kota and S. Balasubramanian, Drug Discovery Today, 2010, 15, 733–740 CrossRef PubMed.
- D. M. Pereira, P. M. Rodrigues, P. M. Borralho and C. M. P. Rodrigues, Drug Discovery Today, 2013, 18, 282–288 CrossRef CAS PubMed.
- M. Chauhan, K. Banerjee and F. Arjmand, Inorg. Chem., 2007, 46, 3072–3082 CrossRef CAS PubMed.
- R. A. Khan, S. Yadav, Z. Hussain, F. Arjmand and S. Tabassum, Dalton Trans., 2014, 43, 2534–2548 RSC.
- T. Rosu, E. Pahontu, C. Maxim, R. Georgescu, N. Stanica, G. L. Almajan and A. Gulea, Polyhedron, 2010, 29, 757–766 CrossRef CAS.
- M. Shebl, O. M. I. Adly, A. Taha and N. N. Elabd, J. Mol. Struct., 2017, 1147, 438–451 CrossRef CAS.
- (a) K. Nakamoto, Infrared Spectra of Inorganic and Coordination Compounds, Wiley and Sons, New York, 1986, pp. 212, 232, 248, 251 and 256 Search PubMed; (b) K. Nakamoto, Infrared and Raman Spectra of Inorganic and Coordination Compounds, Wiley-Interscience, New York, 5th edn, 1997, p. 86 Search PubMed.
- A. D. Kulaczkowska and L. Mazur, J. Mol. Struct., 2011, 985, 233–242 CrossRef.
- (a) A. S. Potapov, E. A. Nudnov, A. I. Khlebnikov, V. D. Ogorodnikov and T. V. Petrenko, Inorg. Chem. Commun., 2015, 53, 72–75 CrossRef CAS; (b) B. Gliši, I. Aleksic, P. Comba, H. Wadepohl, T. Ilic-Tomic, J. Nikodinovic-Runic and M. I. Djuran, RSC Adv., 2016, 6, 86695–86709 RSC; (c) G. Sridhar, I. Mohammed Bilal, D. Easwaramoorthy, S. Kutti Rani, B. S. Kumar and C. Sai Manohar, J. Braz. Chem. Soc., 2017, 28, 756–767 Search PubMed.
- (a) R. Loganathan, S. Ramakrishnan, E. Suresh, M. Palaniandavar, A. Riyasdeend and M. A. Akbarsha, Dalton Trans., 2014, 43, 6177–6194 RSC; (b) R. Loganathan, S. Ramakrishnan, M. Ganeshpandian, N. S. P. Bhuvanesh, M. Palaniandavar, A. Riyasdeend and M. A. Akbarsha, Dalton Trans., 2015, 44, 10210–10227 RSC; (c) R. Loganathan, M. Ganeshpandian, N. S. P. Bhuvanesh, M. Palaniandavara, A. Muruganantham, S. K. Ghosh, A. Riyasdeen and M. A. Akbarsha, J. Inorg. Biochem., 2017, 174, 1–13 CrossRef CAS PubMed.
- M. Alagesan, P. Sathyadevi, P. Krishnamoorthy, N. S. P. Bhuvanesh and N. Dharmaraj, Dalton Trans., 2014, 43, 15829–15840 RSC.
- (a) U. M. Rafi, D. Mahendiran, A. K. Haleel, R. P. Nankar, M. Doble and A. K. Rahiman, New J. Chem., 2016, 40, 2451–2465 RSC; (b) N. Joksimović, D. Baskić, S. Popović, M. Zarić, M. Kosanić, B. Ranković, T. Stanojković, S. B. Novaković, G. Davidović, Z. Bugarčića and N. Janković, Dalton Trans., 2016, 45, 15067–15077 RSC.
- (a) G. Murphy, P. Nagle, B. Murphy and B. Hathway, Dalton Trans., 1997, 2645–2652 RSC; (b) P. T. Selvi, M. Murali, M. Palaniandavar, M. Kockerling and G. Henkel, Inorg. Chim. Acta, 2002, 340, 139–146 CrossRef CAS.
- M. Muralisankar, J. Haribabu, N. S. P. Bhuvanesh, R. Karvembu and A. Sreekanth, Inorg. Chim. Acta, 2016, 449, 82–95 CrossRef CAS.
- T. M. Kelly, A. B. Tossi, D. J. McConnell and T. C. Strekas, Nucleic Acids Res., 1985, 13, 6017–6034 CrossRef PubMed.
- (a) C. Tolia, A. N. Papadopoulos, C. P. Raptopoulou, V. Psycharis, C. Garino, L. Salassa and G. Psomas, Eur. J. Med. Chem., 2013, 123, 53–65 CAS; (b) N. Biswas, S. Khanra, A. Sarkar, S. Bhattacharjee, D. Prasad Mandal, A. Chaudhuri, S. Chakraborty and C. R. Choudhury, New J. Chem., 2017, 41, 12996–13011 RSC.
- K. W. Kohn, M. J. Waring, D. Glaubiger and C. A. Friedman, Cancer Res., 1975, 35, 71–76 CAS.
- M. Nath, M. Vats and P. Roy, Chem. Sustainable Dev., 2012, 301–315 Search PubMed.
- A. Wolfe, G. H. Shimer Jr and T. Meehan, Biochemistry, 1987, 26, 6392–6396 CrossRef CAS PubMed.
- S. S. Bhat, A. A. Kumbhar, H. Heptullah, A. A. Khan, V. V. Gobre, S. P. Gejji and V. G. Puranik, Inorg. Chem., 2011, 50, 545–558 CrossRef CAS PubMed.
- Z. Chen, M. Tan, L. Liu, Y. Liu, H. Wang, B. Yang, A. Peng, H. Liu, H. Liang and C. Orvig, Dalton Trans., 2009, 48, 10824–10833 RSC.
- X. Liang, X. Zou, L. Tan and W. Zhu, J. Inorg. Biochem., 2010, 104, 1259–1266 CrossRef CAS PubMed.
- (a) S. Kathiresan, S. Mugesh, M. Murugan, F. Ahamed and J. Annaraj, RSC Adv., 2016, 6, 1810–1825 RSC; (b) J. G. Liu, Q. L. Zhang and L. N. Ji, Transition Met. Chem., 2001, 26, 733–738 CrossRef CAS.
- (a) L. F. Tan, H. Chao, K. C. Zhen, J. J. Fei, F. Wang, Y. F. Zhou and L. N. Ji, Polyhedron, 2007, 26, 5458–5468 CrossRef CAS; (b) K. A. Meadows, F. Liu, J. Sou, B. P. Hudson and D. R. McMillin, Inorg. Chem., 1993, 32, 2919–2923 CrossRef CAS.
- E. F. Healy, J. Chem. Educ., 2007, 84, 1304–1307 CrossRef CAS.
- J. B. LePecq and C. Paoletti, J. Mol. Biol., 1967, 27, 87–106 CrossRef CAS PubMed.
- K. S. Ghosh, B. K. Sahoo, D. Jana and S. Dasgupta, J. Inorg. Biochem., 2008, 102, 1711–1718 CrossRef CAS PubMed.
- (a) P. U. Maheswari and M. Palaniandavar, J. Inorg. Biochem., 2004, 98, 219–230 CrossRef; (b) F. Bisceglie, S. Pinelli, R. Alinovi, M. Goldoni, A. Mutt, A. Camerini, L. Piola, P. Tarasconi and G. Pelosi, J. Inorg. Biochem., 2014, 140, 111–125 CrossRef CAS PubMed.
- (a) S. K. Seth, D. Sarkar, A. D. Jana and T. Kar, Cryst. Growth Des., 2011, 11, 4837–4849 CrossRef CAS; (b) M. Mitra, S. K. Seth, S. R. Choudhury, P. Manna, A. Das, M. Helliwell, A. Bauza, A. Frontera and S. Mukhopadhyay, Eur. J. Inorg. Chem., 2013, 4679–4685 CrossRef CAS; (c) S. K. Seth, Inorg. Chem. Commun., 2014, 43, 60–63 CrossRef CAS.
- (a) X. Qiao, Z. Y. Ma, J. Shao, W. G. Bao, J. Y. Xu, Z. Y. Qiang and J. S. Lou, BioMetals, 2014, 27, 155–172 CrossRef CAS PubMed; (b) G. Y. Li, K. J. Du, J. Q. Wang, J. W. Liang, J. F. Kou, X. J. Hou, L. N. Ji and H. Chao, J. Inorg. Biochem., 2013, 119, 43–53 CrossRef CAS PubMed.
- (a) A. Draksharapu, A. J. Boersma, M. Leising, A. Meetsma, W. R. Browne and G. Roelfes, Dalton Trans., 2015, 44, 3647–3655 RSC; (b) T. E. Edwards, T. M. Okonogi and S. T. Sigurdsson, Chem. Biol., 2002, 9, 699–706 CrossRef CAS PubMed; (c) A. Raja, V. Rajendiran, P. U. Maheswari, R. Balamurugan, C. A. Kilner, M. A. Halcrow and M. Palaniandavar, J. Inorg. Biochem., 2005, 99, 1717–1732 CrossRef CAS PubMed.
- A. Mazumder, C. L. Sutton and D. S. Sigman, Inorg. Chem., 1993, 32, 3516–3520 CrossRef CAS.
- V. A. Kawade, A. A. Kumbhar, A. S. Kumbhar, C. Nather, A. Erxleben, U. B. Sonawane and R. R. Joshi, Dalton Trans., 2011, 40, 639–650 RSC.
- W. J. Lian, X. T. Wang, C. Z. Xie, H. Tian, X. Q. Song, H. T. Pan, X. Qiao and J. Y. Xu, Dalton Trans., 2016, 45, 9073–9087 RSC.
- (a) G. Y. Li, K. J. Du, J. Q. Wang, J. W. Liang, J. F. Kou, X. J. Hou, L. N. Ji and H. Chao, J. Inorg. Biochem., 2013, 119, 43–53 CrossRef CAS PubMed; (b) D. D. Li, J. L. Tian, W. Gu, X. Liu, H. H. Zeng and S. P. Yan, J. Inorg. Biochem., 2011, 105, 894–901 CrossRef CAS PubMed; (c) M. Forconi and D. Herschlag, Methods Enzymol., 2009, 468, 91–106 CAS.
- F. Arjmand, I. Yousuf, T. B. Hadda and L. Toupet, Eur. J. Med. Chem., 2014, 81, 76–88 CrossRef CAS PubMed.
- (a) G. Y. Li, K. J. Du, J. Q. Wang, J. W. Liang, J. F. Kou, X. J. Hou, L. N. Ji and H. Chao, J. Inorg. Biochem., 2013, 119, 43–53 CrossRef CAS PubMed; (b) D. D. Li, J. L. Tian, W. Gu, X. Liu, H. H. Zeng and S. P. Yan, J. Inorg. Biochem., 2011, 105, 894–901 CrossRef CAS PubMed; (c) M. Forconi and D. Herschlag, Methods Enzymol., 2009, 468, 91–106 CAS.
- K. Zheng, F. Liu, X. M. Xu, Y. T. Li, Z. Y. Wu and C. W. Yan, New J. Chem., 2014, 38, 2964–2978 RSC.
- Y. Gilad and H. Senderowitz, J. Chem. Inf. Model., 2014, 54, 96–107 CrossRef CAS PubMed.
- D. Agudelo, P. Bourassa, M. Beauregard, G. Berube and H. A. T. Riahi, PLoS One, 2014, 8, e69248 CrossRef PubMed.
- (a) J. Marmur, J. Mol. Biol., 1961, 3, 208–218 CrossRef CAS; (b) K. A. Meadows, F. Liu, J. Sou, B. P. Hudson and D. R. McMillin, Inorg. Chem., 1993, 32, 2919–2923 CrossRef CAS.
- K. A. Meadows, F. Liu, J. Sou, B. P. Hudson and D. R. McMillin, Inorg. Chem., 1993, 32, 2919–2923 CrossRef CAS.
- G. M. Sheldrick, Acta Crystallogr., 2015, C71, 3–8 CrossRef PubMed.
- A. L. Spek, PLATON Procedure, A Multipurpose Crystallographic Tool, Utrecht University, Utrecht, The Netherlands, 1998 Search PubMed.
- (a) F. Arjmand, M. Muddassir, Y. Zaidi and D. Ray, MedChemComm, 2012, 4, 394–405 RSC; (b) J. R. Lakowicz and G. Webber, Biochemistry, 1973, 12, 4161–4170 CrossRef CAS PubMed.
- M. A. Spackman and D. Jayatilaka, CrystEngComm, 2009, 11, 19–32 RSC.
- (a) D. Mustard and D. W. Ritchie, Proteins, 2005, 60, 269–274 CrossRef CAS PubMed; (b) G. Macindoe, L. Mavridis, V. Venkatraman, M. D. Devignes and D. W. Ritchie, Nucleic Acids Res., 2010, 38, 445–449 CrossRef PubMed.
- T. Lammers, P. Peschke, V. Ehemann, J. Debus, B. Slobodin, S. Lavi and P. Huber, Mol. Cancer, 2007, 6, 65–78 CrossRef PubMed.
Footnote |
| † Electronic supplementary information (ESI) available. CCDC 1574863. For ESI and crystallographic data in CIF or other electronic format see DOI: 10.1039/c8ra06722h |
| This journal is © The Royal Society of Chemistry 2018 |

