 Open Access Article
Performance and fuel cell applications of reacted ball-milled MgH2/5.3 wt% TiH2 nanocomposite powders
Mohamed Sherif El-Eskandarany *,
Abdullah Alkandary,
Fahad Aldakheel,
Mariam Al-Saidi,
Fahad Al-Ajmi and
Mohammad Banyan
Nanotechnology and Advanced Materials Program, Energy and Building Research Center, Kuwait Institute for Scientific Research, Safat 13109. E-mail: Kuwaitmsherif@kisr.edu.kw
First published on 14th November 2018
Abstract
The present study aimed to enhance the kinetics behavior and destabilize the thermal stability of MgH2 powder by high-energy milling of Mg powder under 50 bar of H2 for several hours using Ti-balls as the milling media. The results showed a monotonical increase in Ti content worn off the milling media and introduced into the milled powders. This gradual doping led to homogeneous distribution of fine Ti particles into the Mg/MgH2 powder matrix without agglomeration or compositional fluctuations at the micro-level. During the activation stage of the powders, achieved at 350 °C/35 bar H2 prior to hydrogenation kinetics measurements, elemental Ti reacted with H2 to form fine TiH2 particles. Our proposed in situ mechanically induced catalyzation approach was found to be mutually beneficial for decreasing the apparent activation energy of decomposition. In addition, introducing 5.3 wt% of TiH2 to the MgH2 powder obtained after 50 h led to the achievement of superior enhancement of gas uptake/release kinetics at relatively low temperatures. The nanocomposite MgH2/5.3 TiH2 powder possessed fast hydrogenation/dehydrogenation kinetics behaviors and revealed long cycle lifetimes. This system was successfully employed as a solid-state hydrogen source to charge the battery of a cell-phone device using an integrated Ti-tank/commercial proton exchange membrane-fuel cell system.
1. Introduction
Due to the dramatic global environmental changes associated with man-made carbon dioxide emissions and the enormous consumption of the limited resources of fossil fuels, developing alternate energy sources is important for a sustainable future. Due to the increased threats from global warming due to the consumption of fossil fuels, our planet must adopt new strategies to harness inexhaustible sources of energy.1 Hydrogen is an energy carrier which holds tremendous promise as a new clean energy option.2 It is a convenient, safe, and versatile fuel source that can be readily converted to desired forms of energy without releasing harmful emissions.3Hydrogen storage, which is involved in both hydrogen production and hydrogen applications4 and thus assumes a critical role in initiating a hydrogen economy, has been the subject of intensive research for many years.5 In addition to the traditional methods of hydrogen storage via gas pressurizing and liquidification techniques, storing hydrogen gas in metal lattices in the form of metal hydrides is the most promising and safe practical technology for providing the clean energy required for different applications. Proton-exchange fuel cells membrane (PEMs) can be used successfully for utilizing hydrogen to power light duty vehicles as well as portable electronics and devices.6 Mg and Mg-based materials are considered to be the most promising candidate for hydrogen storage materials for real applications.7,8 The worldwide interest in Mg metal is attributed to its natural abundance, light weight, and its capability to store hydrogen up to 7.60 wt% (0.11 kg H2 l−1).9 Despite the attractive properties of MgH2 and its simple production method on an industrial scale via reactive ball milling (RBM) technique,10,11 MgH2 in its pure form has high stability and shows very slow kinetics of hydrogenation and dehydrogenation even at high temperatures (350 °C to 400 °C). These serious drawbacks are considered to be major barriers preventing the use of this attractive metal hydride material in fuel cell applications.
Over the last 25 years, innumerable efforts have been made to improve the kinetics behavior of MgH2 by catalyzing the metal hydride powder with a wide spectrum of mono, binary and multi-catalytic systems. One of the earliest studies to improve MgH2 powders was proposed by Prof. R. Schulz and his team in 1999.12 In their work, MgH2 powders were catalyzed by ball milling with 3-d transition metal powders of Ti, V, Mn, Fe or Ni. Based on their results, Ti and V showed better catalytic effects for hydrogen absorption and desorption compared with Ni. Furthermore, Hanada et al.13 reported very interesting results in catalyzing MgH2 powders with small amounts (1 mol%) of Fe, Co, Ni and Cu nanoparticles. Since then, different researchers have reported attractive results using pure elemental powders such as Al, Ti, Fe, Ni, Cu and Nb,14 intermetallic compounds,15,16 metastable phases17,18 and metal oxides5,19 to improve the kinetics of hydrogen absorption/desorption of MgH2.
In contrast to the usual approach of doping MgH2 powder with desired catalyst(s) powders and then high-energy ball milling the mixture for a certain time, here we show the possibility of in situ catalyzation of MgH2 by high-energy milling the starting Mg powder with Ti balls under hydrogen pressure. This method demonstrates an outstanding catalyzation process in which Ti particles worn from the milling media (Ti-balls) were gradually introduced to the MgH2 matrix by increasing the reactive ball milling (RBM) time to produce homogeneous nanocomposite powders. Moreover, this in situ catalyzation method was mutually beneficial for overcoming the agglomeration of Ti particles that usually leads to a heterogeneous catalytic distribution in the MgH2 matrix. Based on the interesting characterizations of the present prepared nanocomposite MgH2/5.3 wt% TiH2 system, we utilized the powder as a solid hydrogen source for feeding PEM-fuel cells using a self-manufactured hydrogen storage tank.
2. Experimental
2.1 Sample preparation
Elemental Mg metal powder (∼80 μm, 99.8%, provided by Alfa Aesar-USA), and hydrogen gas (99.999%) were used as starting materials. 5 g Mg was placed inside a He gas atmosphere (99.99%)-glove box (UNILAB Pro Glove Box Workstation, mBRAUN, Germany) and sealed together with fifty balls (11 mm in diameter) made of pure Ti metal (99.9 wt%) in a hardened steel vial (150 ml in volume) using a gas-temperature-monitoring system (GST, supplied by Evico Magnetic, Germany). The ball-to-powder weight ratio was maintained at 40![[thin space (1/6-em)]](https://www.rsc.org/images/entities/char_2009.gif) :
:![[thin space (1/6-em)]](https://www.rsc.org/images/entities/char_2009.gif) 1. The vial was then evacuated to the level of 10−3 bar before introducing H2 gas to fill the vial with a pressure of 50 bar. The RBM process was carried out at room temperature using a high-energy ball mill (Planetary Mono Mill PULVERISETTE 6, Fritsch, Germany). The RBM process was interrupted after the selected milling time and the vial was opened inside the glove box to remove a small amount (∼300 mg) of the milled powder for analysis. Then, the RBM process was resumed using the same operational conditions described above.
1. The vial was then evacuated to the level of 10−3 bar before introducing H2 gas to fill the vial with a pressure of 50 bar. The RBM process was carried out at room temperature using a high-energy ball mill (Planetary Mono Mill PULVERISETTE 6, Fritsch, Germany). The RBM process was interrupted after the selected milling time and the vial was opened inside the glove box to remove a small amount (∼300 mg) of the milled powder for analysis. Then, the RBM process was resumed using the same operational conditions described above.
2.2 Sample characterization
The crystal structures of all the samples were investigated by XRD with CuKα radiation using a 9 kW Intelligent X-ray diffraction system provided by SmartLab-Rigaku, Japan. The local structures of the synthesized material powders were studied by 200 kV-field emission high resolution transmission electron microscopy/scanning transmission electron microscopy (HRTEM/STEM, supplied by JEOL-2100F, Japan), equipped for Energy-Dispersive X-ray Spectroscopy (EDS, supplied by Oxford Instruments, UK). In addition to the elemental analysis achieved by EDS, ICP was used to perform elemental analysis by a chemical analytical approach.A Shimadzu Thermal Analysis System (TA-60WS, Japan) using a differential scanning calorimeter (DSC) was employed to investigate the decomposition temperatures of the MgH2 powders with a heating rate of 20 °C min−1. The apparent activation energies for the powders obtained after different RBM times were investigated using the Arrhenius approach with different heating rates (5 °C, 10 °C, 20 °C, 30 °C, and 40 °C min−1).
The hydrogen absorption/desorption kinetics were investigated via Sievert's method using a PCTPro-2000, provided by Setaram Instrumentation, France, under hydrogen gas pressure in the range from 200 mbar (for dehydrogenation) to 10 bar (for hydrogenation). The samples were examined at different temperatures in the range from 100 °C to 250 °C.
3. Results
3.1 Crystal structure
The structural changes taking place in the Mg powder upon RBMing under 50 bar of H2 for different milling times were monitored by means of X-ray diffraction (XRD) and field emission high-resolution transmission electron microscopy (FE-HRTEM). The starting Mg powder consisted of large polycrystalline grains characterized by sharp Bragg peaks related to hcp-Mg (PDF file # 00-004-0770), as displayed in Fig. 1a. After a very short RBM time (1 h), a considerable volume fraction of new phases corresponding to β-MgH2 (PDF file # 00-012-0697) and γ-MgH2 (PDF file # 00-035-1184) were detected (Fig. 1b). These phases were formed as a result of a gas–solid reaction that occurred during the RBM process.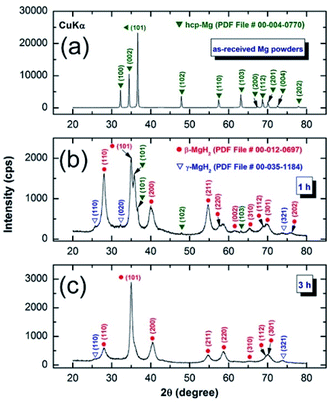 | ||
| Fig. 1 XRD patterns of hcp-Mg milled with Ti-balls obtained after (a) 0 h, (b) 1 h, and (c) 3 h of RBM time. | ||
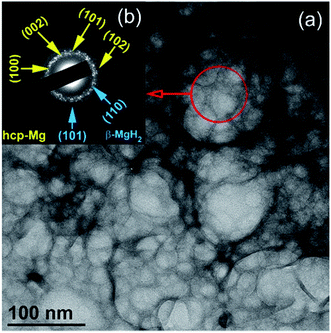
At this stage of milling (1 h), the Mg powders were agglomerated due to the cold-welding effect to form larger spherical particles (∼125 nm in diameter), as displayed in Fig. 2a. The fine particles (∼30 nm in size) presented in Fig. 2a were MgH2 particles embedded in the soft metallic Mg powder matrix. The selected area diffraction pattern (SADP) corresponding to the indexed red-circular zone shown in Fig. 2a revealed sharp spots related to the presence of large Mg and MgH2 grains with different orientations (Fig. 2b).
After 3 h of RBM time, the Bragg peaks related to unreacted hcp-Mg phase completely disappeared (Fig. 1c), suggesting completion of the gas–solid reaction. Further RBM time (6 h) led to significant broadening of the Bragg peaks related to MgH2, indicating the progress of the grain refinement process, as indicated in Fig. 3a. The MgH2 formed at this stage of milling did not undergo any phase transformations upon increasing the RBM time to 12.5 h, as displayed in Fig. 3b. After this milling stage, MgH2 grains composited of ultrafine grains with sizes ranging between 9 nm and 20 nm in diameter were observed, as presented in Fig. 3c. In contrast to the rings of discrete spots shown in Fig. 2b, the SADP corresponding to the indexed symbol presented in Fig. 3c revealed continuous Debye–Scherrer rings (Fig. 3d) corresponding to β- and γ-MgH2 phases. The absence of sharp spots implies the formation of nanocrystalline MgH2 powder. However, the spots indexed in Fig. 3d were related to hcp-Ti fine particles introduced to the MgH2 powders by using Ti balls as the milling media during the RBM process.
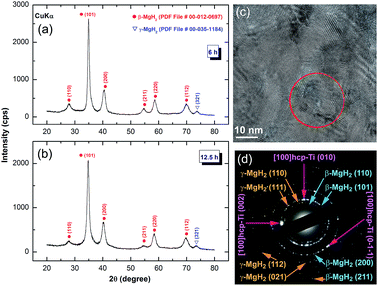 | ||
| Fig. 3 XRD patterns of nanocrystalline MgH2 powders obtained after RBMing of hcp-Mg powders for (a) 6 h and (d) 12.5 h with Ti-balls as the milling media. The FE-HRTEM image and related SADP of the powder milled for 12.5 h are presented in Fig. 3c and d, respectively. | ||
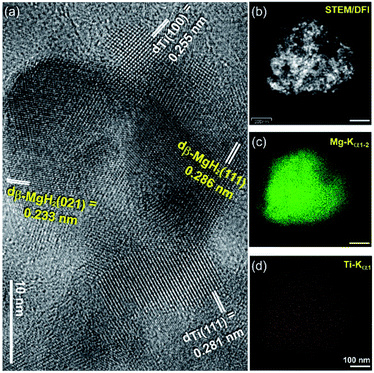
The HRTEM image of the powder obtained after 50 h of RBM time is shown in Fig. 4a. Obviously, the MgH2 powder consisted of fine grains with an average size of 8 nm in which Ti nanograins were adhered to the MgH2 particles, as shown in Fig. 4a.
A dark field image (DFI)/scanning transmission electron microscope (STEM) image of the selected nanocomposite MgH2/Ti aggregated particles is shown in Fig. 4b, together with the corresponding EDS elemental mappings of Mg (Fig. 4c) and Ti (Fig. 4d).
The MgH2 matrix had a spherical morphology with particle diameters of about 425 nm (Fig. 4b and c). The ultrafine cluster-like lenses (less than 5 nm in diameter) that were homogeneously distributed in the MgH2 aggregated matrix belonged to Ti phase, as shown in Fig. 4d.
3.2 Thermal stability
The effects of RBM time and Ti content on the thermal stabilities of the MgH2 powders, indexed by changing the temperature of the decomposition peak, were investigated by differential scanning calorimetry (DSC) at a heating rate of 20 °C min−1. All experiments were conducted under 1 atmosphere of pressure of He gas. The powder obtained after 3 h of RBM time revealed a single endothermic reaction corresponding to the decomposition of MgH2 phase, as displayed in Fig. 5a. The broadening seen in the decomposition peaks is related to the decomposition of γ-MgH2 phase overlapped with β-MgH2 phase. At this early stage of milling, the decomposition temperature was far below that (∼420 °C) of the commercial MgH2 powder. After 6 h of RBM time (Fig. 5b), the endothermic peak shifted to the low temperature side (340 °C) and continuously decreased after 12.5 h to 312 °C, as shown in Fig. 5c. As the RBM time increased (25 h), the Tdec decreased to 252 °C, as presented in Fig. 5d. Toward the end of the RBM processing time (50 h), the Tdec showed a significant decrease (230 °C), as presented in Fig. 5e.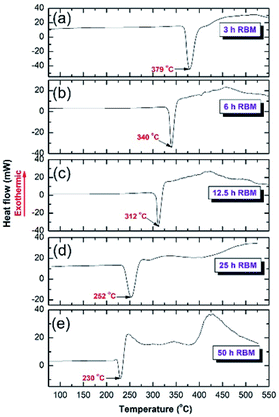 | ||
| Fig. 5 DSC curves of MgH2 powders obtained after RBMing of hcp-Mg powders for (a) 3 h, (b) 6 h, (c) 12.5 h, (d) 25 h, and (e) 50 h of RBM using Ti-balls as the milling media. | ||
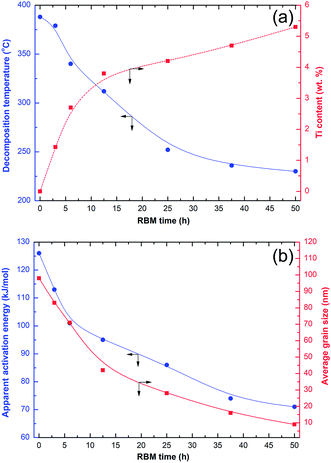
Fig. 6a shows the effects of RBM time on the decomposition temperature and concentration of Ti. The effects of RBM time on the activation energy and grain size of MgH2 are presented in Fig. 6b. The shear forces generated by the Ti-ball milling media led to the creation of severe lattice imperfections and crystal defects in the obtained MgH2 powders, resulting in destabilization of the formed hydride phase, as indicated by the drastic decrease of Tdec (Fig. 6a).
Continuous increasing of the RBM time led to a dramatic decrease of the MgH2 grain size from ∼84 nm (after 3 h of RBM) to less than 10 nm after 50 h of RBM (Fig. 6b). The formation of these ultrafine nanoscaled grains improved the apparent activation energy (Ea) of MgH2, which showed a monotonic decrease with decreasing grain size (Fig. 6b). The Ea of MgH2 decreased from about 127 kJ mol−1 (after 1 h of RBM) to 72 kJ mol−1 for the final product obtained after 50 h of RBM (Fig. 6b). In parallel to the continuous improvements achieved in both Tdec and Ea with increasing RBM time, the concentration of Ti worn from the milling media and embedded in the MgH2 powders monotonically increased to about 5.35 wt% after 50 h of RBM time (Fig. 6a).
3.3 Pressure–composition–temperature (PCT)
The PCT relationship measured at 175 °C for the MgH2/5.3 wt% TiH2 nanocomposite powder after 50 h of milling is presented in Fig. 7. At this low temperature, a single reversible hydrogenation/dehydrogenation cycle was developed. The presence of a nearly horizontal hydrogenation plateau can be seen in the range between 0.5 and 3 wt% H2 (Fig. 7a). The end-product obtained after this stage of RBM revealed good PCT properties, indicated by the similar values required to achieve successful hydrogenation (∼Puptake = 373 mbar) and dehydrogenation (∼Prelease = 312 mbar) processes to absorb/desorb 1.5 wt% H2, as displayed in Fig. 7b.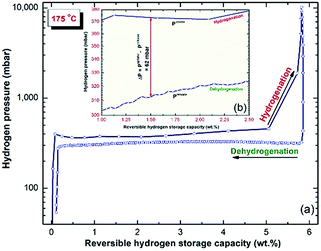 | ||
| Fig. 7 (a) PCT hydrogenation/dehydrogenation reversible cycles investigated at 175 °C for the final product of MgH2/5.3 wt% TiH2 nanocomposite powders obtained after 50 h of milling time. | ||
3.4 Kinetics of hydrogenation/dehydrogenation
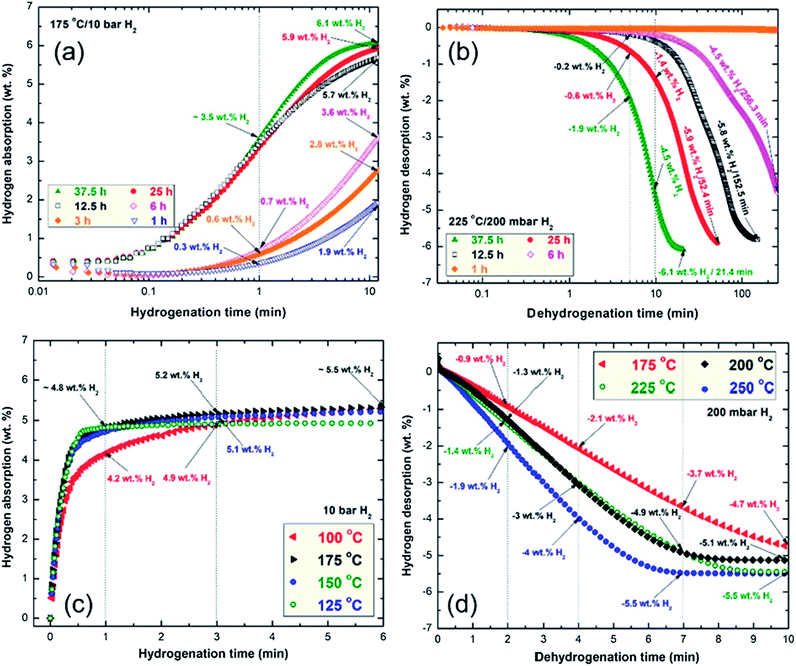
This is implied by the low hydrogen contents absorbed by the powder after 1 min (0.3 wt%) and 10 min (1.9 wt%), as shown in Fig. 8a. A marginal improvement in the hydrogenation kinetics was attained by increasing the RBM time to 3 h, indicated by the capability of the powder to absorb 0.6 and 2.8 wt% of H2 after 1 and 10 min, respectively (Fig. 8a). Further improvement of the hydrogenation kinetics was observed for the sample milled for 6 h, where the time required to take up 3.6 wt% H2 was 10 min, as shown in Fig. 8a. Increasing the RBM time (12.5 h to 37.5 h), which was accompanied by a significant decrease in the grain size (Fig. 6b) and an increase in the Ti content (Fig. 6a), led to improvement of the hydrogen uptake. This is implied by the short time (10 min) required to absorb 5.7, 5.9 and 6.1 wt% H2 for the sample powders milled for 25, 25 and 37.5 h, respectively, as presented in Fig. 8a.
The hydrogenation kinetics for the sample obtained after 50 h of RBM time (end product) was investigated under 10 bar of H2 at applied temperatures of 100 °C, 125 °C, 150 °C and 175 °C, as presented in Fig. 8b. The MgH2 powder obtained at this stage of milling revealed a nanocrystalline structure (Fig. 4a) and an average Ti content of 5.38 wt% (Fig. 6a); it showed outstanding hydrogenation behavior at a very low temperature (100 °C). This is indicated by the capability of the powder to absorb 4.2, 4.9 and 5.3 wt% H2 in very short times of 1, 3 and 6 min, respectively, as shown in Fig. 8b.
The hydrogenation kinetics was significantly enhanced by increasing the applied temperature to 125 °C, 150 °C and 175 °C, indicated by the short time (1 min) required to absorb about 4.8 wt% H2, as shown in Fig. 8b. The hydrogen uptake measured at 175 °C reached 5.5 wt% H2 in 6 min, as displayed in Fig. 8b.
The XRD pattern and an HRTEM image of the sample milled for 50 h and then hydrogenated at 175 °C under 10 bar of H2 are presented in Fig. 9a and b, respectively. The hydrogenated sample revealed that the tetragonal structure of β-MgH2 phase coexisted with fcc-TiH2 phase, as shown in Fig. 9a, with no evidence of the presence of unreacted hcp-Mg phase or any other reacted phase. This implies the capability of the powders to react successfully with hydrogen even at this low temperature (175 °C). It should be noted that the Ti particles that wore off the Ti-balls and adhered to the Mg powders during the RBM process tended to react with H2 during the hydrogenation kinetics measurements to form a reactive fcc-TiH2 phase, as indicated in Fig. 9a. The presence of low intensity Bragg peaks related to orthorhombic γ-MgH2 phase, which should not appear after an irreversible activation process, can be attributed to the existence of a very small volume fraction of as-milled powder in the reactor without heat treatment.
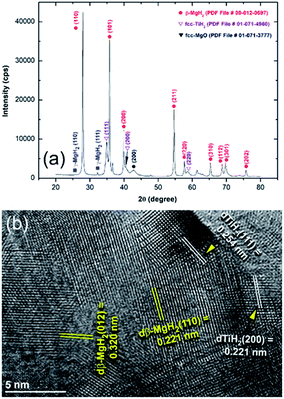 | ||
| Fig. 9 (a) XRD pattern and (b) FE-HRTEM image of MgH2 powder obtained after 50 h of RBM followed by hydrogenation at 175 °C under 10 bar of H2. | ||
Unfortunately, the obtained ultrafine powders were very sensitive to the surrounding atmosphere. The powder surfaces showed high affinity for oxidation during the preparation of the samples for XRD analysis. Although strict precautions were applied when preparing the samples for kinetics analysis, partial oxidation occurred, as indicated by the low intensity Bragg peak related to fcc-MgO (Fig. 9a). The underestimated hydrogen storage capacity of the as-prepared samples can be attributed to the presence of an undesired oxide layer on the powder surface.
The formation of fcc-TiH2 phase was confirmed by the HRTEM analysis, which showed precipitation of nano-structured TiH2 grains with clear Miller fringe images corresponding to the zone axes [111] and [200], as shown in Fig. 9b.
Significant improvements in dehydrogenation kinetics were attained for the samples milled for 25 h and 37.5 h. This was indicated by the very short time (5 min) required to release −0.6 and −1.9 wt%, respectively, as elucidated in Fig. 8c. The 25 h and 37.5 h samples successfully desorbed their hydrogen storage capacity of −5.9 and −6.1 wt% after 52.4 and 21.4 min, respectively, as presented in Fig. 8c. Superior dehydrogenation kinetics was achieved at 250 °C, indicated by the very short time (2 min) required to release −1.9 wt% H2, as presented in Fig. 8d. Further increasing the dehydrogenation time (4 min and 7 min) led to the release of −4 and −5.5 wt% H2, respectively, as shown in Fig. 8d. Increasing the desorption time to 10 min did not lead to further release of hydrogen, suggesting that complete desorption occurred within 7 min.
The superior dehydrogenation behavior of the MgH2 powder obtained after 50 h of RBM with Ti balls is attributed not only to grain size effects and the presence of catalytic TiH2 nanoparticles, but also to the excellent distribution of the TiH2 dispersoids adhered to the Mg metallic particles. This can be observed from the field emission-backscattering dark image (FE-BED) micrograph shown in Fig. 10a for the sample obtained after completion of the dehydrogenation process. The crystal structure of the sample obtained after the desorption kinetics measurement at 250 °C was investigated by XRD (Fig. 10b). Obviously, the domain structure of the sample consisted of hcp-Mg coexisting with very small volume fractions of un-decomposed β-MgH2 and reacted fcc-TiH2 phase (Fig. 10b). From the XRD analysis, it should be noted that the fcc-TiH2 reactive phase obtained during the hydrogenation process was maintained without decomposition, as indicated in Fig. 10b. In addition, the absence of intermediate product phase(s) combining Mg and Ti elements indicates that TiH2 played a heterogeneous catalytic role without undergoing reaction with MgH2.
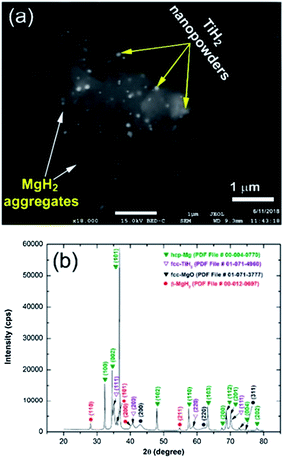 | ||
| Fig. 10 (a) FE-SEM/BED micrograph and (b) XRD pattern of the MgH2 powder obtained after 50 h of RBM and then subjected to a dehydrogenation experiment at 250 °C under 200 mbar of H2. | ||
The dehydrogenation kinetics behaviors for the sample obtained after 50 h of RBM time were investigated at different temperatures in the range between 175 °C and 250 °C (Fig. 8d).
This sample possessed moderate dehydrogenation kinetics in a low temperature range (175 °C to 225 °C), indicated by the short time (4 min) necessary to release −2.1 and −3 wt% hydrogen, respectively, as displayed in Fig. 8d. The kinetics of the sample was enhanced by increasing the dehydrogenation time to 7 min, where the hydrogen release increased with increasing applied temperature from 3.7 wt% (175 °C) to 4.9 wt% (200 °C and 225 °C, respectively, Fig. 8d). The 2 samples measured at 200 °C and 225 °C reached their saturation values of −5.1 and −5.5 wt% H2, respectively, after 10 min, as indicated in Fig. 8d.
3.5 Cycle lifetime
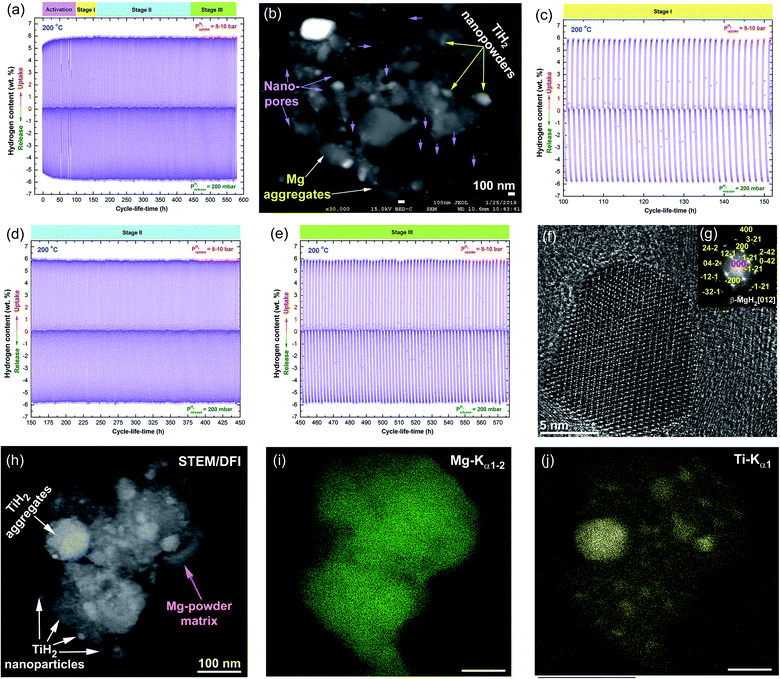
Measuring the cycle lifetime is one of the most important characterizations required to evaluate the capability and performance of any hydride material. The capability of hydrogen uptake and release for the as-synthesized nanocomposite MgH2/5.3 wt% TiH2 powder was examined at a relatively low temperature (200 °C) under hydrogenation and dehydrogenation hydrogen pressures of 10 bar and 200 mbar, respectively (Fig. 11a). To achieve successful cycle lifetime tests, the feedstock materials of the nanocomposite MgH2/5.3 TiH2 powder were severely activated first at high temperature (350 °C) and a hydrogen pressure of 35 bar for about 100 h, as denoted by the activation stage shown in Fig. 11a.In the activation stage, the ionic-bonded MgO layers coating the nanocomposite powder particles were broken down, and numerous cavities were created on the particles. This was indicated by the nano-pores shown in the FE-SEM/BED micrograph presented in Fig. 10b for the sample obtained after completion of the activation stage. The hydrogen storage capacity of the powder obtained after the activation step was significantly enhanced from 5.35 to about 6 wt%, as shown in Fig. 11c. Obviously, the hydrogenation/dehydrogenation kinetics of stage I started after activation for 100 h (Fig. 11c) and remained constant without obvious degradation, where the storage capacity remained at the level of 6 wt% as presented in Fig. 11c. This characteristic behavior of the cycled nanocomposite powder continued during the 2nd stage, which proceeded from 153 h to 450 h without remarkable changes, as shown in Fig. 11e. The constant values of hydrogen storage uptake/release capacity and kinetics indicate the absence of powder grain growth that usually restricts the cyclic-lifetime continuity and decreases both the hydrogen storage and the corresponding kinetics. Toward the completion of the cycle lifetime test (stage III) from 450 h to 580 h (Fig. 11a and e), neither decreased storage capacity nor degradation of the kinetic properties could be observed, indicated by their nearly constant values (Fig. 11e).
The HRTEM image of a single MgH2 nanoparticle obtained after 500 h of cyclic testing (Fig. 10f and g) confirmed the absence of severe grain growth during the long cycle life test, as indicated by the nanodimensional sizes of the particles (∼18 nm × 27 nm) shown in Fig. 10f. Comparing the particle size of this sample with that originally obtained after 50 h (∼9 nm) shown in Fig. 4a, it can be claimed that the cyclic lifetime test led to minor grain growth that did not affect the simultaneous hydrogenation/dehydrogenation process. Based on the kinetics measurements, it can be claimed that in addition to the catalytic role of TiH2 nanoparticles present in the MgH2 powder matrix, they play a vital role as grain-growth inhibitors, restricting the metal hydride powders from growing during the cyclic process. This is indicated by the excellent distribution of TiH2 (Fig. 10h and j) on the Mg powder surfaces (Fig. 10h and i) for the sample obtained after completion of 580 cycles. In addition, the hard TiH2 particles with their spherical morphologies tended to penetrate the surfaces of MgH2 powder upon applying hydrogen pressure (10 bar) at moderate temperature (200 °C) to create numerous “nano-hydrogen gates” that facilitated the simultaneous hydrogen charging/discharging processes (Fig. 11b).
3.6 An MgH2/5 wt% TiH2 solid-hydrogen storage system for PEM-fuel cell applications
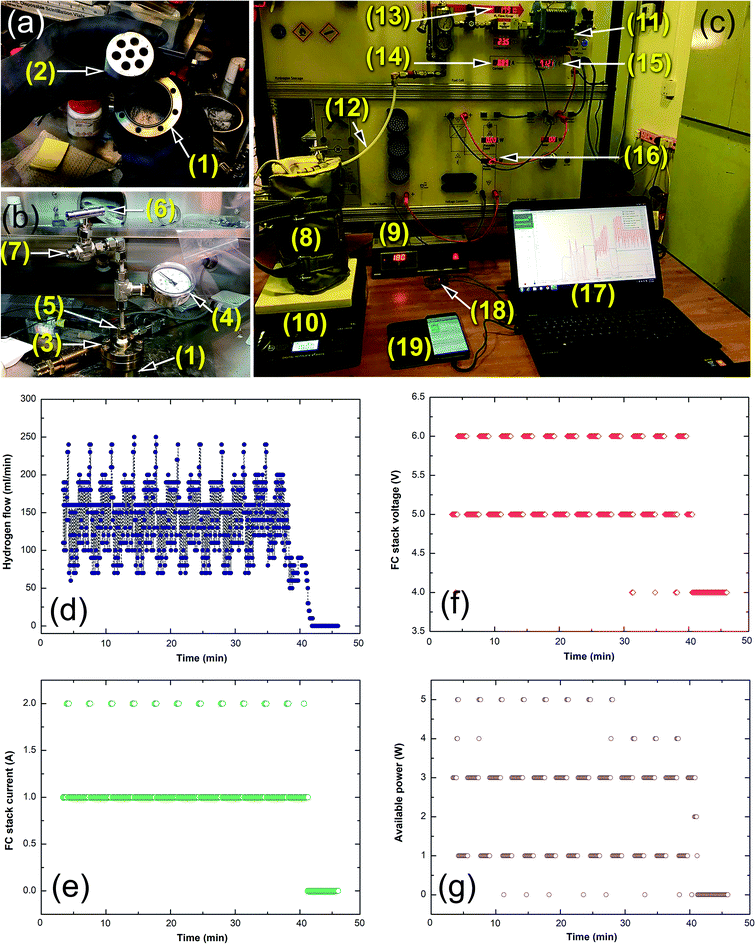
Based on the purpose of the present work, large amounts of MgH2/5.3 wt% TiH2 (∼35 g) nanocomposite powder were fabricated and utilized as a solid-hydrogen storage system to feed a proton exchange membrane (PEM) with hydrogen gas. For this purpose, a simple hydrogen storage tank was manufactured composed of a high-pressure hollow vessel made of pure titanium (Ti) metal with a magnesium mould containing 8 vertical holes with inner diameters of 10 mm inserted into the vial, as displayed in Fig. 12a. Equal amounts of powder were charged into the 8 holes of the magnesium mould; then, the system was sealed with a copper metal gasket inside a helium glove box (Fig. 12a). A high-pressure ball valve was installed into the tank cap to allow releasing and charging of hydrogen gas, as presented in Fig. 12b.Fig. 12c presents a photograph of the experimental setup for the integrated hydrogen storage system, where the titanium vial was covered by a jacket temperature insulator placed into a temperature control heater and mounted on a temperature-controlled hotplate. The hydrogen storage tank was connected to a 40 W/4.5 A proton exchange membrane (PEM) fuel cell (Fig. 12a) through a pipeline, allowing the released hydrogen gas from the tank to be passed to the PEM-fuel cell, as shown in Fig. 12c. The converted electrical energy was required to charge the battery of a cell phone device through a 5 V voltage regulator (Fig. 12c). The PEM-fuel cell system was controlled and operated with software, where the data outputs corresponding to the hydrogen flow rate, voltage, current and available power were obtained and stored (Fig. 12c). In the experiments, the titanium tank was firstly evacuated to the level of 200 mbar using a rotary pump interfaced with the pipeline shown in Fig. 12c(11). The tank was closed using a high pressure ball valve (Fig. 12b(5)) before heating the system to 180 °C (Fig. 12c(10)). During this stage, the hydrogen stored in the Mg lattice powder as MgH2 began to decompose, as indicated by the pressure changes monitored with the high pressure gauge (Fig. 12b(6)). As soon as the hydrogen gas was released into the titanium tank, the high pressure ball valve was opened to allow the hydrogen flow to pass to the PEM-cell system through the pipeline, as shown in Fig. 12c(11). Completion of the desorption process was realized when the hydrogen was completely released and the tank pressure decreased to the atmospheric level.
The time required for feeding the PEM-fuel cell with the hydrogen released from MgH2 powder at 180 °C at an average flow rate of 150 ml min−1 was about 43 min, as shown in Fig. 12d. This hydrogen flow offered an FC stack-current and voltage of about 1 A (Fig. 12e) and 5 to 6 V (Fig. 12f), respectively, with available power in the range between 1 and 3 W (Fig. 12g). Providing the fuel cell with a constant hydrogen gas flow rate led to the generation of constant values of current, voltage and powder (1 A), which were successfully employed to charge a cell phone battery through a micro regulator (Fig. 12c).
4. Discussion
Among the long list of catalysts or additives used to enhance the poor hydrogenation/dehydrogenation behaviors of MgH2 powders, Ti metal is one of the best catalytic agents used to enhance the absorption and desorption kinetics of MgH2.20,21 Like other MgH2-based systems, catalyzing of MgH2 powder by Ti is usually carried out by “manual” doping of the powder with the desired weight percentage of Ti particles/nanoparticles and then mechanically ball-milling them for a certain time, which can extend to several hours.21 A major drawback of this traditional approach is the long milling time required to ensure uniform dispersion of Ti into the MgH2 matrix.A more serious disadvantage of this common process is the tendency of the metallic catalysts to form aggregates during the first few hours of milling.18 In the present study, and in contrast with the common mechanically induced catalyzation technique, we have proposed a gradual “in situ catalyzation” of MgH2 powder during the ball milling process. Gradually introducing the Ti powder into the Mg/MgH2 powders was found to be a useful approach to overcome the formation of thick Ti layers and to ensure homogeneous distribution of the Ti particles in the powder matrix (Fig. 4). This alternative catalyzation method was carried out by high-energy ball milling of hcp-Mg powders under high pressure (50 bar) of hydrogen gas atmosphere using Ti-balls as the milling media.
After 1 h of ball milling, the Mg powder was agglomerated according to the cold welding effect during the milling process to form large aggregates (Fig. 2). Our results showed that at this early stage of RBM, the Mg powder was homogenously catalysed with Ti fine particles that were worn off the milling media (Ti-balls). Neither Ti-aggregates nor layers were formed at this stage of milling. During the next stages of the milling process, Ti particles gradually wore off the Ti balls and dispersed into the MgH2 matrix, as suggested by the gentle increase of Ti content with increasing milling time shown in Fig. 6a. This gradual fashion of introducing the Ti catalytic agent to the MgH2 powders led to the formation of homogeneous composite powders with outstanding Ti particle distributions, as displayed in Fig. 4c and d. The fine Ti particles adhered onto the surface of MgH2 and occupied numerous sites, facilitating fast hydrogenation kinetics even at relatively low temperatures. The hydrogenation/dehydrogenation kinetics were monotonically enhanced upon increasing the RBM time from 12.5 h to 50 h, which led to improved distribution of the Ti particles onto the surfaces of the MgH2 powder particles. The fine Ti particles played a vital role as grain growth inhibitors to maintain short diffusion distances of hydrogen atoms along the MgH2 nanograins. Accordingly, the decomposition of MgH2 led to release of hydrogen atoms, and the formation of hcp-Mg was greatly enhanced.
It has been pointed out by Isobe et al.22 that using Cr steel milling media for ball milling of graphite powders led to the introduction of large amounts of Fe contamination content (∼11 wt%) after milling for 80 h. The worn-off Fe particles reacted with the milled graphite samples to form Fe3C. The presence of this phase led to enhanced hydrogenation/dehydrogenation kinetics of the MgH2 powders.22
The activation energy of our system, Ea (72 kJ mol−1), is lower than those of MgH2/7 wt% Mn3.6Ti2.4 (87 kJ mol−1),16 5 wt% TiC (98 kJ mol−1),23 1.25 wt% Ni/3.75, wt% Nb2O5 (129 kJ mol−1)24 and MgH2/5.5 wt% Ni (75 kJ mol−1).18 However, it is slightly higher than that of 16.7 wt% FeS2 (∼69 kJ mol−1).25 It is worth mentioning that our system possessed very fast kinetics of hydrogenation/dehydrogenation for storage and release of about 6 wt% H2 compared with examples such as nanocrystalline MgH2 (33 min/116 min/275 °C),26 MgH2/7 wt% Mn3.6Ti2.4 (2 min/8 min/275 °C),16 a MgH2/5 wt% large-cube Zr2Ni system (1.5 min/11 min/275 °C),17 and MgH2/5 wt% TiC (6.6 min/8.8 min/275 °C).23
5. Conclusions
In summary, we have employed a reactive ball milling technique to prepare MgH2 powders using a high-energy ball mill operated under 50 bar of H2. In the present work, Ti-balls used as the milling media played a catalytic role in the gradual doping of Mg/MgH2 powders depending on the milling time. The results showed that using Ti-balls had great benefits for lowering the apparent activation energy of decomposition and improving the hydrogenation/dehydrogenation kinetics behavior of MgH2. The nanocomposite MgH2/5.3 TiH2 powder obtained after 50 h of milling possessed fast hydrogenation/dehydrogenation kinetics behavior, indicated by the short times necessary to take up and release 5.5 wt% H2 at 175 °C/250 °C within 6 and 7 min, respectively. In addition, the synthesized nanocomposite powders, which revealed a long cycle lifetime that extended to 580 h without degradation, were employed as a solid-state hydrogen source to charge the battery of a cell phone device using an integrated Ti-tank/commercial proton exchange membrane-fuel cell system.Conflicts of interest
There are no conflicts to declare.Acknowledgements
Appreciation is extended to the Kuwait Foundation for the Advancement of Sciences (KFAS) for partial financial support of this study related to Project EA061C under contract number P315-35EC-01. The financial support received by the Kuwait Government through the Kuwait Institute for Scientific Research for purchasing the equipment used in the present work, using the budget dedicated for the project (P-KISR-06-04), led by the first author of Establishing Nanotechnology Center in KISR is highly appreciated.Notes and references
- S. Satyapal, J. Petrovic and G. Thomas, Sci. Am., 2007, 296, 80–87 CrossRef CAS PubMed.
- I. P. Jain, Int. J. Hydrogen Energy, 2009, 34, 7368–7378 CrossRef CAS.
- M. S. El-Eskandarany, Mechanical Alloying: Nanotechnology, Materials Science and Powder Metallurgy, Elsevier Inc. Oxford, 2nd edn, 2015, ch. 9 Search PubMed.
- N. T. Stetson, S. McWhorter and C. C. Ahn, Compendium of Hydrogen Energy, ed. R. B. Gupta, A. Basile and T. N. Veziroğlu, Elsevier, Oxford, 2016, vol. 2, ch. 1 Search PubMed.
- S. Milošević, et al., J. Power Sources, 2016, 307, 481–488 CrossRef.
- T. Sinigaglia, F. Lewiski, M. E. S. Martins and J. C. M. Siluk, Int. J. Hydrogen Energy, 2017, 39, 24597–24611 CrossRef.
- L. Schlapbach and A. Züttel, Nature, 2001, 414, 353–358 CrossRef CAS PubMed.
- I. P. Jain, C. Lal and A. Jain, Int. J. Hydrogen Energy, 2010, 35, 5133–5144 CrossRef CAS.
- R. A. Varin, T. Czujko and Z. S. Wronski, Nanomaterials for Solid State Hydrogen Storage, Springer Science+Business Media, LLC, 1st edn, 2009, ch. 1 Search PubMed.
- A. Calka, Appl. Phys. Lett., 1991, 59, 1568–1570 CrossRef CAS.
- M. S. El-Eskandarany, K. Sumiyama, K. Aoki and K. Suzuki, Mater. Sci. Forum, 1992, 88, 801–808 Search PubMed.
- G. Liang, J. Huot, S. Boily, A. V. Neste and R. Schulz, J. Alloys Compd., 1999, 292, 247–252 CrossRef CAS.
- N. Hanada, T. Ichikawa and H. Fujii, J. Phys. Chem. B, 2005, 100, 7188–7194 CrossRef PubMed.
- C. X. Shang, M. Bououdina, Y. Song and Z. X. Guo, Int. J. Hydrogen Energy, 2004, 29, 73–80 CrossRef CAS.
- C. Zhou, Z. Fang, C. Ren, J. Li and J. Lu, J. Phys. Chem. C, 2014, 118, 11526–11535 CrossRef CAS.
- M. S. El-Eskandarany, H. Al-Matrouk, E. Shaban and A. Al-Duweesh, Int. J. Hydrogen Energy, 2015, 40, 10139–10149 CrossRef CAS.
- M. S. El-Eskandarany, H. Al-Matrouk, E. Shaban and A. Al-Duweesh, Energy, 2015, 91, 274–282 CrossRef CAS.
- M. S. El-Eskandarany, Sci. Rep., 2016, 6, 26936, DOI:10.1038/srep26936.
- H. Simchi, A. Kaflou and A. Simchi, Int. J. Hydrogen Energy, 2009, 34, 7724–7730 CrossRef CAS.
- V. Koteski, J. Belošević-Čavor, K. Batalović, J. Radaković and A. Umićević, RSC Adv., 2015, 5, 34894–34899 RSC.
- N. Mahmoudi, A. Kaflou and A. Simch, Mater. Lett., 2001, 15, 1120–1122 Search PubMed.
- S. Isobea, T. Ichikawab, J. I. Gottwaldc, E. Gomibuchia and H. Fujii, J. Phys. Chem. Solids, 2004, 65, 535–539 CrossRef.
- M. S. El-Eskandarany and E. Shaban, Materials, 2015, 8, 6880 CrossRef CAS PubMed.
- M. S. El-Eskandarany, H. Al-Matrouk, E. Shaban and N. Ali, Mater. Chem. Phys., 2016, 183, 476 CrossRef CAS.
- W. Zhang, G. Xu, Y. Cheng, L. Chen, Q. Huo and S. Liu, Dalton Trans., 2018, 47, 5217 RSC.
- M. S. El-Eskandarany, E. Shaban and B. Al-Halaili, Int. J. Hydrogen Energy, 2014, 39, 12727 CrossRef CAS.
| This journal is © The Royal Society of Chemistry 2018 |

