 Open Access Article
Rapid decoloration of azo dye Direct Blue 6 by AlCrFeMn high entropy alloy
Shikai Wu,
Ye Pan *,
Ning Wang,
Weiji Dai,
Jie Lu and
Tao Lu
School of Materials Science and Engineering, Southeast University, Jiangsu Key Laboratory for Advanced Metallic Materials, Nanjing 211189, PR China. E-mail: panye@seu.edu.cn; Fax: +86 25 52090681; Tel: +86 25 52090681
First published on 12th December 2018
Abstract
In recent years, high entropy alloys (HEAs) have attracted a lot of attention from researchers due to their outstanding mechanical properties, but there are few reports about their functional performance. The development of new functional applications of HEAs is a challenging, but very meaningful topic. The decoloration of azo dye Direct Blue 6 (DB6) using equiatomic AlCrFeMn HEA synthesized by ball-milling is reported in this study. Ball-milled (BM) AlCrFeMn HEA shows excellent performance in the decoloration of DB6, 3 times faster than BM MgZn-based glassy powders and AlCoCrTiZn HEA, which are reported as the best among the metallic glasses and HEAs so far, respectively. The effects of initial pH, initial temperature and dye concentrations on the decoloration efficiency during reaction are systematically studied. This work can greatly expand the applications of HEAs, especially the application of their functional properties.
1. Introduction
Azo dyes are the most dominant artificially synthesized dyes that are used in various types of industries such as ink, paper, leather, plastic, textiles, etc.1–3 However, the overuse of azo dyes has caused serious environmental and social issues.4,5 For instance, azo dyes are precursors to various carcinogens, which are a significant threat to people's health; besides, only a small amount of azo dye in the effluent stream is enough to cause a startling color change in a water body and seriously affect the photosynthesis of aquatic plants or the growth of fish in the water. Worst of all, azo dyes are very difficult to remove from aqueous solutions.6–10 Due to the potential harm to environment and people's health, pollution of the sewage by azo dyes is always a concern for academic researchers.11,12 Various kinds of physical, chemical and biological methods are applied for the treatment of wastewater polluted by azo dyes.13–18 Among these methodologies, zero-valent metals such as magnesium, iron, aluminum or zinc have shown great promise for the decoloration of azo dyes due to their environment friendliness, low cost, high-efficiency, simple operation and superior ability to cleave dye molecules into products that are more agreeable to mineralization in the biological treatment process.19–21 Zero-valent metals have many disadvantages, for example, zero-valent magnesium powders are overconsumed due to their poor corrosion resistance and zero-valent iron (ZVI) powders tend to agglomerate and lack stability.22,23 Therefore, it is urgent to develop environment friendly, easy to prepare, low cost, strong corrosion resistant alloy materials with a strong ability to decolorize azo dyes.As a new type of multi-principal-element alloy, HEAs are metastable materials lying far from the equilibrium state, which endows HEAs with many excellent properties that are unachievable in crystalline alloys.24–26 HEAs have received a lot of attention in the material science community in recent decades, but the study of HEAs has focused on the mechanical properties. Z. Y. Lv et al. report that AlCoCrTiZn HEA exhibits a prominent efficiency in degrading azo dye Direct Blue 6 (DB6).27 Inspired by this study, we decided to design and prepare new compositions of HEAs with good decoloration performance towards azo dyes. Ball milling is a well-known and simple method for the synthesis of HEAs, and BM HEA powders will have larger specific surface area and more active sites than block HEAs. The purpose of this study is to develop new HEAs with high-efficiency performance in decolorizing azo dyes. The decolorization of azo dye DB6 by the newly designed AlCrFeMn HEA is reported in this study. Our findings will certainly extend the applications of HEAs as functional materials.
2. Experimental
2.1. Materials and reagents
Elemental powders of Al, Cr, Fe, Mn with high purity (>99.9 wt%) and particle sizes between 1–10 μm were used as raw materials to synthesize equiatomic AlCrFeMn HEA. Direct Blue 6 (DB6, C32H20N6S4O14Na4) was purchased from Hailan Chemical Pigment Co. (Tianjin, China). The zero-valent Al, Cr, Fe, Mn powders (purity > 99.9 wt%) were provided by Sino New Material Co., LTD. (Beijing, China). The ball milling process was carried out in a high energy planetary ball miller at 400 rpm with a ball to powder ratio of 25![[thin space (1/6-em)]](https://www.rsc.org/images/entities/char_2009.gif) :
:![[thin space (1/6-em)]](https://www.rsc.org/images/entities/char_2009.gif) 1. Zirconia jars and balls were used as the milling media and stearic acid was utilized as the process controlling agent. The ball milling program was set for periods of 50 minutes of rotation followed by 10 minutes rest in order to prevent the powders from overheating, polymerizing or adhering to the milling balls and the inner wall of the container. High purity argon was charged into each ball jar before ball milling to prevent the raw powders from being oxidized. After 50 h of processing, the samples were all taken out from the zirconia jars for further characterization. For each trial, AlCrFeMn powders were added to a beaker containing 200 mL of azo dye DB6 solution for reaction. The beaker was placed in a water bath device with a constant temperature and the dye solution was stirred at a fixed speed during the reaction. For each time, about 2.5 mL solution was taken out for testing. The pH values of the azo dye solution was regulated by adding 0.1 M HCl solution or 0.1 M NaOH solution. Distilled water was used as the solvent in this study.
1. Zirconia jars and balls were used as the milling media and stearic acid was utilized as the process controlling agent. The ball milling program was set for periods of 50 minutes of rotation followed by 10 minutes rest in order to prevent the powders from overheating, polymerizing or adhering to the milling balls and the inner wall of the container. High purity argon was charged into each ball jar before ball milling to prevent the raw powders from being oxidized. After 50 h of processing, the samples were all taken out from the zirconia jars for further characterization. For each trial, AlCrFeMn powders were added to a beaker containing 200 mL of azo dye DB6 solution for reaction. The beaker was placed in a water bath device with a constant temperature and the dye solution was stirred at a fixed speed during the reaction. For each time, about 2.5 mL solution was taken out for testing. The pH values of the azo dye solution was regulated by adding 0.1 M HCl solution or 0.1 M NaOH solution. Distilled water was used as the solvent in this study.
2.2. Characterization methods
The morphology and size distribution of the powders were studied by scanning electron microscopy (SEM, JSM-7100F) and the compositions of the samples were examined by EDS equipped on the SEM. The crystal structure of the samples was studied by X-ray diffractometry (XRD, D8 Advance, CuKα) and FEI F20 transmission electron microscopy (TEM, Tecnai). The surface area analysis was tested by the Brunauer–Emmett–Teller (BET, 3H-2000BET-A) and the statistic distribution of the particle sizes was obtained by laser particle analyzer (FJUL1076). The UV-vis absorption spectra (TU-1810) were collected to evaluate the decoloration activity. The concentrations of the metal ions in the dye solution were detected by inductively coupled plasma atomic emission spectroscopy (ICP, PE ICP8000) and a digital pH meter (FE20, Mettler Toledo) was used to measure the pH values of the DB6 solution. An electric mechanical agitator (JB90-D) rotated at a certain speed to distribute the HEA powders uniformly in the dye solution.3. Results and discussion
3.1. Alloy composition design and preparation
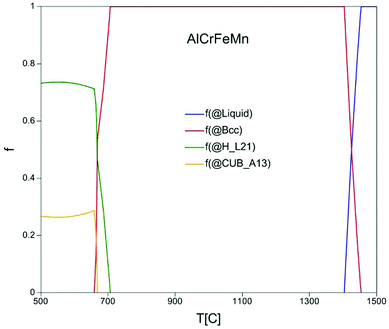
The compositions of alloys have a great influence on the decoloration performance and suitable elements must be selected to synthesize alloys. The alloy composition of AlCrFeMn in this study is motivated by the good performance of metals such as AlCoCrTiZn HEA, Al-based metallic glass alloy, Mn–Al binary alloy, ZVI, etc.27–31 As shown in Fig. 1, according to the calculation result by thermodynamic software “Pandat”, equiatomic AlCrFeMn only contains single body-centered cubic (BCC) solid solution structure phase between 650 °C and 1350 °C. This result indicated that equiatomic AlCrFeMn is favored and easily forms the single BCC solid solution structure. Equal proportions of raw metal powders of Al, Cr, Fe, Mn with a total of 10 grams are weighed, and then AlCrFeMn HEA was prepared by a planetary high energy ball mill.3.2. Characterization of samples before decoloration
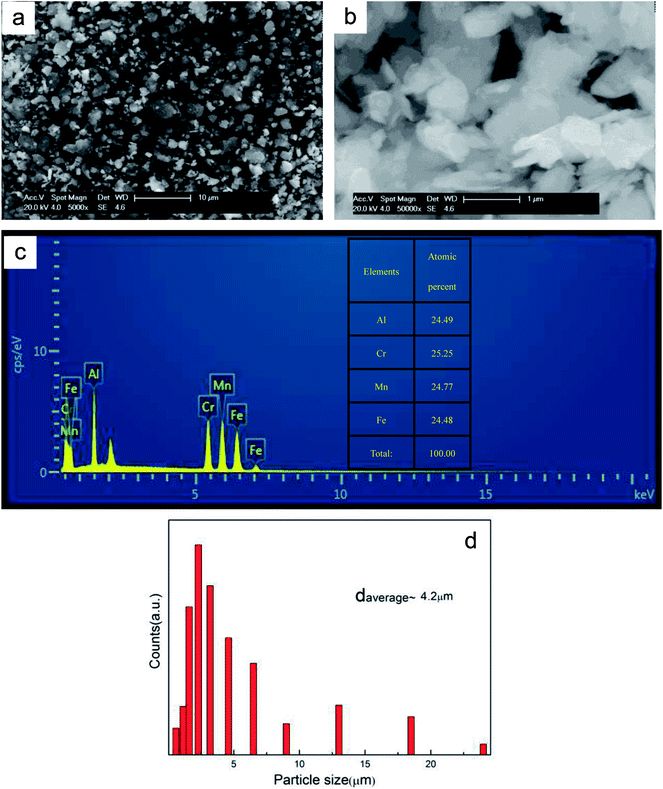
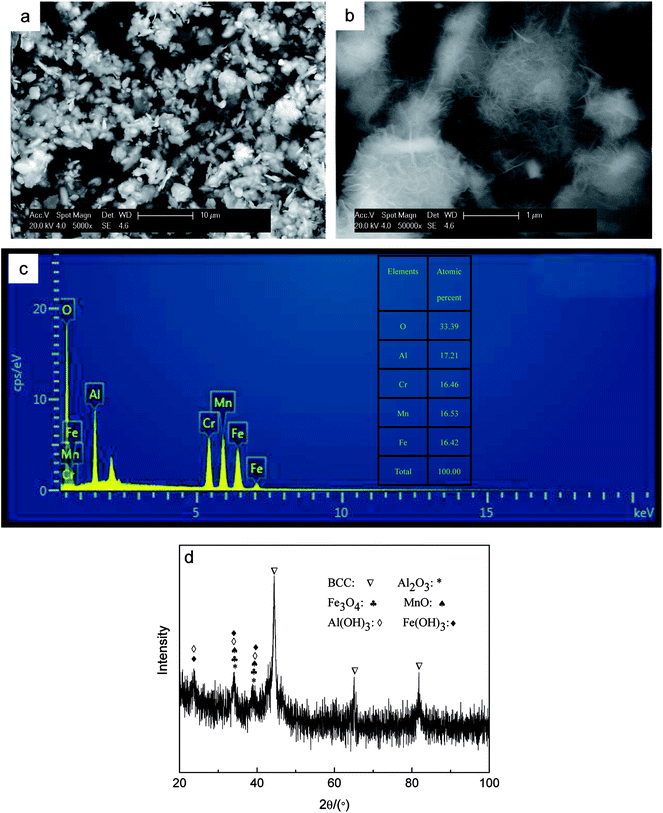
The XRD curve of AlCrFeMn is depicted in Fig. 2a, demonstrating the presence of a single BCC solid solution phase in AlCrFeMn and the corresponding crystal surfaces of the peaks are (110), (200) and (211), respectively. The structure of AlCrFeMn is further characterized by transmission electron microscopy (TEM) bright field images (Fig. 2b) and its corresponding selected area electron diffraction (SAED) pattern (inset of Fig. 2b). The good catalytic or degradation properties of many nanostructured materials are distinctly dependent on their crystallite size, morphology and distribution. As can be seen from Fig. 2b, the particles are only a few hundred nanometers in size and the corresponding crystal faces are shown in the inset of Fig. 2b. As depicted in Fig. 3a and b, the particle sizes show a relatively uniform distribution and the surface of the powders is rough and full of many corrugations, which is a typical morphology of powders obtained by ball milling. The surface morphology of AlCrFeMn powders indicate existence of abundant active sites, which favors the high-efficiency decolorization performance of AlCrFeMn discussed below. The EDS analysis result in Fig. 3c reveals that the as-produced BM particles are composed of all the elements and the ratio of the four elements of the sample is approximately equal to 1![[thin space (1/6-em)]](https://www.rsc.org/images/entities/char_2009.gif) :
:![[thin space (1/6-em)]](https://www.rsc.org/images/entities/char_2009.gif) 1
1![[thin space (1/6-em)]](https://www.rsc.org/images/entities/char_2009.gif) :
:![[thin space (1/6-em)]](https://www.rsc.org/images/entities/char_2009.gif) 1
1![[thin space (1/6-em)]](https://www.rsc.org/images/entities/char_2009.gif) :
:![[thin space (1/6-em)]](https://www.rsc.org/images/entities/char_2009.gif) 1, which is in good agreement with the nominal composition. Fig. 3d shows that the average size of the AlCrFeMn powders is about 4.2 μm and most particles are between 1–10 μm in size. To understand the high decoloration efficiency of AlCrFeMn, the specific surface area of the powders was measured and the average specific surface area of AlCrFeMn is 2.68 m2 g−1.
1, which is in good agreement with the nominal composition. Fig. 3d shows that the average size of the AlCrFeMn powders is about 4.2 μm and most particles are between 1–10 μm in size. To understand the high decoloration efficiency of AlCrFeMn, the specific surface area of the powders was measured and the average specific surface area of AlCrFeMn is 2.68 m2 g−1.
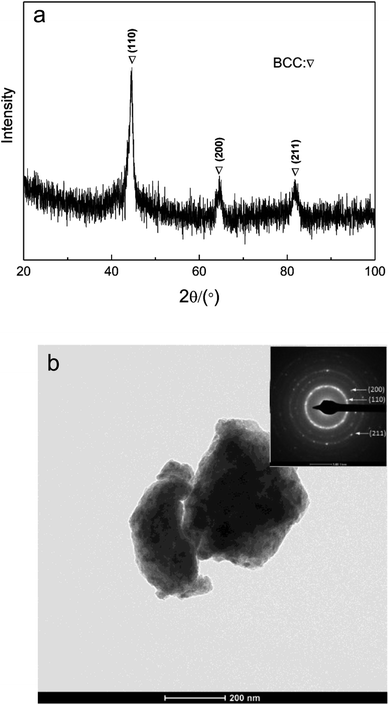 | ||
| Fig. 2 (a) X-ray diffraction curve of AlCrFeMn HEA before decoloration (b) TEM bright field image of AlCrFeMn HEA before decoloration and the corresponding selected area electron diffraction pattern. | ||
3.3. Comparison with other alloy materials
Herein, the concentration of the DB6 solutions is 200 mg L−1, while the alloy dosage is different for different agents, i.e., 6 g L−1 for AlCrFeMn HEA powders, 6 g L−1 for BM G-MgZn, and 13.3 g L−1 for AlCoCrTiZn, G-FeSiB and BM G-Fe. Except for the alloy dosage, other experimental conditions are the same. The total decoloration time of DB6 by AlCrFeMn is only 0.25 min as presented in Fig. 4. The BM MgZn-based glassy powder is the highest performing material reported in metallic glasses to date, which needs 0.78 min to degrade DB6.32 BM AlCoCrTiZn is the best material reported among HEAs so far, which requires 0.83 min and its dose is more than two times that of AlCrFeMn in this study.27 In particular, the BM G-MgZn is about 20 times faster than the BM Fe-based glassy powders.16 The degradation efficiency of the BM Fe-based glassy powders is about 200 times faster than that of the widely used commercial ZVI powders.16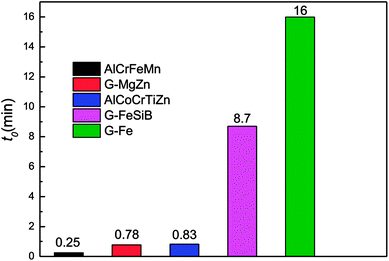 | ||
| Fig. 4 Comparison of the reaction efficiencies of different powders. Herein, the concentration of all the DB6 solutions is 200 mg L−1, while the dosage is different for different agents, i.e., 6 g L−1 for AlCrFeMn HEA powders, 6 g L−1 for BM G-MgZn, and 13.3 g L−1 for BM AlCoCrTiZn, G-FeSiB and BM G-Fe.16,27,33 | ||
3.4. Decoloration experiments under different reaction conditions
![[double bond, length as m-dash]](https://www.rsc.org/images/entities/char_e001.gif) N–” bonds are the most active bonds and chromophoric groups in azo dye molecules, and the cleavage of “–N
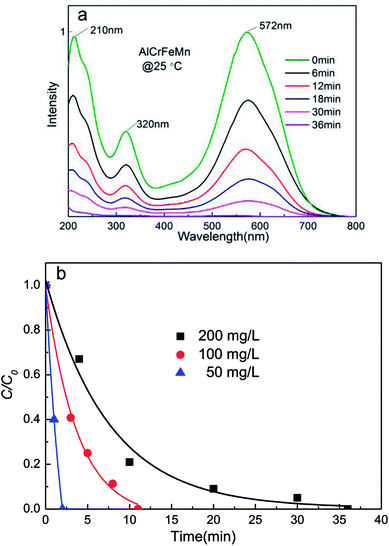
N–” bonds are the most active bonds and chromophoric groups in azo dye molecules, and the cleavage of “–N![[double bond, length as m-dash]](https://www.rsc.org/images/entities/char_e001.gif) N–” bonds leads to the decoloration of azo dyes. As illustrated in Fig. 5a, the absorption peak becomes weaker with the addition of AlCrFeMn powders. The intensity of this absorption peak decreases with an increase in reaction time. In the ultraviolet light region (200–380 nm), the characteristic peak at 230 nm and 320 nm correspond to the benzene ring and the naphthalene ring, respectively. The two peaks disappear in the decoloration process, and there is no new peak of the by-product during the reaction, which suggests successful decoloration of DB6 solution. By the UV-vis spectrum, we can deduce that the degradation products of DB6 are likely to be a small amount of anilines, benzenes and their homologues, as well as other small molecules. The treatment of DB6 by AlCrFeMn greatly reduces the toxicity of DB6 solution and improves its biodegradability.
N–” bonds leads to the decoloration of azo dyes. As illustrated in Fig. 5a, the absorption peak becomes weaker with the addition of AlCrFeMn powders. The intensity of this absorption peak decreases with an increase in reaction time. In the ultraviolet light region (200–380 nm), the characteristic peak at 230 nm and 320 nm correspond to the benzene ring and the naphthalene ring, respectively. The two peaks disappear in the decoloration process, and there is no new peak of the by-product during the reaction, which suggests successful decoloration of DB6 solution. By the UV-vis spectrum, we can deduce that the degradation products of DB6 are likely to be a small amount of anilines, benzenes and their homologues, as well as other small molecules. The treatment of DB6 by AlCrFeMn greatly reduces the toxicity of DB6 solution and improves its biodegradability.
Fig. 5b presents the decoloration efficiency of 50 mg L−1, 100 mg L−1, and 200 mg L−1 DB6 solutions decolored by 0.5 g L−1 AlCrFeMn during the decoloration process at 25 °C, initial pH = 7. The 200 mg L−1 DB6 solution is completely decolored by AlCrFeMn within 7.5 min. The 50 mg L−1 and 100 mg L−1 DB6 solution were completely decolored by AlCrFeMn in only 2.4 min and 3.7 min, respectively. Evidently, the higher the concentration of DB6, the longer it requires to be decolored.
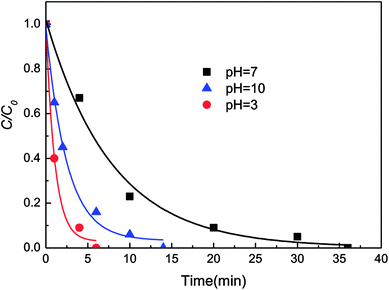
Nascent hydrogen ([H]) is a kind of rapid reduction agent, which has been found to reduce various organics faster than direct electron transfer.34 However, the production of [H] is suppressed during the reaction under neutral or alkaline conditions. Thus, the decolorization efficiency of DB6 by AlCrFeMn in acidic environments is higher than that of DB6 under neutral or alkaline conditions. Under alkaline conditions, hydroxides are likely to be produced in the solution, such as Fe(OH)3 or Al(OH)3. These hydroxides have a strong adsorption capacity, and can adsorb to a large number of dye molecules and precipitate. So, due to the adsorption of hydroxides, the decolorization efficiency under alkaline environments is higher than that under neutral conditions, but lower than that under acidic conditions due to the strong [H] effect.
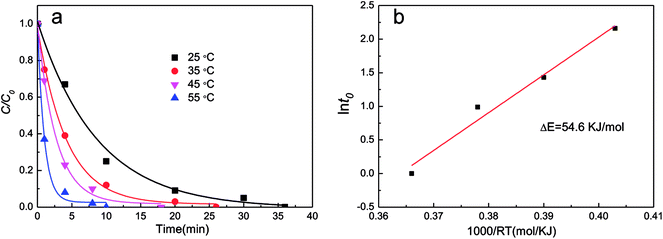
![[thin space (1/6-em)]](https://www.rsc.org/images/entities/char_2009.gif) t0) vs. (1000/RT) for estimation of activation energy of decoloration of DB6 by AlCrFeMn is shown in Fig. 7b (initial pH = 7, 0.5 g L−1 AlCrFeMn). For ordinary thermal reactions, the activation energy is usually between 60 and 250 kJ mol−1; for the reaction of AlCrFeMn decolorizing azo dye DB6, the activation energy is just 54.6 kJ mol−1. Our results imply that the decoloration of DB6 by AlCrFeMn requires a relatively low energy. Based on the obtained kinetic rate constants at different temperatures, the activation energy (ΔE, kJ mol−1) of the decoloration process of DB6 by AlCrFeMn can be obtained according to the equation:
t0) vs. (1000/RT) for estimation of activation energy of decoloration of DB6 by AlCrFeMn is shown in Fig. 7b (initial pH = 7, 0.5 g L−1 AlCrFeMn). For ordinary thermal reactions, the activation energy is usually between 60 and 250 kJ mol−1; for the reaction of AlCrFeMn decolorizing azo dye DB6, the activation energy is just 54.6 kJ mol−1. Our results imply that the decoloration of DB6 by AlCrFeMn requires a relatively low energy. Based on the obtained kinetic rate constants at different temperatures, the activation energy (ΔE, kJ mol−1) of the decoloration process of DB6 by AlCrFeMn can be obtained according to the equation:t0 = τ0![[thin space (1/6-em)]](https://www.rsc.org/images/entities/char_2009.gif) exp(ΔE/RT) exp(ΔE/RT) |
3.5. Characterization of samples after decoloration
3.6. Decoloration mechanism
The relationship between the dye concentrations and the decoloration times is not a positive proportion. Through the nonlinear curve fitting, it can be found that the decolorization process of DB6 by AlCFeMn is in good agreement with the pseudo-first-order exponential decay kinetics as follows:I = I0 + I1![[thin space (1/6-em)]](https://www.rsc.org/images/entities/char_2009.gif) exp(−t/t0) exp(−t/t0) |
AlCrFeMn HEA show excellent performance in the decoloration of DB6. There are several factors discussed as follows. (1) Firstly, all of the zero-valent metals, Al, Cr, Fe, and Mn, are easily reduced. (2) The second reason is the reduction of [H] produced by the reaction between acid and metals. The quick transfer of electrons between the metals could produce a large number of [H] around the active sites, i.e., the electrons derived from the metals are captured by protons to generate nascent hydrogen ([H]). (3) Compared with ZVI, due to the special alloy component, the surface of the BM AlCrFeMn powders appear electrochemically inhomogeneous and form a large number of tiny galvanic cells between the elements such as Al–Fe, Al–Cr, Mn–Fe, and Cr–Fe. These tiny galvanic cells in AlCrFeMn act as the electron donors during the decoloration process that lose e−, and H2O provides H+. One “–N![[double bond, length as m-dash]](https://www.rsc.org/images/entities/char_e001.gif) N–” bond of the azo dye receives four H+ and four e− and forms two “–NH2”. (4) The fourth reason is that the combination of the unique crystal structure with severe lattice distortion and residual stress stored plastic deformation energy is responsible for the excellent capacity of HEAs in degrading azo dyes. The unique solid solution structure of HEAs virtually is in a non-equilibrium state that leads to HEAs possessing higher potential energy and more active sites than those in conventional alloys.
N–” bond of the azo dye receives four H+ and four e− and forms two “–NH2”. (4) The fourth reason is that the combination of the unique crystal structure with severe lattice distortion and residual stress stored plastic deformation energy is responsible for the excellent capacity of HEAs in degrading azo dyes. The unique solid solution structure of HEAs virtually is in a non-equilibrium state that leads to HEAs possessing higher potential energy and more active sites than those in conventional alloys.
4. Conclusions
The efficiency and reaction kinetics of AlCrFeMn successfully fabricated by ball-milling for degrading organic chemicals were systematically investigated by evaluating its decolorization efficiency for azo dye DB6. The prominent decolorization performance of AlCrFeMn in the decoloration process of DB6 is attributed to redox reactions, special alloy composition, and unique crystal structure. The BM HEAs are promising and efficient materials for industrial wastewater treatment. BM AlCrFeMn HEA shows excellent performance in the decoloration of DB6, 3 times faster than BM MgZn-based glassy powders and BM AlCoCrTiZn. Dye concentrations, initial pH values and initial temperatures all have great influence on the decolorization efficiency of AlCrFeMn. As the dye concentrations and pH increase, the degradation rate of AlCrFeMn decreases, but as the temperatures increase, the degradation rate of AlCrFeMn increases. This study provides new insights for developing functional applications of HEAs.Conflicts of interest
There are no conflicts to declare.Acknowledgements
This study was supported by the National Natural Science Foundation of China (Grant No. 51671056), Jiangsu Key Laboratory for Advanced Metallic Materials (Grant No. BM2007204).Notes and references
- Y. Liu, H. Tian and A. Si, Plasma Chem. Plasma Process., 2012, 32, 597–607 CrossRef CAS.
- J. H. Ramirez, F. J. Maldonado-Hódar, A. F. Pérez-Cadenas, C. Moreno-Castilla, C. A. Costa and L. M. Madeira, Appl. Catal., B, 2007, 75, 312–347 CrossRef CAS.
- A. D. Bokare, R. C. Chikate, C. V. Rode and K. M. Paknikar, Environ. Sci. Technol., 2007, 41, 7437–7451 CrossRef CAS.
- S. D. Kalme, G. K. Parshetti, S. U. Jadhav and S. P. Govindwar, Bioresour. Technol., 2007, 98, 1405–1416 CrossRef CAS PubMed.
- R. V. Solomon, I. S. Lydia and J. P. Merlin, J. Iran. Chem. Soc., 2012, 9, 101–115 CrossRef CAS.
- J. Fan, Y. Guo, J. Wang and M. Fan, J. Hazard. Mater., 2009, 166, 904–917 CrossRef CAS PubMed.
- N. Ertugay and F. N. Acar, Arabian J. Chem., 2017, 10, S1158–S1169 CrossRef CAS.
- H. Lv, H. Zhao, T. Cao, L. Qian, Y. Wang and G. Zhao, J. Mol. Catal. A: Chem., 2015, 400, 81–90 CrossRef CAS.
- R. Patel and S. Suresh, J. Hazard. Mater., 2006, 137, 1729–1740 CrossRef CAS PubMed.
- Y. Su, Z. Wu and Y. Wu, J. Mater. Chem. A, 2015, 3, 8537–8549 RSC.
- E. S. Aazam and R. M. Mohamed, J. Alloys Compd., 2013, 577, 550–561 CrossRef CAS.
- S. Chen, G. Yang and S. Luo, J. Mater. Chem. A, 2017, 5, 27–39 Search PubMed.
- P. Singla, M. Sharma and O. P. Pandey, Appl. Phys. A: Mater. Sci. Process., 2014, 116, 371–380 CrossRef CAS.
- N. Divya, A. Bansal and A. K. Jana, Int. J. Environ. Sci. Technol., 2013, 10, 1265–1274 CrossRef CAS.
- A. Pandey, P. Singh and L. Iyengar, Int. Biodeterior. Biodegrad., 2007, 59, 73–82 CrossRef CAS.
- J. Wang, Y. Liu, M. Chen, G. Xie, D. V. Louzguine-Luzgin, A. Inoue and J. H. Perepezko, Adv. Funct. Mater., 2012, 22, 2567–2580 CrossRef CAS.
- H. Kusic, N. Koprivanac and L. Srsan, J. Photochem. Photobiol., A, 2006, 181, 195–208 CrossRef CAS.
- C. Zhang, Z. Zhu, H. Zhang and Z. Hu, Chin. Sci. Bull., 2011, 56, 3988–3996 CrossRef CAS.
- H. Liu, G. Li, J. Qu and H. Liu, J. Hazard. Mater., 2007, 144, 180–191 CrossRef CAS.
- S. Chang, K. Wang, S. Chao, T. Peng and L. Huang, J. Hazard. Mater., 2009, 166, 1127–1238 CrossRef CAS.
- H. Shu, M. Chang, C. Chen and P. Chen, J. Hazard. Mater., 2010, 184, 499–510 CrossRef CAS PubMed.
- Y. Keum and Q. X. Li, Chemosphere, 2004, 54, 255–267 CrossRef CAS PubMed.
- C. Lee and T. Shun, Mater. Charact., 2016, 114, 179–190 CrossRef CAS.
- R. R. Eleti, V. Raju, M. Veerasham, S. R. Reddy and P. P. Bhattacharjee, Mater. Charact., 2018, 136, 286–298 CrossRef CAS.
- H. Zhou, Y. Su, N. Liu, F. Kong, X. Wang, X. Zhang and Y. Chen, Mater. Charact., 2018, 138, 10–22 CrossRef.
- Z. Cai, G. Jin, X. Cui, Z. Liu, W. Zheng, Y. Li and L. Wang, Mater. Charact., 2016, 120, 229–239 CrossRef CAS.
- Z. Y. Lv, X. J. Liu, B. Jia, H. Wang, Y. Wu and Z. P. Lu, Sci. Rep., 2016, 6, 34213–34225 CrossRef CAS PubMed.
- Y. Tang, Y. Shao and N. Chen, RSC Adv., 2015, 5, 34032–34043 RSC.
- P. Wang, J. Q. Wang and H. Li, J. Alloys Compd., 2017, 701, 759–767 CrossRef CAS.
- W. B. Mbarek, M. Azabou and E. Pineda, RSC Adv., 2017, 7, 12620–12628 RSC.
- D. O'Carroll, B. Sleep and M. Krol, Adv. Water Resour., 2013, 51, 104–122 CrossRef.
- J. Wang, Y. Liu, M. Chen, D. V. Louzguine-Luzgin, A. Inoue and J. H. Perepezko, Sci. Rep., 2012, 2, 418–426 CrossRef PubMed.
- S. H. Chang, S. H. Chuang and H. C. Li, J. Hazard. Mater., 2009, 166, 1279–1288 CrossRef CAS PubMed.
- X. D. Qin, Z. W. Zhu, G. Liu, H. M. Fu, H. W. Zhang, A. M. Wang, H. Li and H. F. Zhang, Sci. Rep., 2016, 5, 18226–18237 CrossRef PubMed.
- C. Zhang, H. Zhang, M. Lv and Z. Hu, J. Non-Cryst. Solids, 2010, 356, 1703–1712 CrossRef CAS.
| This journal is © The Royal Society of Chemistry 2018 |

