DOI:
10.1039/C8RA06479B
(Paper)
RSC Adv., 2018,
8, 32823-32831
Synthesis, supramolecular organization and thermotropic phase behaviour of N-acyltris(hydroxymethyl)aminomethane†
Received
1st August 2018
, Accepted 18th September 2018
First published on 21st September 2018
Abstract
Herein, we reported the supramolecular organization of N-acyltris(hydroxymethyl)aminomethane (NATM) in the solid state as well as in aqueous solution. Single crystal X-ray diffraction revealed that NATM adopts a fully interdigitized structure. The thermodynamic parameters associated with thermotropic phase behaviour of NATM was determined by differential scanning calorimetry. The molecular packing and phase state of the NATM analyzed by laurdan and prodan fluorescence supports the formation of an interdigitized phase in aqueous solution. The potential application of the self-assembled NATM vesicles was demonstrated through entrapping model drug, Rhodamine B.
1. Introduction
Tris(hydroxymethyl)aminomethane or tromethamine (TM) was used in biological science for preparing buffers with a pH range of 7–9, which corresponds to the physiological pH of most living organisms.1 In intensive care units, TM was used as an alternative to sodium bicarbonate for the treatment of severe metabolic acidosis.2 Although it is useful in the treatment, the high alkalinity causes digestive troubles. However, the primary amine group of TM can be derivatized to develop tolerable treatment for acidosis.3 In this connection, derivatization of TM with fatty acids would be more advantageous because it will lead to products called N-acyl fatty acid amides (NAA). The compounds which fall under the category of NAA are largely investigated in the field of lipidomics as lipid signalling molecules. NAA plays an important role in endocannabinoid systems affecting a variety of physiological functions including memory, cardiovascular function, pain, cognition, motor control and others.4 NAA is also involved in cell migration, cell–cell communication, inflammation and certain pathological conditions such as obesity, diabetes, neurodegenerative disease, and cancer. An example for the function of NAA is that the N-arachidonoyl dopamine binds to transient receptor potential channels with the potency similar to capsaicin and produce thermal hyperalgesia.5 Recent research has shown that N-acyl taurine inhibit the proliferation of prostate cancer PC-3 cells. Smoum et al., showed the correlation between N-oleoyl serine and bone remodelling.6 In view of numerous physiological functions of NAA and in turn therapeutic capabilities drive us to synthesize homologous series of novel N-acyltris(hydroxymethyl)aminomethane or N-acyltromethamine (NATM).
In order to explore the biological applications of NATM, we need an adequate quantity of the lead molecules. To the best of our knowledge, there is no report on the synthesis and characterization of NATM. Thus, a facile method to synthesize NATM was developed by reacting tromethamine with long chain fatty acid chloride. The fatty acid acyl chain length varies from 10 to 18 and the products were obtained in good yield and characterized by FTIR, 1H-NMR, 13C-NMR and single crystal X-ray diffraction. NATM has amphiphatic nature because it contains a long hydrocarbon chain from fatty acid, which could act as a tail with a polar head group from tromethamine. Indeed, polymers with hydrophobic blocks such as poly (L-amino acids), poly(propylene glycol), stearyl methoxyPEGglycol succinate, methoxy-PEG (mPEG) monoacrylate etc.,7–10 have been shown to form self-assembled structure. By virtue of the hydrophilic–lipophilic balance, these kinds of self-assembled structures are useful in the development of detergents, drug delivery system, designer reaction medium, and so forth.11–13 Thus, the self-assembly of NATM was investigated by fluorescence spectroscopy, and found that the critical aggregation concentration (CAC) of NATM decreases with increasing the fatty acid acyl chain length from 10 to 18. The thermotropic phase behaviour of the self-assembled NATM was investigated by differential scanning calorimetry (DSC) and found that the transition enthalpies (ΔHt) and entropies (ΔSt) of hydrated NATM follow a linear relationship with the acyl chain length. Molecular modelling with the single crystal coordinates showed that NATM can self-assembled into vesicles, which is energetically stable. The formations of the vesicles were confirmed by optical microscopy and scanning electron microscopy. Being amphiphilic with an ability to form a stable interdigitized structure in aqueous phase may useful in preparing drug delivery vehicles.
2. Experimental
2.1. Materials
Decanoylchloride (N10), laurylchloride (N12), myristoyl-chloride (N14), palmitoylchloride (N16), stearoylchloride (N18), tromethamine hydrochloride (TM), 8-anilinonapthalene sulfonic acid (ANS), laurdan and prodan were purchased from Sigma, India. All other reagents were of reagent grade and were obtained from local suppliers. Solvents were distilled and dried prior to usage.
2.2. Synthesis of N-acyltromethamine
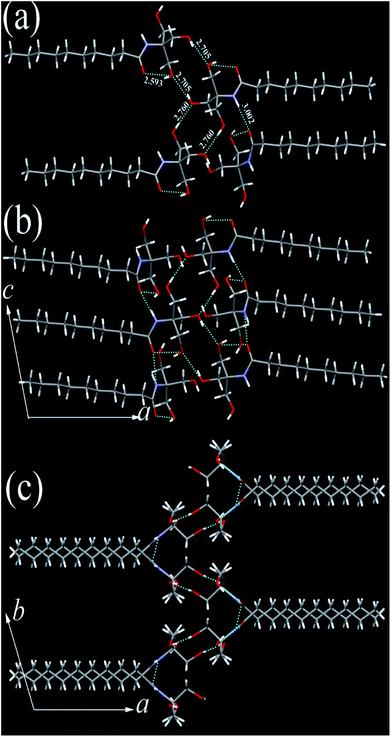
N-Acyltromethamine was prepared in fair yield by a condensation reaction between tromethamine hydrochloride and fatty acid chloride. Typically, TM (5 mmol) was dissolved in a mixture of 10 mL methanol and dichloromethane (1![[thin space (1/6-em)]](https://www.rsc.org/images/entities/char_2009.gif) :1 v/v) and kept in ice bath. To this solution 5 mmol of triethylamine was added and stirred for 15 min. To the resulting solution, acid chloride (5 mmol) was added under constant stirring and the reaction was allowed to proceed for 12 h at room temperature. The progress of the reaction was followed by thin-layer chromatography (TLC) on silica gel (solvent system: hexane:ethyl acetate, 1:1 v/v) and the TLC plates were followed in an iodine chamber. After the completion of reaction, the resultant crude NATM was subjected to column chromatography. Briefly, the crude NATM was loaded onto silica gel column and washed with 40% ethyl acetate in hexane to remove unreacted fatty acids. Further elution with the mixture of solvent containing hexane and ethyl acetate (50:50 v/v) yielded pure N-acyl tromethamine as judged by 1H-NMR and 13C-NMR. The isolated yields of different NATMs range from 67–71%. 1H NMR (300 MHz), 13C NMR (75 MHz) were recorded on Bruker Advance II 300 MHz NMR spectrometer, with CHCl3 or CD3OD as solvent and tetramethylsilane (TMS) as reference (δ = 0 ppm). The chemical shifts are expressed in δ downfield from the signal of internal TMS. FT-IR spectra were recorded using a PerkinElmer spectrum by adopting KBr pellet method.
:1 v/v) and kept in ice bath. To this solution 5 mmol of triethylamine was added and stirred for 15 min. To the resulting solution, acid chloride (5 mmol) was added under constant stirring and the reaction was allowed to proceed for 12 h at room temperature. The progress of the reaction was followed by thin-layer chromatography (TLC) on silica gel (solvent system: hexane:ethyl acetate, 1:1 v/v) and the TLC plates were followed in an iodine chamber. After the completion of reaction, the resultant crude NATM was subjected to column chromatography. Briefly, the crude NATM was loaded onto silica gel column and washed with 40% ethyl acetate in hexane to remove unreacted fatty acids. Further elution with the mixture of solvent containing hexane and ethyl acetate (50:50 v/v) yielded pure N-acyl tromethamine as judged by 1H-NMR and 13C-NMR. The isolated yields of different NATMs range from 67–71%. 1H NMR (300 MHz), 13C NMR (75 MHz) were recorded on Bruker Advance II 300 MHz NMR spectrometer, with CHCl3 or CD3OD as solvent and tetramethylsilane (TMS) as reference (δ = 0 ppm). The chemical shifts are expressed in δ downfield from the signal of internal TMS. FT-IR spectra were recorded using a PerkinElmer spectrum by adopting KBr pellet method.
2.3. Single crystal X-ray diffraction
Single crystals of N10TM, N12TM, and N14TM coated with paratone-N oil and diffraction data was measured with synchrotron radiation (λ = 0.62998 Å) on an ADSC Quantum-210 detector at 2D SMC with a silicon (111) double crystal monochromator (DCM) at the Pohang Accelerator Laboratory, Korea. CCDC No. – 1831968 (N10TM), 1831969 (N12TM) and 1831970 (N14TM) contain the supplementary crystallographic data for this paper.
2.4. Determination of critical aggregation concentration
The critical aggregation concentration (CAC) of NATMs was measured by fluorescence spectroscopy using the fluorescent probe, ANS.19 The fluorescence measurements were performed on a spectrofluorometer (JASCO spectrofluorometer FP8200) with a 1.0 cm quartz cell. The stock solution of 40 mM, 5 mM, 2 mM, 0.75 mM and 0.2 mM of N10TM, N12TM, N14TM, N16TM and N18TM, respectively was prepared by dissolving exactly weighed NATM in 10 mM sodium phosphate buffer, pH 7.4. The emission spectra of ANS (10 μM) was recorded between 400–650 nm, keeping the excitation wavelength at 370 nm and the slit widths of both excitation and emission set at 5 nm. Typically, small aliquots of NATMs from a concentrated stock solution was added into a cuvette containing 3 mL of ANS and the emission spectrum of ANS was measured after an equilibration period of 2 min. The fluorescence intensity at fixed wavelength was then plotted as a function of NATMs concentration and the CAC was determined as the concentration where distinct break in the slope was observed. Prior to analysis, fluorescence intensities were corrected for volume changes. 10 mM phosphate buffer, pH 7.4 was used throughout the study and experiments were performed at 25 °C. All experiments were repeated at least three times to arrive at the average values. The excitation wavelength for laurdan and prodan was 350 and 359 nm, respectively. The emission spectrum was measured from 375 to 600 nm, and was not corrected for instrument response.
2.5. Differential scanning calorimetry
DSC was performed in Nano DSC-TA instrument, India. Samples for DSC were prepared by suspending accurately weighed NATMs (2–4 mg) with 10 mM phosphate buffer, pH 7.4. NATMs were hydrated by heating the suspension to ∼50 °C. The hydrated samples and buffer were loaded into the sample and reference cell, respectively. The calorigrams were recorded at a scan rate of 1 °C min−1. The heating scans were normalized with respect to concentration of NATM, which yields the heat capacity (ΔCp) in kcal mol−1 K−1. Transition temperature (Tt), transition enthalpy (ΔHt) for each transition was estimated by integrating the area under the transition using the software provided with the instrument. In all cases, only the first heating scans were considered for further analysis. Transition entropies (ΔSt) were estimated from the ΔHt assuming a first order transition according to the expression:27
2.6. Molecular modeling
Molecular models of NATM were constructed using crystal structure 3D-coordinates by argus lab,30 and the geometry were optimized, followed by minimization. Packmol tool was used to model the vesicle system31 while building the vesicle system, constraint scripts were written in such a way that head and tail of NATM derivative are placed alternative to each other and that form a compact vesicles formation without any steric clashes. Finally, the modeled vesicle systems were subjected to energy minimization using the MacroModel module of Schrödinger suite.28 The OPLS_2005 molecular modeling force field was used for performing energy minimization. It effectively calculates the non-bonded terms by higher level of quantum theory calculation.32 All the vesicle system was solvated by adding water molecules appropriately.33 The Polak–Ribiere Conjugate Gradient (PRCG) method was used for minimization with maximum iterations of 2500 steps with the default convergence threshold value 0.05 kJ Å−1 mol−1. The energy minimized vesicles were analyzed by the molecular visualization tool PyMol,34 and corresponding 2D structure representations were sketched ChemAxon.
2.7. Microscopy studies
The vesicles formed by NATM were visualized by scanning electron microscopy (Tescan Vega 3). Typically, NATM (3 mM) was dissolved in ∼300 μL of chloroform:methanol mixture (3:1), and a thin film of the NATM was obtained by blowing a gentle stream of dry nitrogen gas over the solution. Final traces of the solvent were removed by vacuum desiccation for about 4–5 h. Then the thin film was then hydrated by vortexing with 1.0 mL of 10 mM phosphate buffer, pH 7.4. The vesicles were collected by centrifugation at 3000 rpm and subjected to two cycle of washing with phosphate buffer. The vesicles were made drop caste on a clean glass side and stained with gold sputtering for 35 s and imaged in SEM. For entrapping Rhodamine B, thin films of NATM were prepared with 1 mM of RhB and hydrated. The unbound RhB were washed with phosphate buffer. After that, 10 μL of the samples was placed on a glass slide with a coverslip and imaged under fluorescence microscope (Nikon Eclipse).
3. Results and discussion
3.1. Synthesis of N-acyltromethamine
Tromethamine fatty acid conjugate with even acyl chain lengths (n = 10–18) were synthesized in good yields by reacting tromethamine and fatty acid chloride in the presence of triethylamine base (Scheme 1). N-Acyltromethamine was purified by flash chromatography and the product was confirmed by FTIR, 1H-NMR and 13C-NMR. IR spectra of NATM showed absorption bands corresponding to the amide I at 1620–1622 cm−1 and amide II at 1534–1539 cm−1. The amide N–H stretching and O–H stretching vibrations were observed at 3276–3395 cm−1. The asymmetric and symmetric stretching, bending and rocking modes of the polymethylene group of the hydrophobic acyl chain was observed at 2845–2846 cm−1, 2912–2915 cm−1, 1465–1468 cm−1 and 716–720 cm−1, respectively (Fig. S1– S5†). The 1H NMR spectra of NATM showed resonances at 3.61 δ (6H, s) for the methylene groups at α position to the tertiary carbon moiety. The methylene groups at α and β positions of the amide carbonyl moiety showed resonance at 2.15 δ (2H, t) and 1.49 δ (2H, m), respectively. Resonance of the terminal methyl group was seen at 0.80 δ (3H, t), whereas the resonance of the polymethylene group were observed at 1.20 δ (12–28H, m). These spectral data are presented in the ESI.† The 13C NMR spectra of NATM showed resonances at 13.50 δ for a terminal methyl group of the acyl chain, 62.13 δ for the methylene moiety at α positions of the tertiary carbon moiety, 36.17 δ for the methylene moiety attached to NH and C![[double bond, length as m-dash]](https://www.rsc.org/images/entities/char_e001.gif) O group, other methylene carbons are seen at between 31.67–22.25 δ. The resonance corresponds to the amide carbonyl was observed at 176.06 δ. For all the synthesized compounds, the number and nature of 1H NMR and 13C NMR resonances are matching the structure of the corresponding compounds. The 13C NMR spectra of NATM were presented in the ESI (Fig. S6–S13†).
O group, other methylene carbons are seen at between 31.67–22.25 δ. The resonance corresponds to the amide carbonyl was observed at 176.06 δ. For all the synthesized compounds, the number and nature of 1H NMR and 13C NMR resonances are matching the structure of the corresponding compounds. The 13C NMR spectra of NATM were presented in the ESI (Fig. S6–S13†).
 |
| | Scheme 1 Synthesis of N-acyltromethamine. | |
3.2. Solid state structure and molecular packing of NATM
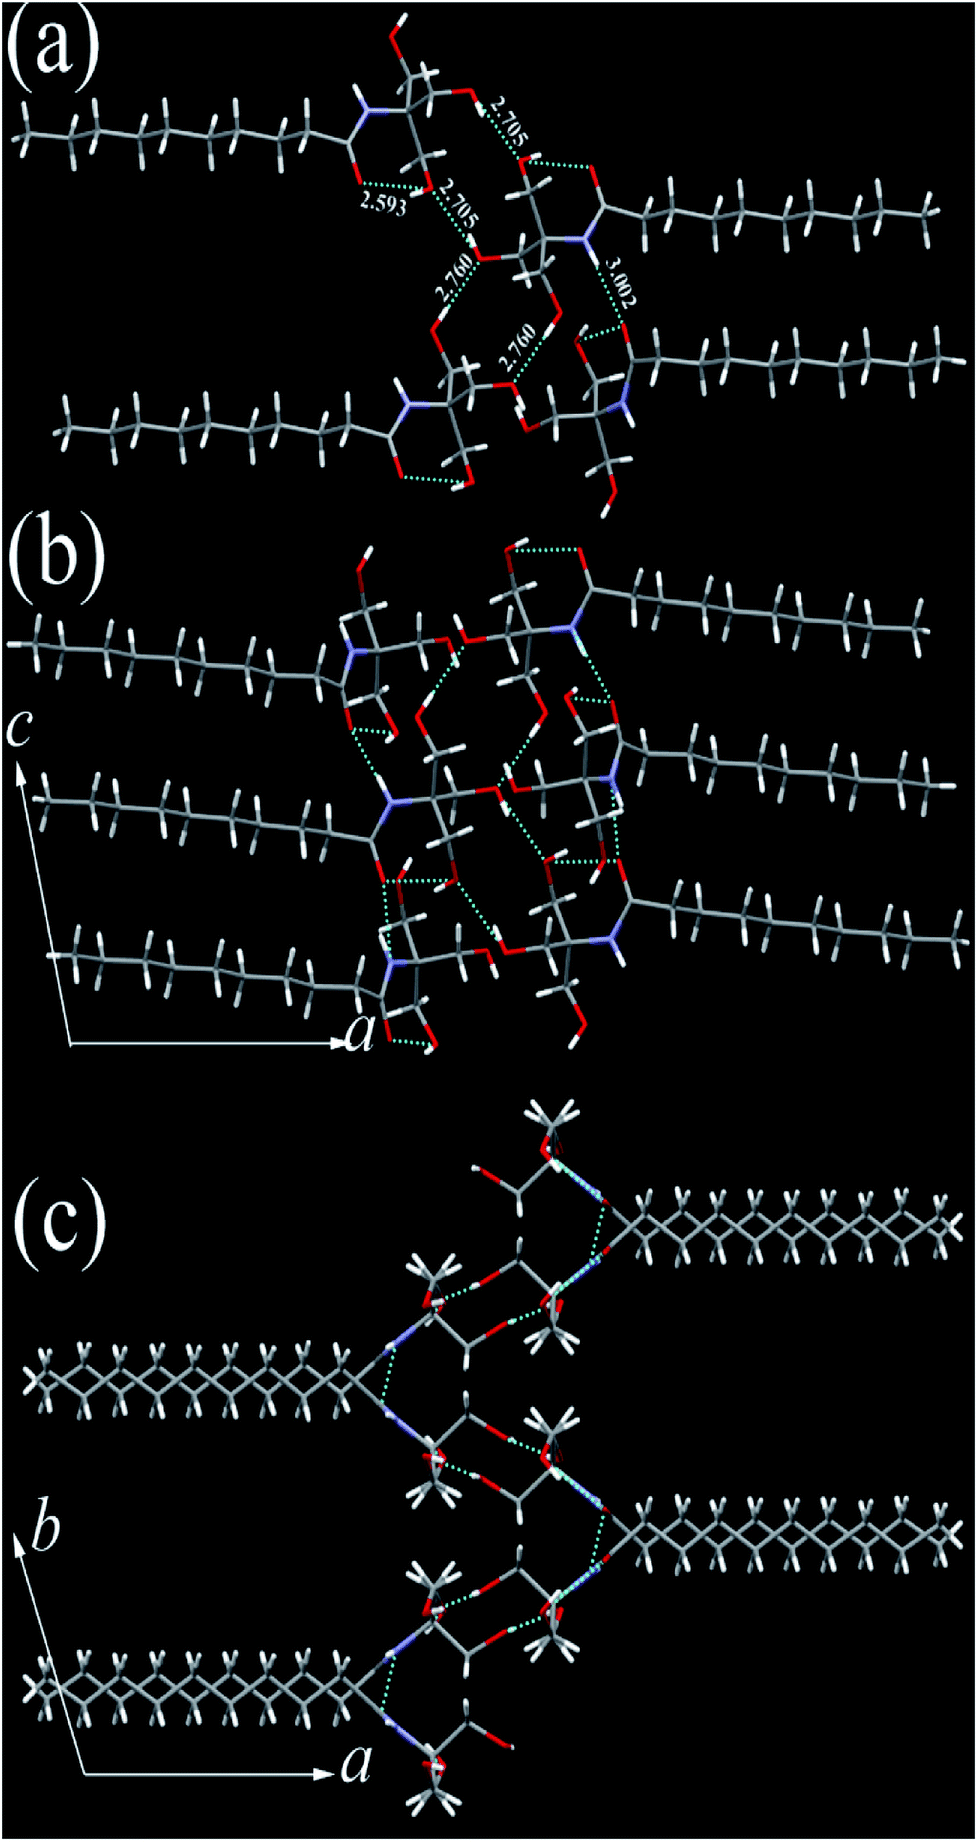
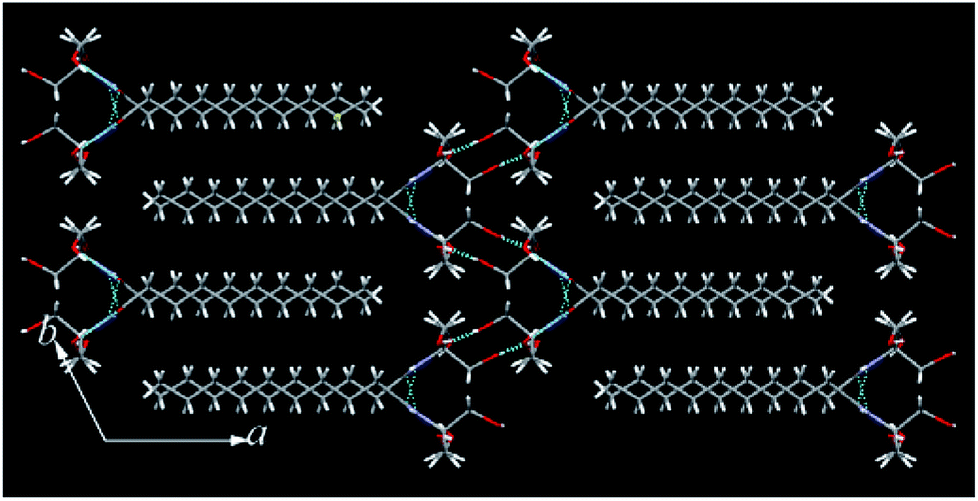
The single crystals of N10TM, N12TM, and N14TM were grown from methanol by slow evaporation (5 mg dissolved in 10 mL methanol), which produced flat needle morphology crystals. The efforts to obtain single crystals of N16TM and N18TM did not yield any success. The single crystals of all three compounds, N10TM, N12TM, and N14TM, showed the monoclinic space group, P21/c, with one molecule in the asymmetric unit. The crystal parameters for N10TM, N12TM, and N14TM are given in the Table S3 in the ESI.† Further, all three structures showed linear geometry in the crystal lattice. The space-filling model revealed considerably big head group with the diameter of around 4.871 Å (O1–O2). The hydrophobic part of the alkyl chain exhibited trans conformation with torsion angle close to 180°, which supports the linear geometry. The carbonyl oxygen and nitrogen, hydrogen adopted trans configuration in all three structure. The polar head group of tromethamine, showed strong N–H⋯O and O–H⋯O intermolecular H-bonding in the crystal lattice and one molecule interacts with four different molecules (Fig. 1). The amide carbonyl oxygen and amine hydrogen formed strong intermolecular H-bonding interaction linearly along c-axis and produced a layer structure in the crystal lattice. The linear alkyl chains in the layer along c-axis are separated by 4.384 Å which clearly suggests the van der Waals' contact between the alkyl chains. Tromethamine hydroxyl group exhibits strong O–H⋯O intermolecular H-bonding with the opposite layer head group. Further, amide along with O–H⋯O hydrogen bonding produced another layer structure in the ab-plane (Fig. 1). Nevertheless, the alkyl chains are well separated in the network along b-axis. The distance between the two adjacent alkyl chains is 9.062 Å. Such large separations of alkyl chain along the b-axis generate large vacant space between the chains. This vacant space between the alkyl chains is filled by the insertion of alkyl chain from adjacent layer and produced a fully interdigitized bilayer structure in the crystal lattice (Fig. 2). The van der Waals' contact of 4.274 Å between interdigitized alkyl chains indicates that the hydrophobic interaction between alkyl chains stabilize the self-assembled interdigitized bilayer structure.
 |
| | Fig. 1 N10TM head group (a) H-bonding interaction with three different molecules, (b) H-bonding network along c-axis (c) along b-axis in the crystal lattice. C (grey), N (blue), O (red), H (white). H-bonding interactions (broken line) distances are marked in Å. | |
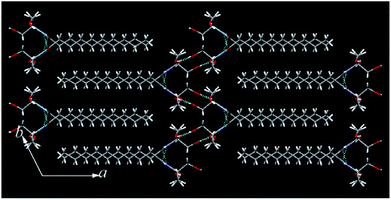 |
| | Fig. 2 Fully interdigitized structural self-assembly in the crystal lattice of N10TM. C (grey), N (blue), O (red), H (white). H-bonding interactions (broken line). | |
Further, in the solid state, NATM is self-assembled in head-to-tail arrangement in the crystal lattice. The bilayer thickness of N10TM (O2–O2) is 21.90 Å, whereas the monolayer thickness (O2–C14) is 15.632 Å. The compound N12TM and N14TM also displayed very similar supramolecular interactions and molecular conformation and packing in the crystal lattice except the increase of bilayer thickness (24.260 Å (N12TM) and 26.666 Å (N14TM)) and monolayer thickness (18.974 Å (N12TM) and 20.625 Å (N14TM)) due to the increase of alkyl chain length (Fig. S16†). Thus, the supramolecular H-bonding of a polar head group and hydrophobic interactions between the alkyl chains lead to fully interdigitized self-assembled bilayer structure in the crystal lattice. The interdigitized structure of NATM completely differed from other N-acyl fatty acid structures, including N-acyl ethanolamines,14 N-acyl dopamines,15 and N-acyl glycines,16 all of which exhibited head-to-head and tail to tail packing resembling stacked bilayer structure. Such difference in the self-assembly can be explained by considering a bigger head group of N10TM with an area of 30.59 Å2 and tilt angle (15° (N10TM), 16° (N12TM) and 16° (N14TM)) in the N-acyl chains with respect to the bilayer normal. The larger head group produced more space in the alkyl chain area that resulted in the accommodation of two alkyl chain. Similar interdigitzed bilayer arrangements are reported for lysophosphatidylcholine where the acyl chains are tilted to accommodate head to tail packing.17 In contrast, small head group area and tilt angle in N-acyl glycines lead to stacked bilayer structure.16 The stacked bilayer structure in fatty acids resulted in double the thickness of the hydrophobic region (sum of the length of two acyl chain) whereas hydrophobic portion of the fully interdigitized structure is equivalent to one acyl chain length.
3.3. Self-assembly of N-acyltromethamine in aqueous solution
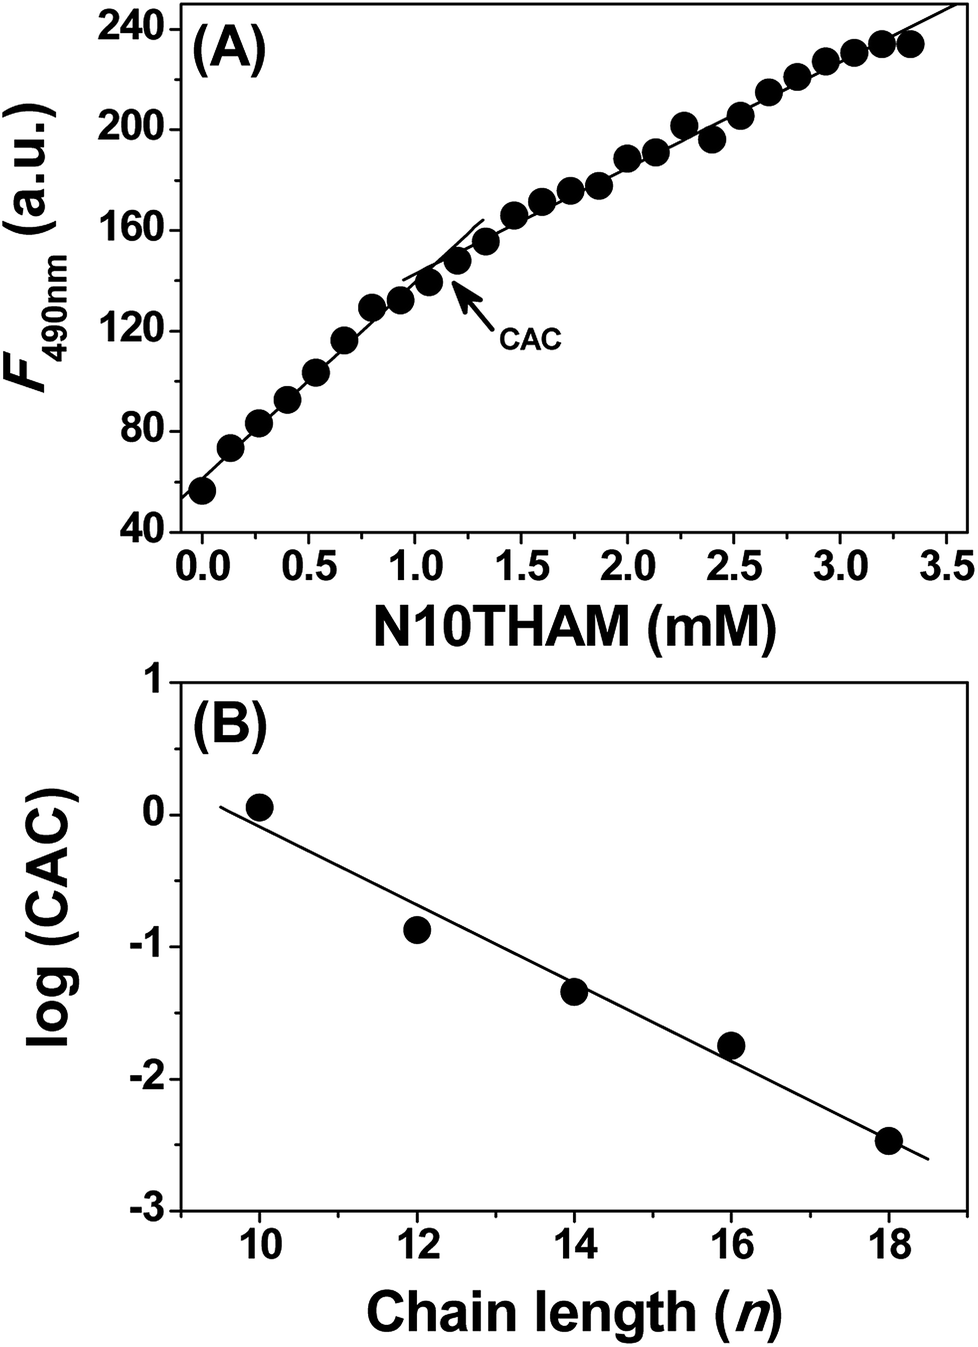
The lipophilicity of the fatty acid acyl chain and the hydrophilicity of tromethamine may drive N-acyltromethamine to self-assemble in aqueous solution. In order to determine the self-assembly concentration of NATM, we measured critical aggregation concentration (CAC) for these NATM by monitoring the incorporation of the fluorescent probe 1-anilino-8-naphthalene sulfonate (ANS) into the self-assembled structures.18 The addition of N10TM to ANS blue shifts the emission wavelength from 518 to 485 nm with concomitant increase in the fluorescence intensity (Fig. S17†). This suggests that the fluorescence probe moves into the non-polar environment where the emission quantum yield of ANS is high.19 Analyzing the data by plotting the fluorescence intensity versus concentration of N10TM showed a distinct break, suggests a change in the aggregation state of N10TM (Fig. 3A). This break is attributed to the self-assembly of N10TM molecules that solubilised in the buffer and thus yield information on the CAC of N10TM. The length of the fatty acid acyl chain has an important influence on the CAC. A series of acyl tromethamine, from 12 to 18 have been studied in the same way and noted that their CAC decreases with increasing fatty acid acyl chain, from 1132.5 ± 52 μM (N10TM), 134.5 ± 10 μM (N12TM), 45.5 ± 2.3 μM (N14TM), 17.8 ± 1.3 μM (N16TM) and 3.4 ± 0.2 μM (N18TM). When log(CAC) values were plotted versus the acyl chain length, a linear dependence was observed (Fig. 3B), which is in agreement with previous observations on the chain length dependence of CACs of N-acyl alanine,19 N-acyl taurine,20 and other single chain surfactants.21
 |
| | Fig. 3 (A) Determination of the CAC of N10TM in 20 mM phosphate buffer, pH 7.4. (B) Plots of log(CAC) versus n for samples hydrated with phosphate buffer. | |
Sodium chloride is useful for screening the involvement of electrostatic interaction in the self-assembly process of NATM,22 thus, CAC of N10TM was determined in the presence of 1 M NaCl. The CAC of N10TM (1193 ± 34 μM) obtained with 1 M NaCl was found to be comparable to those obtained without NaCl (1132.5 ± 52 μM), suggesting less or no contribution from the electrostatic interaction. Next, we tested the influence of alcohol on the CAC because organic solvents can disturb the hydrophobic interactions.23 Interestingly, the CAC determination carried out with 25% aqueous isopropanol showed weak change in the ANS fluorescence intensity with small blue shift, which can be attributed to the change in solvent polarity (Fig. S18†). These results suggest that the isopropanol precludes the self-assembly and supports that the self-assembly was majorly driven by hydrophobic interactions.
3.4. Phase behaviour of NATM
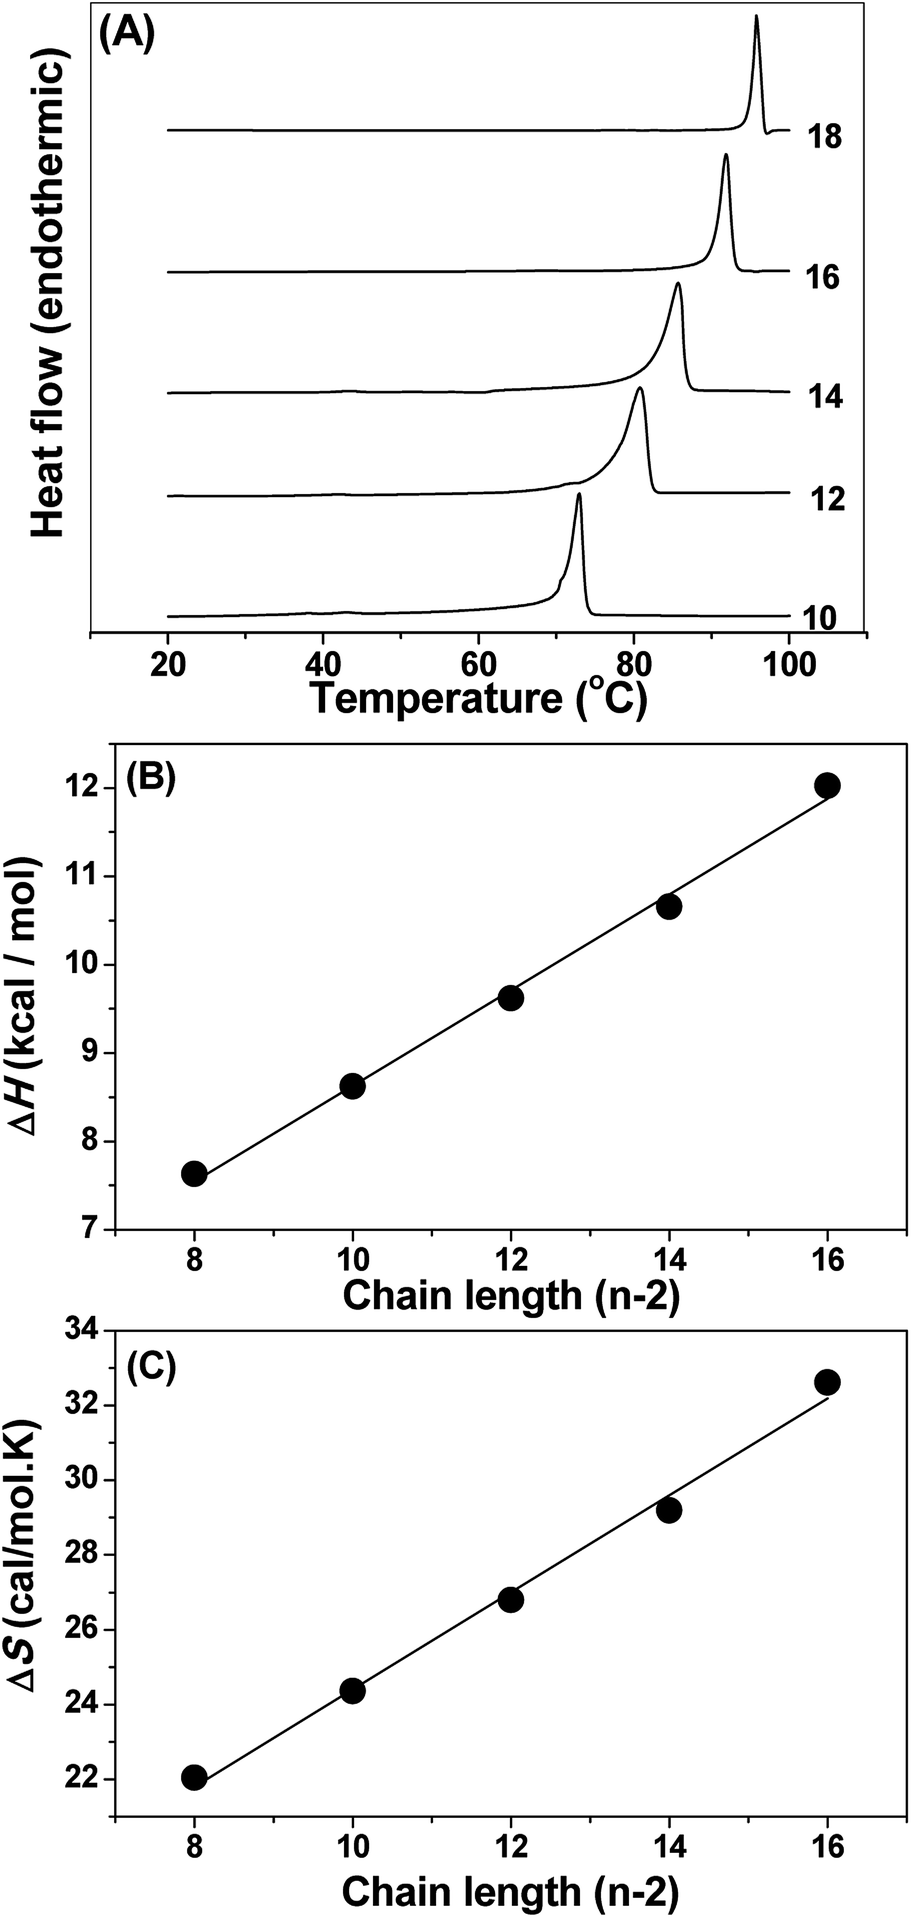
The thermotropic phase behaviour of the NATM aqueous solution was studied by differential scanning calorimetry. Fig. 4A shows the heating thermograms of hydrated NATM. Rescanning the samples for the second time showed a significant shift in the transition temperature (decreases about 3 °C) and showed marked changes in the transition enthalpies. This suggests that during cooling NATM do not come back to the original structure. Thus, the first heating scan was taken for further analysis and the total area under the transition was integrated to get the transition enthalpy (ΔHt) and transition entropy (ΔSt). The obtained transition temperature (Tt), (ΔHt) and (ΔSt) are presented in Table 1.
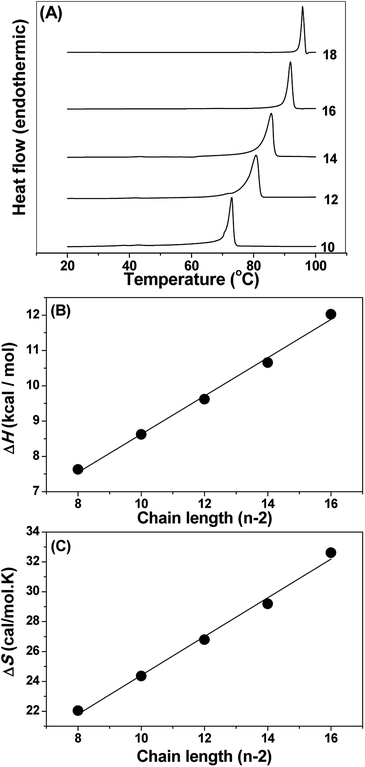 |
| | Fig. 4 (A) DSC heating thermograms of hydrated NATMs. The number of C atoms in the acyl chain is indicated against each thermogram. (B) Chain length dependence of transition enthalpy and (C) transition entropy of hydrated NATMs. Values of ΔHt and ΔSt were plotted against the number of methylene (CH2) units (n − 2). Solid lines correspond to linear least squares fits of the data. | |
Table 1 Average values of transition temperatures (Tt), transition enthalpies (ΔHt) and transition enthalpies (ΔSt) of NATM in aqueous solution with respect to the acyl chain length (n)
| n |
Tt (°C) |
ΔHt (kcal mol−1) |
ΔSt (cal mol−1 K−1) |
| 10 |
72.9 ± 0.4 |
7.73 ± 0.02 |
22.04 ± 0.16 |
| 12 |
80.8 ± 0.7 |
8.62 ± 0.19 |
24.26 ± 0.05 |
| 14 |
85.7 ± 0.8 |
9.62 ± 0.03 |
26.79 ± 0.08 |
| 16 |
91.8 ± 0.5 |
10.65 ± 0.66 |
29.18 ± 0.09 |
| 18 |
95.7 ± 0.4 |
12.02 ± 0.08 |
32.60 ± 0.08 |
The ΔHt and ΔSt exhibited linear relationship with respect to the acyl chain length (n) and the data were analyzed by the following expression:
| | |
ΔHt = (n − 2) ΔHinc + ΔH0
| (2) |
| | |
ΔSt = (n − 2) ΔSinc + ΔS0
| (3) |
where Δ
H0 and Δ
S0 are the end contributions to the Δ
Ht and Δ
St, respectively arising from the terminal methyl group and the polar head group region of NATM. Δ
Hinc and Δ
Sinc are the incremental values of Δ
Ht and Δ
St per methylene group. The linear chain length dependence of Δ
Ht and Δ
St indicate that the structure, molecular packing and the intramolecular interaction of various NATM are likely to be very similar, which agrees with the crystal structure. From
Fig. 4B and C, the incremental values and end contributions of Δ
Ht and Δ
St were obtained from the linear least square analysis. The Δ
H0 and Δ
S0 observed for NATM are 3.21 ± 0.27 kcal mol
−1 and 11.42 ± 0.74 cal mol
−1 K
−1, respectively. The Δ
Hinc and Δ
Sinc observed for the NATM are 0.54 ± 0.02 kcal mol
−1 and 1.30 ± 0.06 cal mol
−1, respectively. The obtained positive end contributions and positive incremental values are indicative of hydrophobic interaction playing a role in the self-assembly of NATM, which could arise from the interaction between the acyl chain. These results were interpreted as that the polar head group of NATM may form a hydrogen bond network in aqueous medium, but the hydrophobic acyl chain prefers to have minimal contact with water. As a result, acyl chain come together and interacts with each other spontaneously and resulted in increased entropy and enthalpy. The contribution from electrostatic and hydrophobic interaction can be studied by sodium chloride because NaCl may produce hindrance to the electrostatic interaction. The DSC study performed with 1 M NaCl showed unaltered phase transition temperature and transition entropy and enthalpy (Fig. S19
†). Thus, the results were interpreted by considering that the self-assembled structure retains similar phase with and without salt, which also suggests that the driving force is not electrostatic but majorly hydrophobic in nature.
The fluorescence probe laurdan was widely used to study the phase state of biological and model membranes.24 The fluorescence emission maxima of laurdan in phospholipid vary with maxima at 435 nm for the gel phase  and 485 nm for the liquid crystalline phase Lα.25 Fig. 5A shows the fluorescence emission maxima of laurdan in N10TM and sodium dodecyl sulfate (SDS) micelles at room temperature. SDS micelles showed emission maxima at 503 nm whereas the emission maxima of the probe in N10TM were observed at 425 nm, which indicates that the probe is located in the low polar environment where the acyl chains are tightly packed. While heating the N10TM above the phase transition, the laurdan emission maxima undergoes a red shift from 425 to 465 nm, indicating the formation of liquid crystalline phase and the probe was experiencing a polar environment. At the same time, the gel phase and liquid crystalline phase of N10TM is not similar to gel and fluid phase of DMPC bilayer because previous studies of laurdan fluorescence in DMPC bilayer have showed the laurdan emission maxima at 435 and 485 nm for the gel and fluid phase, respectively.25 The observed blue shift in the emission maxima of the probe in N10TM was interpreted as tight packing of the acyl chains of NATM as compared to phospholipid bilayer. The tight packing of acyl chain in NATM could occur by the formation of interdigitized structure as observed in the single crystal (Fig. 2).
 |
| | Fig. 5 (A) Emission spectra of laurdan in N10TM. SDS micelles serve as a control. Excitation: 350 nm. (B) Prodan fluorescence spectra in N10TM. Excitation: 359 nm. 3 mM N10TM in 10 mM phosphate buffer, pH 7.4 was used. | |
The interdigitized phase formed by the interpenetration of the acyl chain from opposing monolayer has been documented for the asymmetrical and symmetrical phosphatidylcholine lipids and described as one form of the stable lipid phase state. Thus, further studies were conducted to characterize the interdigitized phase formed by NATM. Prodan has been known for evaluating ethanol induced formation of fully interdigitized phases in phospholipids.26 It exhibits a wavelength shift from 520 nm in water to ∼435 nm in gel phase  ∼485 nm in fluid phase Lα and ∼507 nm in interdigitized gel phase LβI.26 Fig. 5B shows the prodan spectrum in N10TM in the presence and absence of ethanol. The main fluorescence maximum was observed at 518 nm with a shoulder at 430 nm, suggesting that the prodan is located in the highly polar environment. The fluorescence maximum at 518 nm supports the formation of interdigitized gel phase and suggests that the tighter packing of the acyl chain in this phase compared to the non-interdigitized gel phase has squeezed out the prodan into the aqueous phase. A similar prodan spectrum was observed for DPPC in the interdigitized gel phase, except the peak maxima and the shoulder was observed at 507 nm and 430 nm, respectively.26 The difference in the peak maxima can be interpreted by considering differential partitioning of the probe in interdigitized lipid bilayers and interdigitized NATM. The addition of ethanol causes a small decrease in the maximum at 430 nm and a significant increase at 518 nm, which supports that the NATM exists in interdigitized gel phase in aqueous solution without an aid from ethanol. The change in fluorescence intensity at 518 nm can be attributed to the difference in the solubility of the probe in the ethanol containing solvent compared to water. At 80 °C, prodan spectrum in N10TM shows maxima at 516 nm without residual shoulder at 430 nm, suggesting that NATM undergone a phase change from an interdigitized gel phase. The spectral shifts induced by temperature were also observed in other NATMs. Taken together, the results obtained from the laurdan and prodan fluorescence probe supports the conclusion that the aqueous solution of NATM readily forms interdigitized gel phases below the phase transition and forms a liquid crystalline phase above the phase transition. The formation of full interdigitized structure by NATM was supported by X-ray diffraction studies and DSC studies revealed the thermotropic phase transition in NATM.
3.5. Molecular modelling
Having known that NATM forms interdigitized structure, we modeled the single crystal 3D-corrdinates of NATM into vesicles and energy minimized using the MacroModel module of the Schrödinger suite.28 For modelling, we defined our own constraint scripting to pack the head and tail of NATM as alternatives to each other by using 850 monomers that form a perfect packing. The two-dimensional representation of the N10TM vesicles is shown in Fig. 6. The potential energy values for the vesicle model was derived from the energy contribution from various force fields, which includes stretching, bend, torsion, improper torsion, van der Waal's, electrostatic, and solvation energy. The potential energy calculations show that the proposed vesicle models are energetically stable.
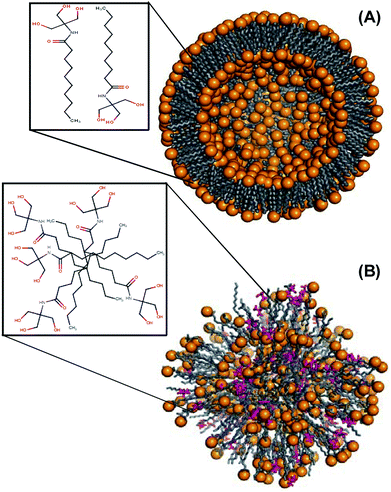 |
| | Fig. 6 Molecular modelling. Cross sectional view of energy minimized N10TM vesicle in (A) aqueous solution and (B) isopropanol, pink color. Two-dimensional representations of the packing are shown in the square. | |
As noted from Table 2, the contributions from electrostatic and van der Waal's terms are very significant in the formation of vesicles. The observed higher values for electrostatic interaction can be attributed to the interaction between the polar head groups. Crystal structure of N10TM, N12TM and N14TM also revealed strong intermolecular H-bonding between polar head groups in the crystal lattice (Fig. 1, 2 and S16†). In order to distinguish the role of hydrophobic forces in the self-assembly, we performed energy minimization of the vesicles in isopropanol instead of water. Interestingly, the vesicle collapsed and the force filed parameters decreases considerably. The comparison of the total energy of the vesicles in aqueous solution (−62977.2 kcal mol−1) and isopropanol (−37598.9 kcal mol−1) suggest that the formation of vesicles is favoured by van der Waals though the contribution from electrostatic is significant.
Table 2 Energy contribution from force
| Force field parameters (kcal mol−1) |
In water |
In isopropanol |
| N10TM |
N12TM |
N14TM |
N10TM |
| Stretch |
3594.2 |
3667.8 |
3802.1 |
2224.8 |
| Bend |
13464.4 |
14088.7 |
14507.8 |
8912.3 |
| Torsion |
30357.1 |
30754.6 |
30181.4 |
20161.7 |
| Improper torsion |
77.3 |
79.2 |
67.6 |
103.2 |
| van der Wall's |
−17686.8 |
−18961.9 |
−21298.9 |
−7893.8 |
| Electrostatic |
−76633.2 |
−74313.1 |
−73243.8 |
−51386.6 |
| Solvation |
−16150.2 |
−15921.9 |
−14206.3 |
−9720.5 |
| Total energy |
−62977.2 |
−60606.6 |
−60190.1 |
−37598.9 |
3.6. Microscopy analysis of the self-assembled NATM
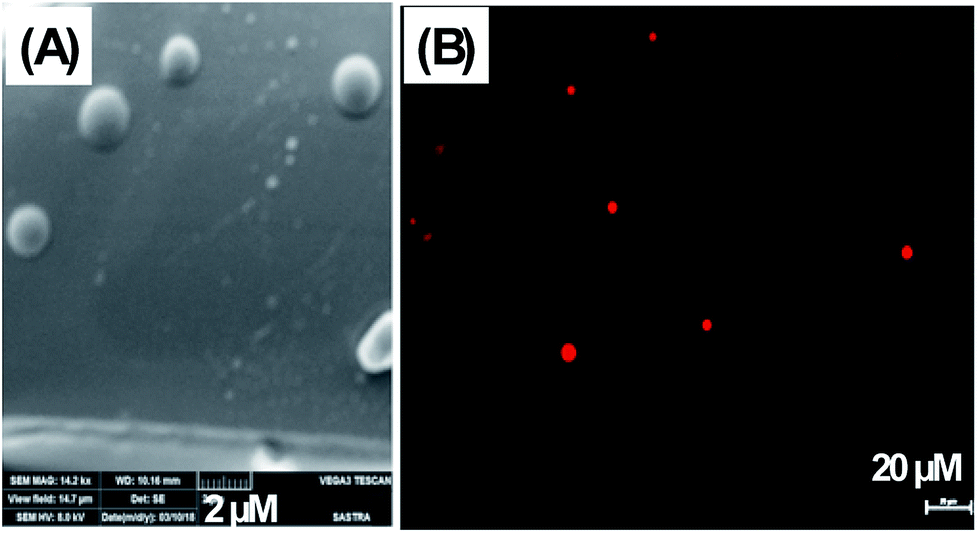
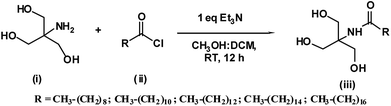
The formation of vesicles via self-assembly of NATM was observed with scanning electron microscopy as well as optical microscopy. Fig. 7A showed that NATM self-assembled into spheres with a typical size of 0.3–7 μM. In order to visualize the vesicles under fluorescence microscopy, N10TM thin films were prepared with Rhodamine B (RhB). RhB serves as a hydrophilic model drug and also serves as a fluorescent probe.29 The hydrated thin films form vesicles and showed red fluorescent vesicles in fluorescence microscopy (Fig. 7B). The similar vesicles formation was observed with other NATMs. These observations are consistent with SEM examination and also suggests that the vesicles formed by NATMs can be used to entrap molecules for developing drug carriers.
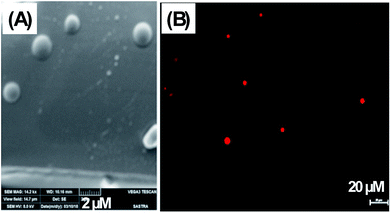 |
| | Fig. 7 (A) Scanning electron micrograph of N10TM vesicles and (B) fluorescence microscopy image of N10TM vesicles with model drug, Rhodamine B. | |
4. Conclusions
To our knowledge, this is the first report on the synthesis and physicochemical characterization of a homologous series of N-acyltromethamine bearing saturated acyl chains of different chain lengths (n = 10–18). The molecular conformation, packing properties and intermolecular interactions of NATM have been determined by single crystal X-ray diffraction analysis. The structural analysis clearly showed that the NATM molecules are arranged in head-to-tail packing forming a common hydrocarbon layer, which is bordered on each side by a region of polar group resembling bilayer packing. The critical aggregation concentration of NATMs determined in phosphate buffer, pH 7.4 revealed that CAC decreases linearly with an increase in the methylene unit. DSC results indicated that the thermodynamic parameters, ΔHt and ΔSt, exhibit a linear dependence on the chain length. Microfluidity of the self-assembled NATM monitored by emission spectra of laurdan and prodan suggest that NATM forms interdigitized gel phase below the phase transition temperature and adopts fluidized interdigitized phase above Tt. Molecular modelling suggest that the interdigitized self-assembled NATM preferentially form vesicles in aqueous solution. The formations of vesicles were confirmed by scanning electron microscopy. In addition, we have demonstrated encapsulation of Rhodamine B, a hydrophilic model drug. Further studies aim at the interaction of NATM with biological membranes may allow us to develop a membrane targeting drug delivery vehicles.
Conflicts of interest
There are no conflicts to declare.
Acknowledgements
We gratefully acknowledge the Department of Science and Technology, New Delhi, for support of this work (SB/FT/LS-217/2012). S. M. and S. B. S. earnestly acknowledge the teaching assistantship from SASTRA Deemed University. We thank DST FIST (SR/FST/LSI-587); (SB/FST/ETI-331/2013) and SASTRA Deemed University, Central Research Facility (R&M/0021/SCBT-007/2012-13) for the infrastructure.
References
- G. Bruni, V. Berbenni, L. Maggi, P. Mustarelli, V. Friuli, C. Ferrara, F. Pardi, F. Castagna, A. Girella, C. Milanese and A. Marini, Multicomponent crystals of gliclazide and tromethamine: preparation, physico-chemical, and pharmaceutical characterization, Drug Dev. Ind. Pharm., 2018, 44, 243 CrossRef PubMed.
- E. A. Hoste, K. Colpaert, R. C. Vanholder, N. H. Lameire, J. J. De Waele, S. I. Blot and F. A. Colardyn, Sodium bicarbonate versus THAM in ICU patients with mild metabolic acidosis, J. Nephrol., 2005, 18, 303 Search PubMed.
- https://www.google.co.in/patents/US3718664.
- H. B. Bradshaw and J. M. Walker, The expanding field of cannabimimetic and related lipid mediators, Br. J. Pharmacol., 2005, 144, 459 CrossRef PubMed.
- U. Grabiec and F. Dehghani, A Novel Endocannabinoid and Endovanilloid with Widespread Physiological and Pharmacological Activities, Cannabis Cannabinoid Res., 2017, 2, 183 CrossRef PubMed.
- R. Smoum, A. Bar, B. Tan, G. Milman, M. Attar-Namdar, O. Ofek, J. M. Stuart, A. Bajayo, J. Tam, V. Kram, D. O'Dell, M. J. Walker, H. B. Bradshaw, I. Bab and R. Mechoulam, Oleoyl serine, an endogenous N-acyl amide, modulates bone remodeling and mass, Proc. Natl. Acad. Sci. U. S. A., 2010, 107, 17710 CrossRef PubMed.
- G. S. Kwon and T. Okano, Polymeric micelles as new drug carriers, Adv. Drug Delivery Rev., 1996, 21, 107 CrossRef.
- J. P. A. Custers, L. J. P. Van den Broeke and J. T. F. Keurentjes, Phase behavior and micellar properties of carboxylic acid end group modified pluronic surfactants, Langmuir, 2007, 23, 12857 CrossRef PubMed.
- J. Dey and S. Shrivastava, Physicochemical Characterization and Self-Assembly Studies on Cationic Surfactants Bearing mPEG Tail, Langmuir, 2012, 28, 17247 CrossRef PubMed.
- K. Jagatheeswaran, M. Sengan, A. A. Khan Behlol, P. Marimuthu, A. Veerappan and S. G. Subramaniapillai, Stearyl MethoxyPEGglycol Succinate-A Designer Micellar Medium for Diverse Aniline Derivatives Synthesis, ACS Sustainable Chem. Eng., 2017, 5, 5740 CrossRef.
- N. Nishiyama and K. Kataoka, Nanostructured devices based on block copolymer assemblies for drug delivery: designing structures for enhanced drug function, Adv. Polym. Sci., 2006, 193, 67 CrossRef.
- M. Jaimi, B. Steve, K. Robert, H. John, C. Patrick and K. A. Rao, A novel presentation of nonionic PEG surfactants' characteristics, Cosmet. Toiletries, 2004, 119, 61–68 Search PubMed.
- L. Jinyao, P. Yan, H. Wei, Z. Xinyuan, Z. Yongfeng and Y. Deyue, Self-Assembly of phospholipid-analogous hyperbranched polymers nanomicelles for drug delivery, Biomaterials, 2010, 31, 1334 CrossRef PubMed.
- M. Ramakrishnan and M. J. Swamy, Molecular packing and intermolecular interactions in N-acylethanolamines: crystal structure of N-myristoylethanolamine, Biochim. Biophys. Acta, 1999, 1418, 261 CrossRef.
- S. T. Reddy, P. K. Tarafdar, R. K. Kamlekar and M. J. Swamy, Structure and Thermotropic Phase Behavior of a Homologous Series of Bioactive N-Acyldopamines, Structure and Thermotropic Phase Behavior of a Homologous Series of Bioactive N-Acyldopamines, J. Phys. Chem. B, 2013, 117, 8747 CrossRef PubMed.
- S. T. Reddy, P. K. Krovi and M. J. Swamy, Structure and Thermotropic Phase Behavior of a Homologous Series of N-Acylglycines: Neuroactive and Antinociceptive Constituents of Biomembranes, Cryst. Growth Des., 2014, 14, 4944 CrossRef.
- H. Hauser, I. Pascher and S. Sundell, Conformation of Phospholipids Crystal Structure of a Lysophosphatidylcholine Analogue, J. Mol. Biol., 1980, 137, 249 CrossRef PubMed.
- J. Swain, M. Mohapatra, S. R. Borkar, I. S. Aidhen and A. K. Mishra, Study of aqueous phase aggregation of FTY720 (fingolimod hydrochloride) and its effect on
DMPC liposomes using fluorescent molecular probes, Phys. Chem. Chem. Phys., 2013, 15, 17962 RSC.
- D. Sivaramakrishna, S. T. Reddy, T. Nagaraj and M. J. Swamy, Self-assembly, supramolecular organization, and phase transitions of a homologous series of N-acyl-l-alanines (n = 8-20), Colloids Surf., A, 2015, 471, 108 CrossRef.
- M. Sengan, V. Pothiappan and A. Veerappan, Synthesis, characterization, and determination of critical micellar concentration and thermotropic phase transition of taurolipids, J. Mol. Liq., 2017, 234, 104 CrossRef.
- J. M. del Rio, C. Pombo, G. Prieto, V. Mosquera and F. Sarmiento, Effect of Temperature and Alkyl Chain Length on the Micellar Properties of n-Alkyltrimethylammonium Bromides in a Low pH Medium, J. Colloid Interface Sci., 1995, 172, 137 CrossRef.
- H. I. Petrache, T. Zemb, L. Belloni and V. A. Parsegian, Salt screening and specific ion adsorption determine neutral-lipid membrane interactions, Proc. Natl. Acad. Sci. U. S. A., 2006, 103, 7982 CrossRef PubMed.
- R. Jain, D. Sharma and R. Kumar, Effects of alcohols on the stability and low-frequency local motions that control the slow changes in structural dynamics of ferrocytochrome c, J. Biochem., 2013, 154, 341 CrossRef PubMed.
- V. Anbazhagan, C. Munz, L. Tome and D. Schneider, Fluidizing the membrane by a local anesthetic: phenylethanol affects membrane protein oligomerization, J. Mol. Biol., 2010, 404, 773 CrossRef PubMed.
- V. Anbazhagan and D. Schneider, The membrane environment modulates self-association of the human GpA TM domain--implications for membrane protein folding and transmembrane signaling, Biochim. Biophys. Acta, 2010, 1798, 1899 CrossRef PubMed.
- O. P. Bondar and E. S. Rowe, Preferential Interactions of Fluorescent Probe Prodan with Cholesterol, Biophys. J., 1999, 76, 956 CrossRef PubMed.
- D. Marsh, Handbook of Lipid Bilayers, CRC Press, Boca Raton, FL, 1990 Search PubMed.
- Schrödinger Release 2018-1, MacroModel, Schrödinger, LLC, New York, NY, 2018 Search PubMed.
- B. Song, C. Wu and J. Chang, Controllable delivery of hydrophilic and hydrophobic drugs from electrospun poly(lactic-co-glycolic acid)/mesoporous silica nanoparticles composite mats, J. Biomed. Mater. Res., Part B, 2012, 100, 2178 CrossRef PubMed.
- M. A. Thompson, Molecular docking using arguslab, an efficient shape-based search algorithm and the ascore scoring function, ACS meeting, Philadelphia, PA, 2004, vol. 172, p. CINF 42 Search PubMed.
- L. Martínez, R. Andrade, E. G. Birgin and J. M. Martínez, Packmol: a package for building initial configurations for molecular dynamics simulations, J. Comput. Chem., 2009, 30, 2157 CrossRef PubMed.
- G. A. Kaminski, R. A. Friesner, J. Tirado-Rives and W. L. Jorgensen, Evaluation and Reparametrization of the OPLS-AA Force Field for Proteins via Comparison with Accurate Quantum Chemical Calculations on Peptides, J. Phys. Chem. B, 2001, 105, 6474 CrossRef.
- W. C. Still, A. Tempczyk, R. C. Hawlely and T. Hendrickson, A General Treatment of Solvation for Molecular Mechanics, J. Am. Chem. Soc., 1990, 112, 6127 CrossRef.
- W. L. DeLano, The PyMOL Molecular Graphics System, DeLano Scientific LLC, San Carlos, CA, USA, 2018 Search PubMed.
Footnote |
| † Electronic supplementary information (ESI) available: NMR data, single crystal parameters, FTIR, fluorescence titration, DSC. CCDC 1831968–1831970 (N14TM). For ESI and crystallographic data in CIF or other electronic format see DOI: 10.1039/c8ra06479b |
|
| This journal is © The Royal Society of Chemistry 2018 |
Click here to see how this site uses Cookies. View our privacy policy here. 
 Open Access Article
 This Open Access Article is licensed under a Creative Commons Attribution-Non Commercial 3.0 Unported Licence
 a,
Jothi Arunachalama,
Dohyun Moon*b and
Anbazhagan Veerappan
a,
Jothi Arunachalama,
Dohyun Moon*b and
Anbazhagan Veerappan
 and 485 nm for the liquid crystalline phase Lα.25 Fig. 5A shows the fluorescence emission maxima of laurdan in N10TM and sodium dodecyl sulfate (SDS) micelles at room temperature. SDS micelles showed emission maxima at 503 nm whereas the emission maxima of the probe in N10TM were observed at 425 nm, which indicates that the probe is located in the low polar environment where the acyl chains are tightly packed. While heating the N10TM above the phase transition, the laurdan emission maxima undergoes a red shift from 425 to 465 nm, indicating the formation of liquid crystalline phase and the probe was experiencing a polar environment. At the same time, the gel phase and liquid crystalline phase of N10TM is not similar to gel and fluid phase of DMPC bilayer because previous studies of laurdan fluorescence in DMPC bilayer have showed the laurdan emission maxima at 435 and 485 nm for the gel and fluid phase, respectively.25 The observed blue shift in the emission maxima of the probe in N10TM was interpreted as tight packing of the acyl chains of NATM as compared to phospholipid bilayer. The tight packing of acyl chain in NATM could occur by the formation of interdigitized structure as observed in the single crystal (Fig. 2).
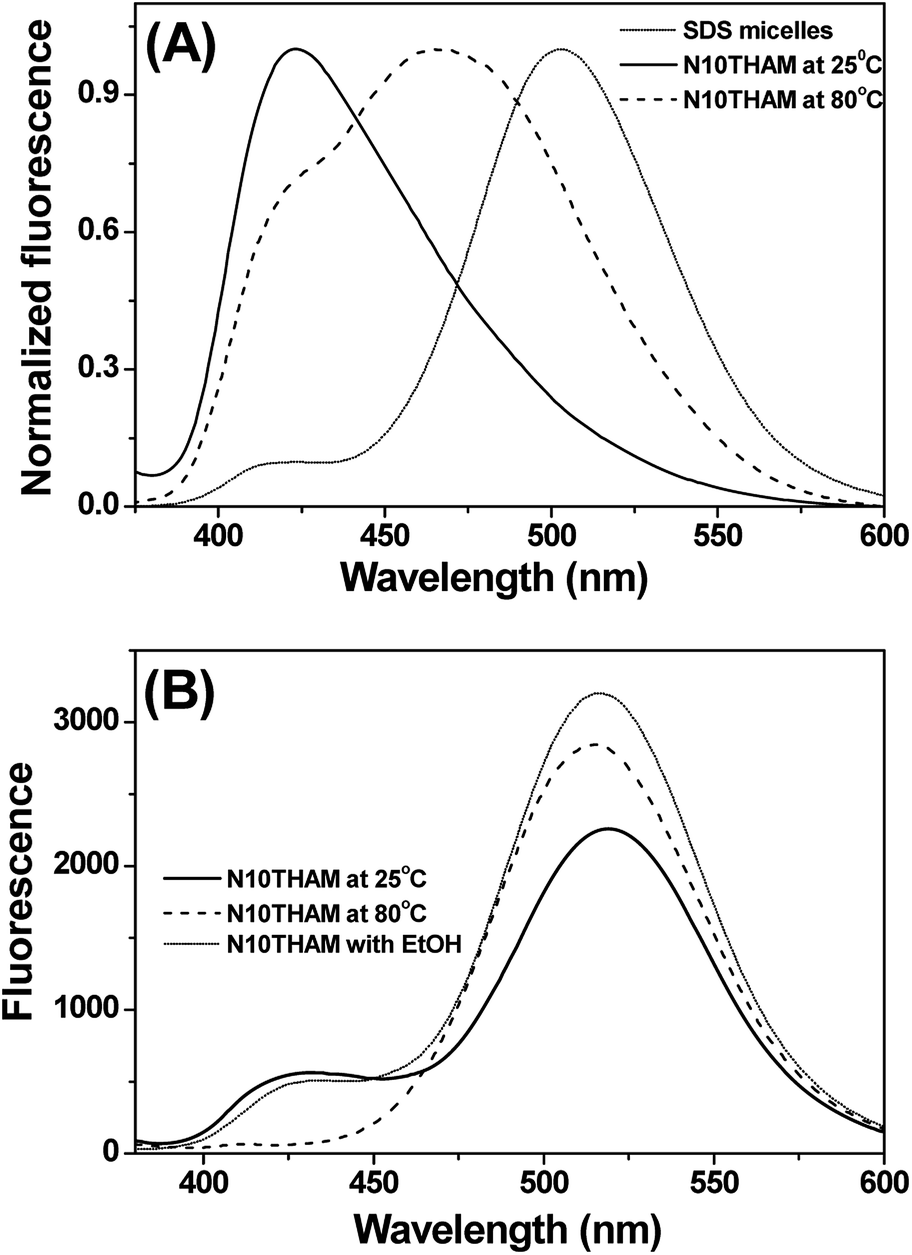
 ∼485 nm in fluid phase Lα and ∼507 nm in interdigitized gel phase LβI.26 Fig. 5B shows the prodan spectrum in N10TM in the presence and absence of ethanol. The main fluorescence maximum was observed at 518 nm with a shoulder at 430 nm, suggesting that the prodan is located in the highly polar environment. The fluorescence maximum at 518 nm supports the formation of interdigitized gel phase and suggests that the tighter packing of the acyl chain in this phase compared to the non-interdigitized gel phase has squeezed out the prodan into the aqueous phase. A similar prodan spectrum was observed for DPPC in the interdigitized gel phase, except the peak maxima and the shoulder was observed at 507 nm and 430 nm, respectively.26 The difference in the peak maxima can be interpreted by considering differential partitioning of the probe in interdigitized lipid bilayers and interdigitized NATM. The addition of ethanol causes a small decrease in the maximum at 430 nm and a significant increase at 518 nm, which supports that the NATM exists in interdigitized gel phase in aqueous solution without an aid from ethanol. The change in fluorescence intensity at 518 nm can be attributed to the difference in the solubility of the probe in the ethanol containing solvent compared to water. At 80 °C, prodan spectrum in N10TM shows maxima at 516 nm without residual shoulder at 430 nm, suggesting that NATM undergone a phase change from an interdigitized gel phase. The spectral shifts induced by temperature were also observed in other NATMs. Taken together, the results obtained from the laurdan and prodan fluorescence probe supports the conclusion that the aqueous solution of NATM readily forms interdigitized gel phases below the phase transition and forms a liquid crystalline phase above the phase transition. The formation of full interdigitized structure by NATM was supported by X-ray diffraction studies and DSC studies revealed the thermotropic phase transition in NATM.