 Open Access Article
Thermally stable La2LiSbO6:Mn4+,Mg2+ far-red emitting phosphors with over 90% internal quantum efficiency for plant growth LEDs
Liangling Sun,
Balaji Devakumar,
Jia Liang,
Bin Li,
Shaoying Wang,
Qi Sun,
Heng Guo and
Xiaoyong Huang *
*
Key Lab of Advanced Transducers and Intelligent Control System, Ministry of Education and Shanxi Province, College of Physics and Optoelectronics, Taiyuan University of Technology, Taiyuan 030024, P. R. China. E-mail: huangxy04@126.com
First published on 12th September 2018
Abstract
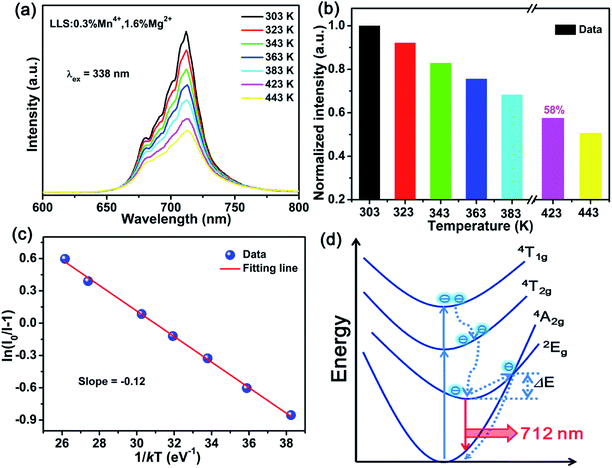
In this paper, we reported on the high-efficiency and thermally-stable La2LiSbO6:Mn4+,Mg2+ (LLS:Mn4+,Mg2+) far-red emitting phosphors. Under 338 nm excitation, the composition-optimized LLS:0.3%Mn4+,1.6%Mg2+ phosphors which were made up of [SbO6], [LiO6], and [LaO8] polyhedrons, showed intense far-red emissions peaking at 712 nm (2Eg → 4A2g transition) with internal quantum efficiency as high as 92%. The LLS:0.3%Mn4+,1.6%Mg2+ phosphors also exhibited high thermal stability, and the emission intensity at 423 K only reduced by 42% compared with its initial value at 303 K. The far-red light-emitting device has also been made by using the LLS:0.3%Mn4+,1.6%Mg2+ phosphors and a 365 nm emitting InGaN chip, which can emit far-red light that is visible to the naked eye. Importantly, the emission spectrum of the LLS:0.3%Mn4+,1.6%Mg2+ phosphors can match well with the absorption spectrum of phytochrome PFR, indicating the potential of these phosphors to be used in plant growth light-emitting diodes.
Introduction
With the development of the economies of all countries in the world, environmental and energy issues have received increasing attention.1–7 The use of commercial greenhouses has grown rapidly in recent years to obtain green grains and high-quality vegetables.8,9 Light plays an important role in plant growth, because it can affect the growth rhythm of natural plants, such as delaying the plant blooming time or promoting plant blooming ahead of schedule.10 Phytochrome PR and PFR can influence the plant blooming time by converting to each other; PR needs more red light peaking at 660 nm to switch to the PFR biologically active state, and PFR captures more far-red light peaking at about 730 nm to convert to the PR biologically inactive state.11,12 The short-day plants will bloom when the PR concentration is higher than PFR, and the longer-day plants need more daylight to flower.13 Thus it is important for plants to be exposed to light, which has a suitable proportion of red and far-red light components.8,14 Therefore, research on far-red phosphors is very meaningful for plant lighting in the agricultural field.The phosphor-converted light-emitting diodes (LEDs), which show the advantages of energy-saving, long working lifetime, and environmental protection, have gained increasing attention as the next-generation light source.15–23 In recent years, intense research efforts have been devoted into developing high-efficiency red phosphors for white LEDs, such as NaMgGdTeO6:Mn4+,24 Na3MgZr(PO4)3:Eu3+,25 CaAl12O19:Mn4+,26 and LiCa3MgV3O12:Eu3+.27 In sharp contrast, there is little research on the far-red emitting phosphors for plant growth LEDs.28–30 Thus, the research on the high-efficiency red phosphors for far-red LEDs used in plant cultivation has a far-reaching significance.
Mn4+ ions can be doped into the octahedral sites in the host as an activator,31,32 resulting in the efficient red or far-red emissions which are significant for plant growth.33–37 La2LiSbO6 compound with double-perovskite structure, which contains two octahedral structures, [SbO6] and [LiO6], have be reported by M. L. López et al.38 In this paper, La2LiSbO6:Mn4+,Mg2+ (LLS:Mn4+,Mg2+) far-red-emitting phosphors have been systematically studied. Under the excitation of 338 nm, LLS:0.3%Mn4+,1.6%Mg2+ phosphors exhibited intense far-red emission around 712 nm (2Eg → 4A2g transition), which matched well with the absorption spectrum of phytochrome PFR. Importantly, the internal quantum efficiency (IQE) of the LLS:0.3%Mn4+,1.6%Mg2+ phosphors reached as high as 92%. The temperature-dependent spectra illustrated that LLS:0.3%Mn4+,1.6%Mg2+ phosphors had excellent thermal stability with an activation energy of 0.12 eV, and the integral intensity at 423 K is 0.58-fold compared with its initial value at 303 K. All characteristics show that the LLS:xMn4+,yMg2+ far-red emitting phosphors would have potential application in plant growth LEDs.
Experimental section
LLS:xMn4+ (x = 0.1–1.5%) phosphors were prepared by solid-state reaction method. The amount of final product was fixed at 0.005 mol for each sample. The starting materials of Li2CO3 (analytical reagent, AR), Sb2O5 (99%), MnCO3 (AR) and La2O3 (99.99%) were weighed according to the molar ratio of 1.03![[thin space (1/6-em)]](https://www.rsc.org/images/entities/char_2009.gif) :
:![[thin space (1/6-em)]](https://www.rsc.org/images/entities/char_2009.gif) (1 − x)
(1 − x)![[thin space (1/6-em)]](https://www.rsc.org/images/entities/char_2009.gif) :
:![[thin space (1/6-em)]](https://www.rsc.org/images/entities/char_2009.gif) 2x
2x![[thin space (1/6-em)]](https://www.rsc.org/images/entities/char_2009.gif) :
:![[thin space (1/6-em)]](https://www.rsc.org/images/entities/char_2009.gif) 2 and ground in an agate mortar, then transferred to Al2O3 crucibles to pre-heat at 70 °C for 10 h in air. Then the obtained mixtures were ground thoroughly again, and calcined at 800 °C for 10 h in air. Subsequently, the obtained products were uniformly ground again and calcined at 1100 °C for 10 h in air to get the final samples. Finally, when the furnace was cooled down to room temperature, the obtained products were ground into fine powders for further characterizations. The LLS:0.3%Mn4+,yMg2+ phosphors were prepared by using the similar method, and the MgO (AR) was weighed at 0.8%, 1.2%, 1.6%, and 2.0% of the total molar amount of Li atom.
2 and ground in an agate mortar, then transferred to Al2O3 crucibles to pre-heat at 70 °C for 10 h in air. Then the obtained mixtures were ground thoroughly again, and calcined at 800 °C for 10 h in air. Subsequently, the obtained products were uniformly ground again and calcined at 1100 °C for 10 h in air to get the final samples. Finally, when the furnace was cooled down to room temperature, the obtained products were ground into fine powders for further characterizations. The LLS:0.3%Mn4+,yMg2+ phosphors were prepared by using the similar method, and the MgO (AR) was weighed at 0.8%, 1.2%, 1.6%, and 2.0% of the total molar amount of Li atom.
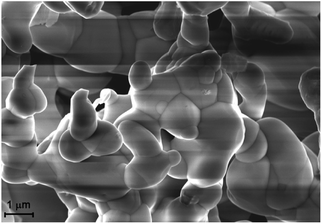
The X-ray diffraction (XRD) patterns of the phosphors were measured by using a Bruker D8 ADVANCE diffractometer with Cu Kα radiation (λ = 1.5406 Å). The morphology of the LLS:0.3%Mn4+ phosphors was recorded by using a field-emission scanning electron microscope (FE-SEM; TESCAN MAIA3). The photoluminescence (PL) spectra/PL excitation (PLE) spectra were measured by an Edinburgh FS5 spectrometer with a 150 W continuous-wave xenon lamp as the excitation source. The temperature-dependent spectra were recorded on the same spectrometer equipping with a temperature controller. The luminescence decay curves and the IQE of the as-prepared sample were measured by Edinburgh FS5 spectrometer equipped with a pulsed xenon lamp as the excitation source and an integrating sphere coated with barium sulfate, respectively. The far-red light-emitting device was fabricated by coating the LLS:0.3%Mn4+,1.6%Mg2+ phosphors onto a 365 nm emitting InGaN chip, and the corresponding photoelectric properties of the device under a bias current of 300 mA were measured by using a spectroradiometer system (HAAS-2000, Everfine).
Results and discussion
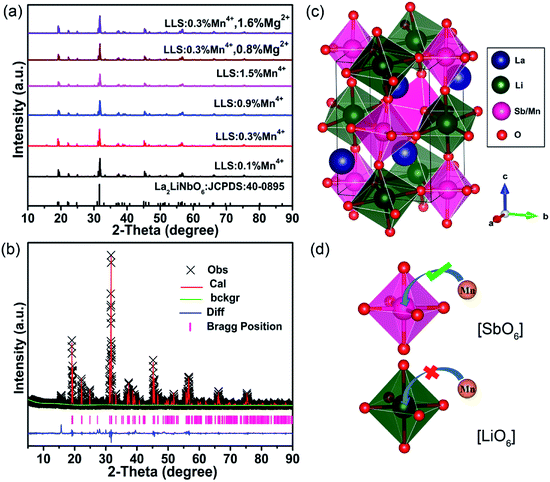
Fig. 1(a) shows the XRD patterns of LLS:xMn4+,yMg2+ (x = 0.1%, 0.3%, 0.9% and 1.5%; y = 0.8% and 1.6%) phosphors. All the diffraction peaks coincided well with the stand card of La2LiNbO6 compound (JCPDS: 40-0895). Fig. 1(b) and (c) show the Rietveld refined results of LLS:0.3%Mn4+ phosphors and the crystal structure of the LLS:0.3%Mn4+ phosphors, respectively. From the Table 1 we could know that the LLS:0.3%Mn4+ phosphors belong to double perovskite structure with monoclinic crystal system and P121/n1 space group. The LLS:0.3%Mn4+ phosphors was build up with [Sb06], [Li06], and [LaO8], in which [Sb06] and [Li06] (see Fig. 1(c)) were bound together by sharing the same oxygen atoms (sharing corners with each other).38 The cell parameters of the LLS:0.3%Mn4+ phosphors were: a = 5.61710(8) Å, b = 5.73188(8) Å, c = 7.96305(11) Å, and V = 256.380(8) Å3. Considering the ion radii and coordination number (CN) of the Mn4+ ions (r = 0.53 Å, CN = 6),39 Sb5+ ions (r = 0.6 Å, CN = 6),40 and Li+ ions (r = 0.76 Å, CN = 6),41 it was reasonable to conclude that the Mn4+ ions would occupy the Sb5+ sites in LLS host. Another parameter to determine which ions are substituted by Mn4+ ions is the radii percentage difference (Dr) between the doping ions (here was Mn4+ ions) and the possible substituted ions (here were Sb5+ and Li+ ions), and the ratio can be estimated by the following expression:42,43
 | (1) |
| LLS:0.3%Mn4+ | |
|---|---|
| Crystal system | Monoclinic |
| Space group | P121/n1 |
| Lattice parameters | a = 5.61710(8) Å, b = 5.73188(8) Å |
| c = 7.96305(11) Å, α = γ = 90° | |
| β = 89.7464(10)° | |
| Unit cell volume | V = 256.380(8) Å3 |
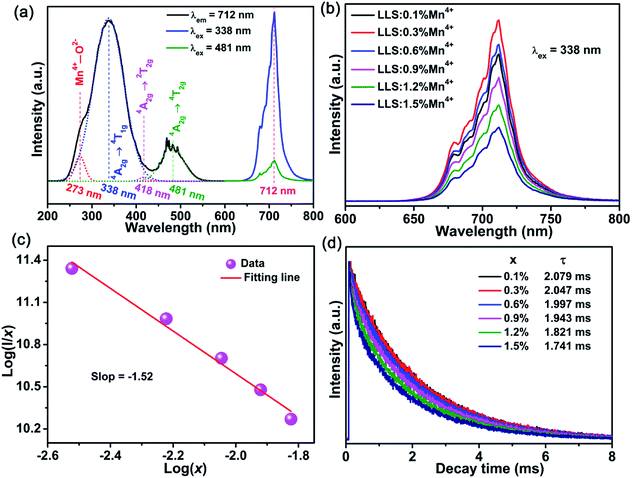
Fig. 3(a) displays the PL (λex = 338 nm) and PLE (λem = 712 nm) spectra of the LLS:0.3%Mn4+ phosphors. Several excitation bands could be found in 220–580 nm wavelength range, and four characteristic peaks peaking at 273 nm (36![[thin space (1/6-em)]](https://www.rsc.org/images/entities/char_2009.gif) 630 cm−1; Mn4+–O2− charge-transfer transition), 338 nm (29
630 cm−1; Mn4+–O2− charge-transfer transition), 338 nm (29![[thin space (1/6-em)]](https://www.rsc.org/images/entities/char_2009.gif) 586 cm−1; 4A2g → 4T1g transition), 418 nm (23
586 cm−1; 4A2g → 4T1g transition), 418 nm (23![[thin space (1/6-em)]](https://www.rsc.org/images/entities/char_2009.gif) 923 cm−1; 4A2g → 2T2g transition), and 481 nm (20
923 cm−1; 4A2g → 2T2g transition), and 481 nm (20![[thin space (1/6-em)]](https://www.rsc.org/images/entities/char_2009.gif) 790 cm−1; 4A2g → 4T2g transition) were obtained based on Gaussian functions.45–47 Obviously, the excitation peak at 338 nm dominated the PLE spectrum. Under the excitation of 338 nm or 481 nm, the LLS:0.3%Mn4+ phosphors exhibited a far-red emission band in 650–800 nm wavelength range peaking at 712 nm (2Eg → 4A2g transition).24
790 cm−1; 4A2g → 4T2g transition) were obtained based on Gaussian functions.45–47 Obviously, the excitation peak at 338 nm dominated the PLE spectrum. Under the excitation of 338 nm or 481 nm, the LLS:0.3%Mn4+ phosphors exhibited a far-red emission band in 650–800 nm wavelength range peaking at 712 nm (2Eg → 4A2g transition).24
Fig. 3(b) presents the PL spectra of the LLS:xMn4+ (x = 0.1–1.5%) phosphors. The maximum emission intensity reached when x = 0.3%, indicating the existence of concentration quenching in LLS:xMn4+ phosphors. The critical distance (Rc) is a parameter for dopant ions in a particular lattice to determine whether exchange interaction or electric multipole interaction contribute to the concentration quenching, which can be obtained by the following formula:48,49
 | (2) |
| I/x = K[1 + β(x)θ/3]−1 | (3) |
Fig. 3(d) depicts the luminescence decay curves of the Mn4+ ions in the LLS:xMn4+ (x = 0.1–1.5%) phosphors (λex = 338 nm; λem = 712 nm). The decay curves of as-prepared samples could be well fitted by the following double exponential expression:54–56
I = A1![[thin space (1/6-em)]](https://www.rsc.org/images/entities/char_2009.gif) exp(−t/τ1) + A2 exp(−t/τ1) + A2![[thin space (1/6-em)]](https://www.rsc.org/images/entities/char_2009.gif) exp(−t/τ2) exp(−t/τ2)
| (4) |
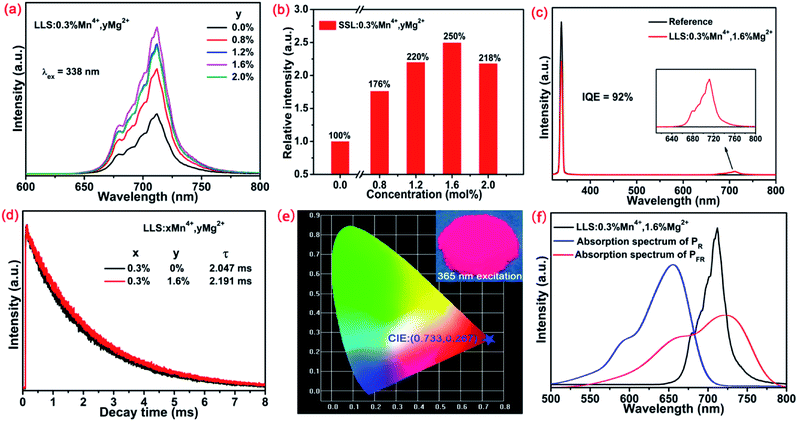
To enhance the emission intensity and IQE of LLS:0.3%Mn4+ phosphors, a series of Mg2+ doped LLS:0.3%Mn4+ phosphors had been synthesized. Fig. 4(a) and (b) shows the PL spectra of LLS:0.3%Mn4+,yMg2+ phosphors doped with different Mn4+ concentrations and the corresponding relative intensity as a function of Mg2+ concentration, respectively. Clearly, the emission intensity of LLS:0.3%Mn4+ phosphors was enhanced by the introduction of Mg2+ ions. Importantly, the emission intensity of the LLS:0.3%Mn4+,1.6%Mg2+ phosphors was about 2.5-fold of the LLS:0.3%Mn4+ counterpart. In the LLS:0.3%Mn4+,1.6%Mg2+ phosphors, the doped Mg2+ ions was served as the charge compensator. Because the radii of the Mg2+ ions (r = 0.72 nm, CN = 6) and Li+ ions (r = 0.76 Å, CN = 6) are relatively close, so the Mg2+ ions might substitute for Li+ sites or occupy Li+ vacancies, and then compensate the imbalanced charges in LLS:0.3%Mn4+ phosphors.57 As a result of charge compensation, the formation of the defects which served as quenching centers in the LLS:0.3%Mn4+ phosphors was avoided. Thus, the emission intensity and IQE of the LLS:0.3%Mn4+ phosphors were largely improved. Meanwhile, the IQE of the LLS:0.3%Mn4+ had also been largely improved by Mg2+ co-doping. The IQEs of LLS:0.3%Mn4+ and LLS:0.3%Mn4+,1.6%Mg2+ (see Fig. 4(c)) were measured to be 61% and 92%, respectively, which was higher than that of K2NaAlF6:Mn4+ (IQE = 58.4%), Ba2TiGe2O8:Mn4+ (IQE = 35.6%), and Mg7Ga2GeO12:Mn4+ (IQE = 28.13%).58–60 The decay lifetime of the LLS:0.3%Mn4+,1.6%Mg2+ phosphors was longer than that of LLS:0.3%Mn4+ counterpart (see Fig. 4(d)). In addition, the CIE coordinates of LLS:0.3%Mn4+,1.6%Mg2+ phosphors were (0.733, 0.267), locating in the far-red region. Importantly, as shown in Fig. 4(f), the PL spectrum of the LLS:0.3%Mn4+,1.6%Mg2+ phosphors matched well with the absorption spectrum of PFR, which indicated the LLS:0.3%Mn4+,1.6%Mg2+ phosphors had great potential to be used as far-red emitting materials in LEDs for plant growth application.
Fig. 5(a) shows the temperature-dependent spectra of the LLS:0.3%Mn4+,1.6%Mg2+ phosphors. The profiles of the emission spectra were almost the same, but the emission intensity gradually reduced with the increasing temperature. As shown in Fig. 5(b), the emission intensity of the LLS:0.3%Mn4+,1.6%Mg2+ phosphors at 423 K remained about 58% compared that at 303 K, which was better than that of Ca3La2W2O12:Mn4+ (29%), CaLaMgNbO6:Mn4+ (45%), SrLaScO4:Mn4+ (15%), and Gd2ZnTiO6:Mn4+ (27.2%),61–64 indicating that the LLS:0.3%Mn4+,1.6%Mg2+ phosphors had good thermal stability. The corresponding activation energy can be obtained by using the following expression:65,66
 | (5) |
In this host, the Mn4+ ions were in a strong field environment, which can be reflected by the ratio of crystal filed strength (Dq) to Racah parameter B. The corresponding Dq and B can be determined by the following eqn (6) and (7):68
| Dq = E(4A2g − 4T2g)/10 | (6) |
 | (7) |
 | (8) |
And according to the fitting result of PL spectrum of the LLS:0.3%Mn4+ phosphors, the peaking energy of 2Eg → 4A2g transition was about 14![[thin space (1/6-em)]](https://www.rsc.org/images/entities/char_2009.gif) 045 cm−1. Therefore, the Racah parameter C can be calculated as following:69,70
045 cm−1. Therefore, the Racah parameter C can be calculated as following:69,70
 | (9) |
Thus, based on the eqn (6)–(9), the values of crystal parameter Dq, B, and C was 2079, 898, 2509 cm−1, respectively. Meanwhile, the value of the Dq/B is about 2.32, indicating the Mn4+ ions were in a strong field environment in the LLS host. In a strong octahedral filed environment (surrounded by six oxygen atoms), as shown in Fig. 6(a), the original degenerate 3d orbitals of free Mn4+ ions, which are dx2 − dy2, dz2, dxy, dyz, and dxz, spilt into two degenerate and three degenerate. The energy of the two degenerate consisting of dx2 − dy2 and dz2, is higher than that of the three degenerate consisting of dxy, dyz, and dxz.13 Fig. 6(b) also gives the simple schematic diagram of Mn4+ ions energy level in strong octahedral filed environment. The possible transitions between different levels can be expressed as the following process. Under the excitation of 338 nm or 481 nm, the electrons on the ground state 4A2g were excited to the excited levels, and then relaxed the lowest excited level 2Eg. Finally, the far-red light peaking at 712 nm was emitted with the electrons on the 2Eg level return to the 4A2g level.
 | ||
| Fig. 6 (a) The simple schematic diagram of the d-orbital splitting in octahedral crystal field with octahedral structure of [(Sb,Mn)O6]. (b) A simple schematic diagram of Mn4+ ions energy level. | ||
A prototype far-red emitting LED device was fabricated by coating the as-prepared LLS:0.3%Mn4+,1.6%Mg2+ phosphors on a 365 nm near-UV LED chip, and Fig. 7 displays the corresponding electroluminescence (EL) spectrum of the prototype LED device under a bias current of 300 mA. An intense far-red emission band in the wavelength rang of 650–780 nm (2Eg → 4A2g transition) was observed and the far-red light around the device could be seen clearly by comparing the inset (i) and (ii) in Fig. 7. All the results indicate the LLS:0.3%Mn4+,1.6%Mg2+ phosphors have a promising prospect in the plant lighting field.
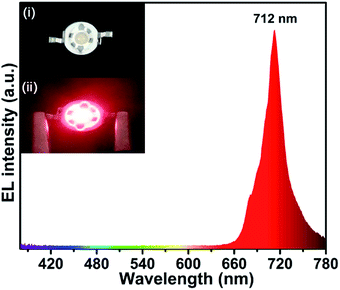 | ||
| Fig. 7 The EL spectrum of the as-prepared far-red-emitting LED device. Insets show the digital photographs of (i) the fabricated LED device and (ii) the working device under 300 mA driven. | ||
Conclusions
In conclusion, double perovskite LLS:Mn4+,Mg2+ far-red emitting phosphors with high IQE and excellent thermal stability were synthesized by traditional solid-state reaction method. The optimal doping concentration of Mn4+ and Mg2+ ions in LLS:Mn4+,Mg2+ phosphors were 0.3% and 1.6%, respectively. Under the excitation of 338 nm, the LLS:0.3%Mn4+,1.6%Mg2+ phosphors showed an intense far-red-emitting band peaking at 712 nm and the emission intensity at 423 K remained 58% of its initial value at 303 K. By doping Mg2+ ions in LLS:0.3%Mn4+ phosphors, the luminescence intensity of Mn4+ ions was enhanced by 2.5-fold and the corresponding IQE was also improved from 61% to 92%. Remarkably, the emission spectrum of the LLS:0.3%Mn4+,1.6%Mg2+ phosphors could match well with the absorption spectrum of the phytochrome PFR. All the outstanding properties of the double perovskite LLS:Mn4+,Mg2+ phosphors make it be a promising far-red-emitting phosphor for applications in plant growth LEDs.Conflicts of interest
There are no conflicts to declare.Acknowledgements
This work was supported by the National Natural Science Foundation of China (No. 51502190), the Program for the Outstanding Innovative Teams of Higher Learning Institutions of Shanxi, and the Open Fund of the State Key Laboratory of Luminescent Materials and Devices (South China University of Technology, No. 2017-skllmd-01)Notes and references
- N. Yeh and J.-P. Chung, Renewable Sustainable Energy Rev., 2009, 13, 2175–2180 CrossRef.
- X. Huang, J. Alloys Compd., 2017, 690, 356–359 CrossRef.
- P. Du, X. Huang and J. S. Yu, Chem. Eng. J., 2018, 337, 91–100 CrossRef.
- C. C. Lin, A. Meijerink and R. S. Liu, J. Phys. Chem. Lett., 2016, 7, 495–503 CrossRef PubMed.
- D. Wu, W. Xiao, L. Zhang, X. Zhang, Z. Hao, G.-H. Pan, Y. Luo and J. Zhang, J. Mater. Chem. C, 2017, 5, 11910–11919 RSC.
- K. Li, H. Lian, Y. Han, M. Shang, R. Van Deun and J. Lin, Dyes Pigm., 2017, 139, 701–707 CrossRef.
- B. Li and X. Huang, Ceram. Int., 2018, 44, 4915–4923 CrossRef.
- R. Cao, Z. Shi, G. Quan, Z. Luo, P. Tang, H. Ao and X. Yu, Opt. Mater., 2016, 57, 212–216 CrossRef.
- J. Long, X. Yuan, C. Ma, M. Du, X. Ma, Z. Wen, R. Ma, Y. Wang and Y. Cao, RSC Adv., 2018, 8, 1469–1476 RSC.
- T. Nakajima and T. Tsuchiya, ACS Appl. Mater. Interfaces, 2015, 7, 21398–21407 CrossRef PubMed.
- G. D. Massa, HortScience, 2008, 43, 1951–1956 Search PubMed.
- H. Smith, Nature, 2000, 407, 585–591 CrossRef PubMed.
- Z. Zhou, J. Zheng, R. Shi, N. Zhang, J. Chen, R. Zhang, H. Suo, E. M. Goldys and C. Guo, ACS Appl. Mater. Interfaces, 2017, 9, 6177–6185 CrossRef PubMed.
- J. Chen, N. Zhang, C. Guo, F. Pan, X. Zhou, H. Suo, X. Zhao and E. M. Goldys, ACS Appl. Mater. Interfaces, 2016, 8, 20856–20864 CrossRef PubMed.
- X. Huang, S. Wang, B. Li, Q. Sun and H. Guo, Opt. Lett., 2018, 43, 1307–1310 CrossRef PubMed.
- X. Huang, Nat. Photonics, 2014, 8, 748–749 CrossRef.
- P. Du, X. Huang and J. S. Yu, Inorg. Chem. Front., 2017, 4, 1987–1995 RSC.
- B. Li, X. Huang, H. Guo and Y. Zeng, Dyes Pigm., 2018, 150, 67–72 CrossRef.
- P. Du, L. Luo, X. Huang and J. S. Yu, J. Colloid Interface Sci., 2018, 514, 172–181 CrossRef PubMed.
- X. Huang, B. Li and H. Guo, J. Alloys Compd., 2017, 695, 2773–2780 CrossRef.
- X. Huang, H. Guo and B. Li, J. Alloys Compd., 2017, 720, 29–38 CrossRef.
- T. Senden, E. J. van Harten and A. Meijerink, J. Lumin., 2018, 194, 131–138 CrossRef.
- T. Sasaki, J. Fukushima, Y. Hayashi and H. Takizawa, J. Lumin., 2018, 194, 446–451 CrossRef.
- K. Li, H. Lian and R. V. Deun, J. Lumin., 2018, 198, 155–162 CrossRef.
- G. Zhu, Z. Li, C. Wang, F. Zhou, Y. Shi, Y. Wen and S. Xin, J. Mater. Sci.: Mater. Electron., 2017, 29, 2216–2221 CrossRef.
- T. Murata, T. Tanoue, M. Iwasaki, K. Morinaga and T. Hase, J. Lumin., 2005, 114, 207–212 CrossRef.
- X. Huang and H. Guo, Dyes Pigm., 2018, 154, 82–86 CrossRef.
- R. Cao, Z. Shi, G. Quan, T. Chen, S. Guo, Z. Hu and P. Liu, J. Lumin., 2017, 188, 577–581 CrossRef.
- Q. Sun, S. Wang, B. Li, H. Guo and X. Huang, J. Lumin., 2018, 203, 371–375 CrossRef.
- X. Huang, J. Liang, B. Li, L. Sun and J. Lin, Opt. Lett., 2018, 43, 3305–3308 CrossRef PubMed.
- M. G. Brik and A. M. Srivastava, ECS J. Solid State Sci. Technol., 2013, 2, R148–R152 CrossRef.
- X. Zhang, J. Nie, S. Liu, Y. Li and J. Qiu, J. Am. Ceram. Soc., 2017, 00, 1–9 Search PubMed.
- S. Wang, Q. Sun, B. Devakumar, L. Sun, J. Liang and X. Huang, RSC Adv., 2018, 8, 30191–30200 RSC.
- K. Sankarasubramanian, B. Devakumar, G. Annadurai, L. Sun, Y.-J. Zeng and X. Huang, RSC Adv., 2018, 8, 30223–30229 RSC.
- Y. Li, S. Qi, P. Li and Z. Wang, RSC Adv., 2017, 7, 38318–38334 RSC.
- J. Liang, L. Sun, B. Devakumar, S. Wang, Q. Sun, H. Guo, B. Li and X. Huang, RSC Adv., 2018, 8, 27144–27151 RSC.
- Q. Sun, S. Wang, B. Devakumar, B. Li, L. Sun, L. Jia and H. Xiaoyong, RSC Adv., 2018, 8, 28538–28545 RSC.
- M. L. López, M. L. Veiga, J. Rodríguez-Carvajal, F. Fernández, A. Jerez and C. Pico, Mater. Res. Bull., 1992, 27, 647–654 CrossRef.
- C. Yang, Z. Zhang, G. Hu, R. Cao, X. Liang and W. Xiang, J. Alloys Compd., 2017, 694, 1201–1208 CrossRef.
- J. Zhong, S. Zhou, D. Chen, J. Li, Y. Zhu, X. Li, L. Chen and Z. Ji, Dalton Trans., 2018, 47, 8248 RSC.
- J. Zhong, D. Chen, X. Chen, K. Wang, X. Li, Y. Zhu and Z. Ji, Dalton Trans., 2018, 47, 6528–6537 RSC.
- K. Li, H. Lian, M. Shang and J. Lin, Dalton Trans., 2015, 44, 20542–20550 RSC.
- C. Yue, W. Wang, Q. Wang and Y. Jin, J. Alloys Compd., 2016, 683, 575–578 CrossRef.
- S. G. Prasanna Kumar, R. Hari Krishna, N. Kottam, P. Krishna Murthy, C. Manjunatha, R. Preetham, C. Shivakumara and T. Thomas, Dyes Pigm., 2018, 150, 306–314 CrossRef.
- M. H. Du, J. Mater. Chem. C, 2014, 2, 2475–2481 RSC.
- Z. Lu, H. Wang, D. Yu, T. Huang, L. Wen, M. Huang, L. Zhou and Q. Wang, Opt. Laser Technol., 2018, 108, 116–123 CrossRef.
- Z. Lu, T. Huang, R. Deng, H. Wang, L. Wen, M. Huang, L. Zhou and C. Yao, Superlattices Microstruct., 2018, 117, 476–487 CrossRef.
- H. Guo, X. Huang and Y. Zeng, J. Alloys Compd., 2018, 741, 300–306 CrossRef.
- S. Zhang, Y. Hu, H. Duan, Y. Fu and M. He, J. Alloys Compd., 2017, 693, 315–325 CrossRef.
- K. Li, H. Lian and R. Van Deun, Dalton Trans., 2018, 47, 2501–2505 RSC.
- L. Jing, X. Liu and Y. Li, J. Lumin., 2015, 158, 351–355 CrossRef.
- A. Fu, L. Zhou, S. Wang and Y. Li, Dyes Pigm., 2018, 148, 9–15 CrossRef.
- B. Ma and B. Liu, J. Lumin., 2017, 188, 54–59 CrossRef.
- X. Wu, Y. Jiao, O. Hai, Q. Ren, F. Lin and H. Li, J. Alloys Compd., 2018, 730, 521–527 CrossRef.
- A. Guan, P. Chen, L. Zhou, G. Wang, X. Zhang and J. Tang, Spectrochim. Acta, Part A, 2017, 173, 53–58 CrossRef PubMed.
- P. Ma, Y. Song, B. Yuan, Y. Sheng, C. Xu, H. Zou and K. Zheng, Ceram. Int., 2017, 43, 60–70 CrossRef.
- L. Wang, L. Yuan, Y. Xu, R. Zhou, B. Qu, N. Ding, M. Shi, B. Zhang, Y. Chen, Y. Jiang, D. Wang and J. Shi, Appl. Phys. A, 2014, 117, 1777–1783 CrossRef.
- C. Wu, J. Li, H. Xu, J. Wu, J. Zhang, Z. Ci, L. Feng, C. Cao, Z. Zhang and Y. Wang, J. Alloys Compd., 2015, 646, 734–740 CrossRef.
- L. Y. Wang, E. H. Song, T. T. Deng, Y. Y. Zhou, Z. F. Liao, W. R. Zhao, B. Zhou and Q. Y. Zhang, Dalton Trans., 2017, 46, 9925–9933 RSC.
- R. Cao, Y. Ye, Q. Peng, G. Zheng, H. Ao, J. Fu, Y. Guo and B. Guo, Dyes Pigm., 2017, 146, 14–19 CrossRef.
- X. Huang and H. Guo, Dyes Pigm., 2018, 152, 36–42 CrossRef.
- H. Chen, H. Lin, Q. Huang, F. Huang, J. Xu, B. Wang, Z. Lin, J. Zhou and Y. Wang, J. Mater. Chem. C, 2016, 4, 2374–2381 RSC.
- U. B. Humayoun, S. N. Tiruneh and D.-H. Yoon, Dyes Pigm., 2018, 152, 127–130 CrossRef.
- G. Jiang, B. Yang, G. Zhao, Y. Liu, J. Zou, H. Sun, H. Ou, Y. Fang and J. Hou, Opt. Mater., 2018, 83, 93–98 CrossRef.
- X. Huang, B. Li, H. Guo and D. Chen, Dyes Pigm., 2017, 143, 86–94 CrossRef.
- Q. Peng, R. Cao, Y. Ye, S. Guo, Z. Hu, T. Chen and G. Zheng, J. Alloys Compd., 2017, 725, 139–144 CrossRef.
- S. Zhang and Y. Hu, J. Lumin., 2016, 177, 394–401 CrossRef.
- L. Qin, S. Bi, P. Cai, C. Chen, J. Wang, S. I. Kim, Y. Huang and H. J. Seo, J. Alloys Compd., 2018, 755, 61–66 CrossRef.
- R. Cao, X. Liu, K. Bai, T. Chen, S. Guo, Z. Hu, F. Xiao and Z. Luo, J. Lumin., 2018, 197, 169–174 CrossRef.
- P. Cai, L. Qin, C. Chen, J. Wang, S. Bi, S. I. Kim, Y. Huang and H. J. Seo, Inorg. Chem., 2018, 57, 3073–3081 CrossRef PubMed.
| This journal is © The Royal Society of Chemistry 2018 |

