DOI:
10.1039/C8RA06430J
(Paper)
RSC Adv., 2018,
8, 39787-39796
Effect of different factors on the yield of epoxy-terminated polydimethylsiloxane and evaluation of CO2 thickening
Received
31st July 2018
, Accepted 13th November 2018
First published on 29th November 2018
Abstract
We focused on optimizing synthetic parameters based on a Taguchi design to maximize polymer yield and evaluate the polymer-thickening ability in CO2. The stirring speed, reaction temperature, catalyst content, and reaction time were the major control parameters (independent variables) in these two individual reactions. The signal-to-noise ratio (S/N ratio) obtained under each experimental condition was utilized to evaluate the optimum preparation process for the maximum yield. A maximum yield of 87.20% in a ring-opening polymerization was reported, and the optimum conditions were 70 °C, 2.0 g of sulfuric acid, and stirring speed of 110 rpm. Temperature, however, was the most effective factor. Similarly, research of hydrosilylation obtained a maximum yield of 84.7% under optimum conditions of 100 °C, chloroplatinic acid of 0.003 wt%, and stirring speed of 190 rpm. Also, we measured CO2 viscosity based on different concentrations of thickener at different temperatures, pressures and flow rates. Epoxy-terminated polydimethylsiloxane could be used for CO2 fracturing to obtain excellent fracturing.
1. Introduction
As an important method to enhance crude-oil production, several shortcomings have hindered the application of hydraulic fracturing.1 By contrast, CO2 fracturing technology can be used to form fractures in reservoirs based on advantages such as a fewer environmental hazards and greater fracturing efficiency.2–4 However, the lower proppant-carrying property, caused by low CO2 viscosity, is considered the biggest challenge to application of CO2 in fracturing technology.1,5 To improve CO2 viscosity, a thickener with an excellent thickening property should be added to liquid CO2.
Fluoropolymers and hydrocarbon polymers6,7 are considered excellent thickeners to improve the CO2 viscosity. However, many defects have been revealed during CO2 fracturing.8 As a result, several scholars have reported that silicone can thicken liquid CO2.5,9,10 Nonetheless, it remains a principal challenge to increase the poor solubility and thickening capability in liquid CO2.11 To increase the thickening property of silicone in liquid CO2, researchers have employed chemical modification, polymer grafting and co-solvent assistance.11 Excessive addition of a co-solvent resulted in excellent solubility in CO2, but was deemed unwise and expensive. By contrast, chemical modification and polymer grafting is conducive to designing a silicone thickener with excellent solubility and thickening capability in liquid CO2.
In chemical modification, optimizing the preparation condition did not increase the product yield only, but also reduced the cost of CO2 fracturing significantly. For most chemical reactions, the stirring speed, temperature, time and catalyst content have a huge influence on the yield over the preparation process. In general, many experiments based on the factors stated above were conducted to discover the optimal preparation condition with a maximum yield. Meanwhile, more experiments were carried out involving increasing the number of independent variables. It was not only a tedious task to screen for an optimal process with maximum yield, but also a huge cost in each experiment. As an excellent optimized method, the experimental design of Taguchi and colleagues was utilized to obtain the optimal combination with a small number of experiments.12,13 Also, interactions between two variables could be modelled using orthogonal arrays (OAs).14 Moreover, the reduced sensitivity of the system to variation sources was shown in this optimized method.15
We wished to design and synthesize a modified epoxy-terminated polydimethylsiloxane, optimize the preparation condition of a polymer by the Taguchi design, and investigate the influence of selected parameters on the yield. In addition, the thickening property of epoxy-terminated polydimethylsiloxane in CO2 was measured and evaluated.
2. Experimental
2.1 Materials
All cyclosiloxanes and chain siloxanes were procured from Jiande City Sifco Materials (China). Ethanol, toluene and chloroplatinic acid were obtained from Nanjing Chemical Reagents (China). Moreover, sulfuric acid was purchased from Sinopharm Chemical Reagents (China). Tetramethyldisiloxane and glycidyl methacrylate were sampled as received without further purification. However, the polyacrylate polymer water-absorbing resin was added into ethanol (95%) with a mass ratio of 1![[thin space (1/6-em)]](https://www.rsc.org/images/entities/char_2009.gif) :4 for 150 min. A sieve (120 mesh) was used to separate the water-absorbing resin and obtain purified ethanol. For toluene purification, it was first passed through two adsorption columns packed with alumina and diatomaceous each, respectively, at 50 mL min−1. Toluene was then dried with a desiccant (potassium carbonate) at 60 mL min−1. The dried toluene was injected into a rectification tank at 120 °C to obtain toluene at 99.5% purity. To remove hexamethylcyclotrisiloxane in octamethylcyclotetrasiloxane, a distillation tower with 50 theoretical plates was employed at 0.03 MPa, and a distillation tower with 60 theoretical plates was used to obtain octamethylcyclotetrasiloxane at 99.9% purity.
:4 for 150 min. A sieve (120 mesh) was used to separate the water-absorbing resin and obtain purified ethanol. For toluene purification, it was first passed through two adsorption columns packed with alumina and diatomaceous each, respectively, at 50 mL min−1. Toluene was then dried with a desiccant (potassium carbonate) at 60 mL min−1. The dried toluene was injected into a rectification tank at 120 °C to obtain toluene at 99.5% purity. To remove hexamethylcyclotrisiloxane in octamethylcyclotetrasiloxane, a distillation tower with 50 theoretical plates was employed at 0.03 MPa, and a distillation tower with 60 theoretical plates was used to obtain octamethylcyclotetrasiloxane at 99.9% purity.
2.2 Preparation of epoxy-terminated polydimethylsiloxane
First, 60 g of octamethylcyclotetrasiloxane (D4) and 0.1 g of sulfuric acid were poured into a flask, and then 5 g of tetramethyldisiloxane was dripped into this flask for 10 min. The solution was stirred at constant temperature for >5 h. To obtain the pure primary product, 2 g of sodium carbonate was added to neutralize sulfuric acid, and filtering was conducted to clean up the sodium sulfate generated. Water was separated by stratification between the primary product and water, and the clear primary product was dried in a vacuum drying oven at 70 °C and at vacuum pressure of 0.9 kPa. After cooling to room temperature, the primary product was transferred to another flask, hydrosilylation was conducted by the addition of glycidyl methacrylate (GM) and chloroplatinic acid, and stirring was continued for >3 h. After completion of hydrosilylation, 2 g of activated carbon was added to remove chloroplatinic acid, and vacuum distillation employed to separate the remaining glycidyl methacrylate at 105 °C and at a vacuum pressure of 1.1 kPa. Molecular weight (Mn = 21000) of the final product was determined using an Ubbelohde viscometer, and 89.2% of silicone repeat units were obtained by titration (Fig. 1).
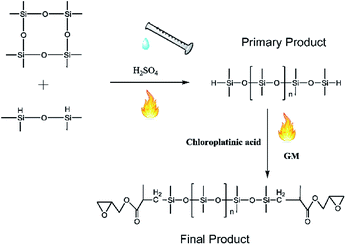 |
| | Fig. 1 Preparation of epoxy-terminated polydimethylsiloxane. | |
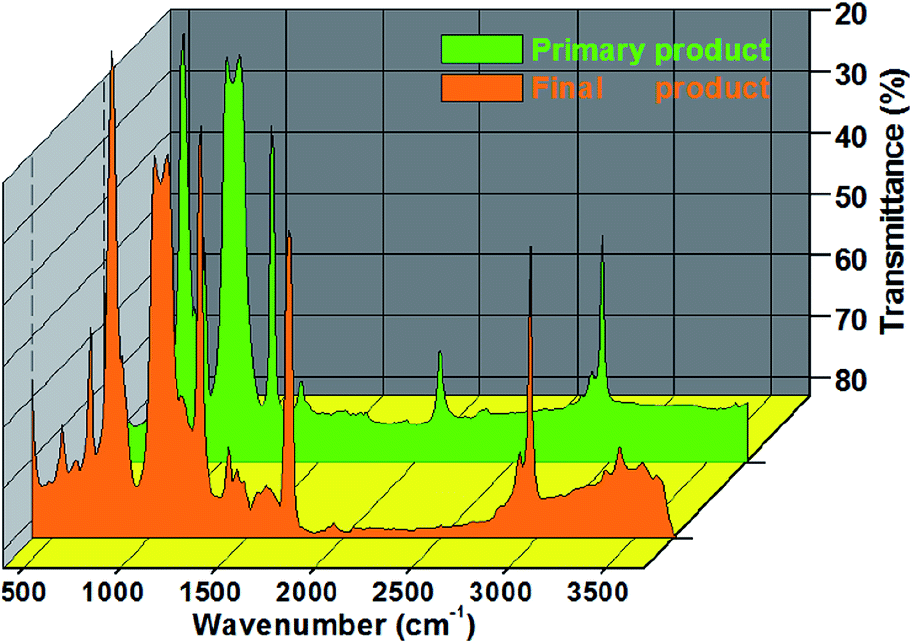
As shown in Fig. 2, the peak at 2963 cm−1 was viewed as the C–H stretching vibrations of CH3, stretching vibrations of Si–H were expressed at 2121 cm−1, and the sharp peak at 1416 cm−1 indicated the asymmetric vibration of Si–CH3. By contrast, the symmetrical vibration of CH3 was presented at 1264 cm−1, and the peaks observed at 1090 and 1021 cm−1 were attributed to the symmetrical stretching vibration of Si–O–Si.1 In addition, the telescopic vibration of Si–C was viewed at 800 cm−1.
 |
| | Fig. 2 FTIR spectrum of the product from these two reactions. | |
Epoxy-terminated polydimethylsiloxane (orange) presented prominent peaks at 2972, 1740, 1170, 1018, 1090, 1021 and 800 cm−1. The bending vibration at 1740 cm−1 showed the C![[double bond, length as m-dash]](https://www.rsc.org/images/entities/char_e001.gif) O bond on it. The strong adsorption bands at 1170 and 1018 cm−1 were the characteristic stretching vibrations of the C–O–C group and epoxy group, respectively.16 Meanwhile, the peak between 850 and 912 cm−1 was viewed as the epoxy-ring vibration band.16
O bond on it. The strong adsorption bands at 1170 and 1018 cm−1 were the characteristic stretching vibrations of the C–O–C group and epoxy group, respectively.16 Meanwhile, the peak between 850 and 912 cm−1 was viewed as the epoxy-ring vibration band.16
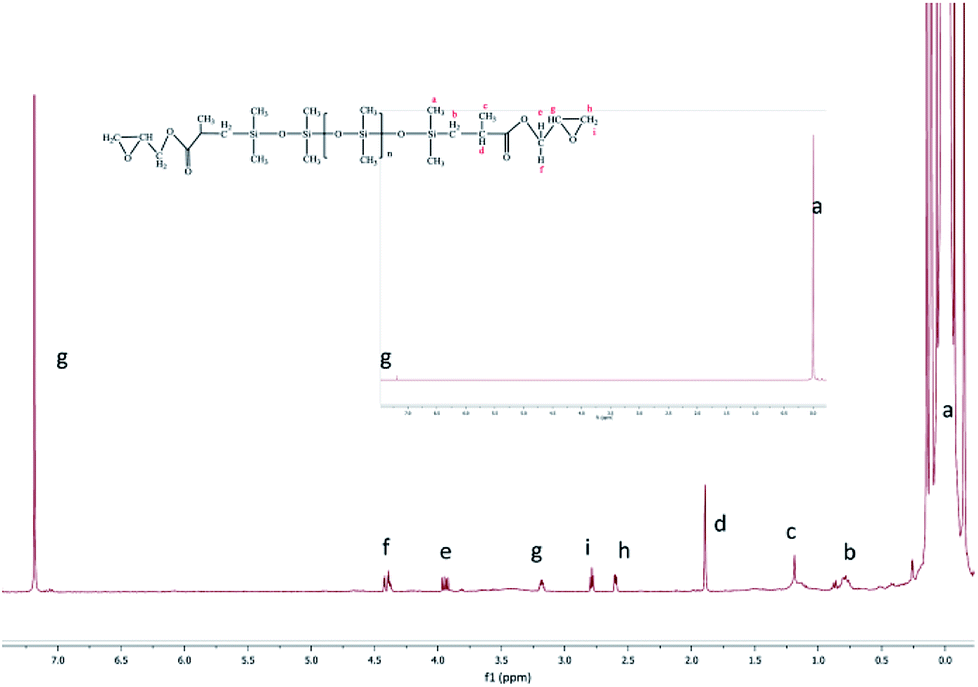
1H-NMR (CDCl3): δ 0.11 (m, 924H), 0.69 (m, 4H), 1.19 (m, 6H), 1.89 (s, 2H), 3.86 (m, 2H), 4.34 (d, 2H), 3.17 (s, 2H), 2.54 (s, 2H), 2.79 (s, 2H), 7.39 (s, CDCl3).
The epoxy-terminated polydimethylsiloxane was characterized by the weak peaks of the epoxy group at 2.54 (h), 2.79 (i) and 3.17 ppm (g)17 (Fig. 3). Furthermore, the H (a) of the methyl group connected to a Si appeared at 0.11 ppm (δ). The peak at 0.69 ppm was ascribed to the methylene H (b). The chemical shift of Si–H at 4.5–5.0 ppm and that of H in the CC bond at 5.0–5.8 ppm were discovered separately. These chemical shifts showed a complete ring-opening polymerization and hydrosilylation. All these results demonstrated that the epoxy group was introduced quantitatively to the final product as designed.
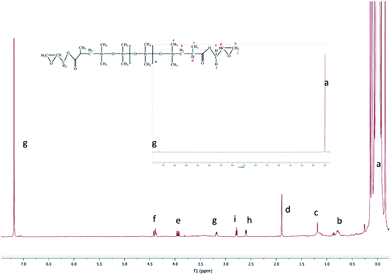 |
| | Fig. 3 1H-NMR (CDCl3) of the final product. | |
2.3 Taguchi design
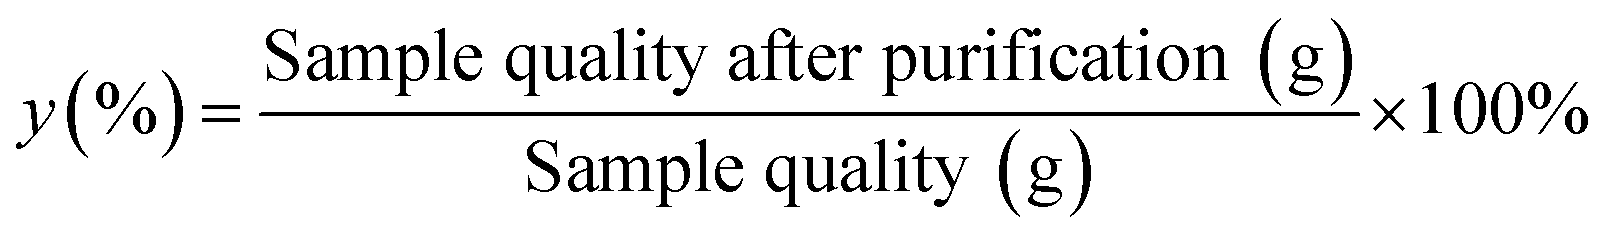
To find the optimal combination with a maximum yield, many experiments should be carried out. It was necessary to find an effective optimization method which could evaluate interactive factors to obtain the optimal prepared condition with the maximum yield. The yield was expressed as:| |
 | (1) |
where y was the yield (%).
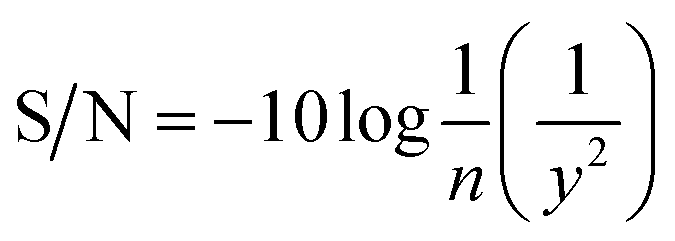
The Taguchi experimental design is used to optimize parameters and investigate their influence on the yield.18,19 The evaluated target (yield) was first used to assess the suitability of each combination. Based on the yield, the factors with a significant influence on the yield were screened and the parameter range determined. Then, the orthogonal array design was used to obtain a specific combination, and a yield would be formed in each combination.20 Then, a signal-to-noise (S/N) ratio (eqn (2)),21 converted from each observed yield at the orthogonal array design, was employed to evaluate the effect of each factor on the yield so as to determine the optimal combination with a maximum yield.
| |
 | (2) |
where
y is the observed yield and
n is the number of experiments.
2.4 Viscosity-measuring device
A modified capillary viscometer (Fig. 4), designed based on the Hagen–Poiseuille law, was divided into a pressurized system, dissolution system and viscosity-measurement system. To remove water in CO2, a desiccator was installed behind the CO2 cylinder, and a compression pump used to pressurize CO2 into a pressure-resistant container. The pressurized CO2 in the container was injected into the dissolution equipment after the thickener and toluene had been added into the container. The pressure was adjusted slightly by an ISCO pump and a water bath was used to control the temperature of the dissolving device. A window embedded in the dissolving device was utilized to observe the solubility and phase behaviour of the thickened liquid CO2 at different temperatures and pressures.
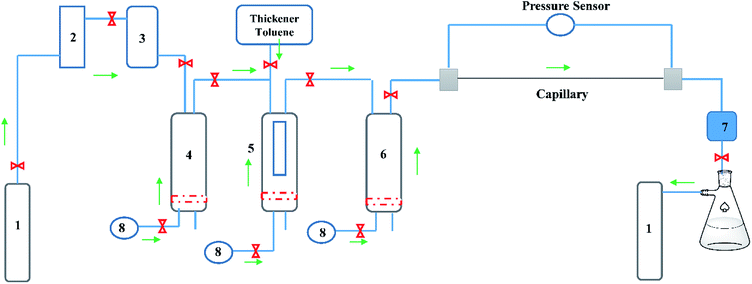 |
| | Fig. 4 Capillary viscometers (schematic). (1) CO2 cylinder. (2) Desiccator. (3) Compression pump. (4) Pressure-resistant gas cylinder. (5) Dissolution-measuring device. (6) Fracturing fluid-storage device. (7) Pressure-control device. (8) ISCO pump. | |
After mixing for 30 min, layering was seen. By contrast, a uniformly transparent liquid CO2 was injected into the container and a viscosity measurement conducted. The liquid CO2 in the capillary possessed a certain flow (Q), temperature and pressure. The pressure sensor at both ends of the capillary could record differential pressure (ΔP), and each ΔP was converted to fluid viscosity.22 In the present study, the capillary radius was 0.002 m, and capillary length was 5 m.
2.5 Mechanism of viscosity measurement
For this capillary viscometer, the relationship between the viscosity and ΔP is represented by the Hagen–Poiseuille law, but the latter is suitable for a laminar fluid.22
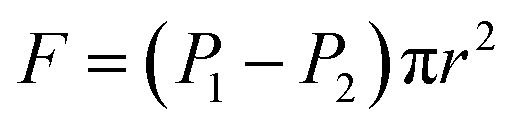
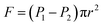
As seen in Fig. 5, a cylindrical fluid with a radius r was considered as an object to explore the mechanism of viscosity measurement. The force F formed by the pressure difference (ΔP) is shown in eqn (3):
| |
 | (3) |
where
F is the advancing force,
N;
P1 and
P2 present the pressure difference (Δ
P) at the ends of the capillary in MPa.
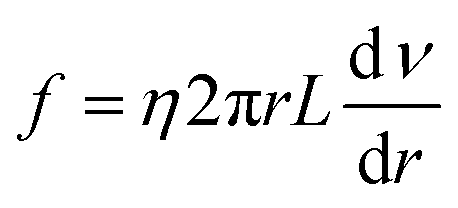
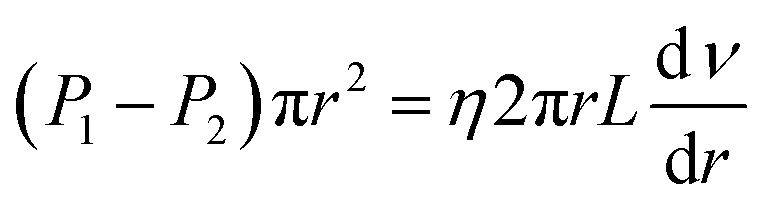
Eqn (4) shows the viscous force exerted by other fluids on this cylindrical fluid, and an opposite direction is displayed between
F and
f.
| |
 | (4) |
where
f is the resistance in
N,
η is the fluid viscosity in mPa s,
ν is the flow rate in m s
−1, and
L is the capillary length in
m. An equal state was shown between
eqn (3) and
(4) due to the steady flow of this fluid, and then the comprehensive equation is presented by
eqn (5).
| |
 | (5) |
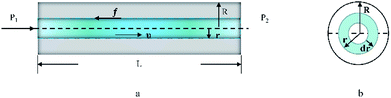 |
| | Fig. 5 (a) Flow for a laminar fluid in the capillary (along the direction of the capillary) (schematic). (b) Sectional flow for a laminar fluid in the capillary (along the flow direction of the fluid). | |
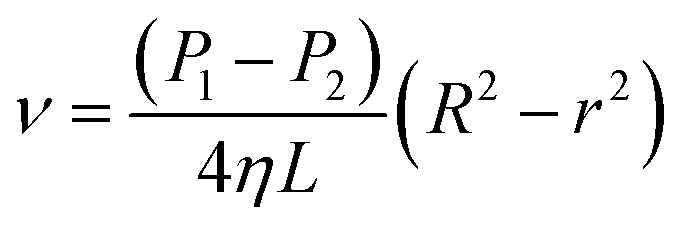
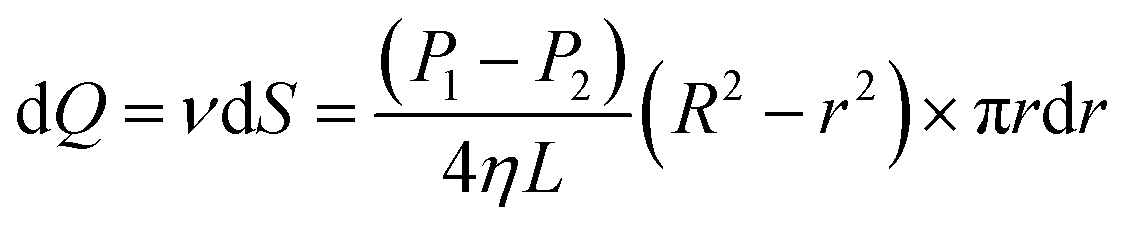
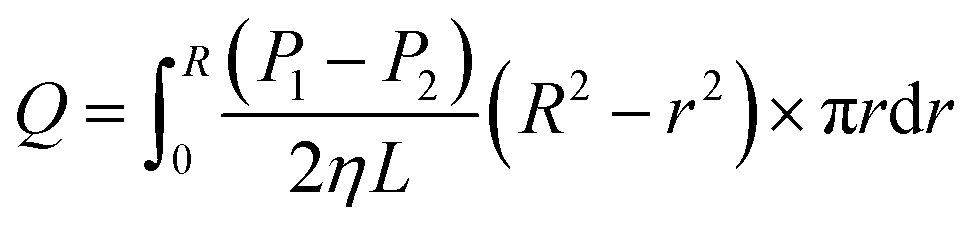
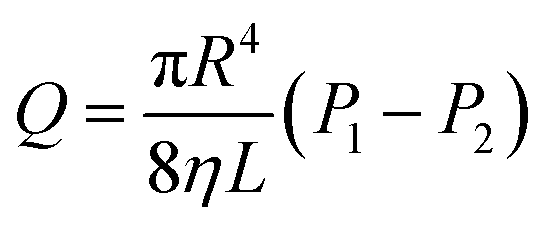
Eqn (6) shows an integral equation of eqn (5).
| |
 | (6) |
| |
 | (7) |
| |
 | (8) |
| |
 | (9) |
where
Q is the flow rate in mL min
−1. As shown in
Fig. 5b, the liquid flow ring with a radius of
r and width of d
r is shown in
eqn (9) at the premise of laminar flow. The basic equation of apparent viscosity could be obtained by a variant of
eqn (9).
The thickening performance of epoxy-terminated polydimethylsiloxane in liquid CO2 was measured at different conditions. Moreover, because the calculation of the viscosity does not involve the shear rate, the flow rate (Q) was used to calculate the viscosity, thus the shear rate was not discussed.
3. Results and discussion
3.1 Single-factor investigation for ring-opening polymerization
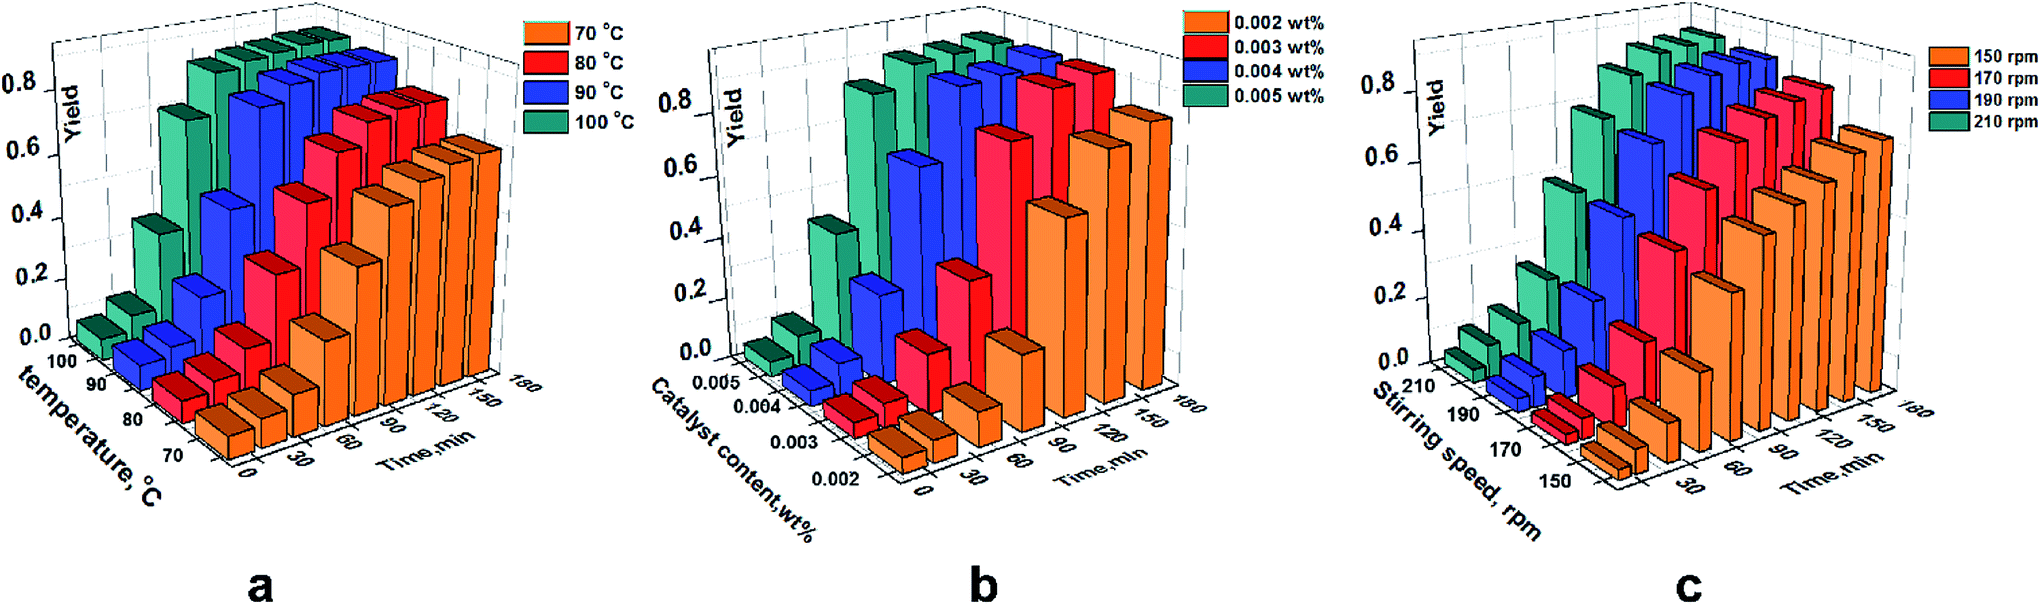
As an important method to optimize preparation conditions, single-factor investigation also provided a range for each factor. Temperature, amount of sulfuric acid, reaction time and stirring speed were considered to be the most important factors in the ring-opening polymerization.
Fig. 6a shows a rising yield with increasing temperature from 30 °C to 70 °C. A stable maximum yield was displayed at each temperature between 30 °C and 70 °C due to an adequate reaction time and catalyst at each temperature. Meanwhile, an increasing yield was observed with increasing temperature from 30 °C to 70 °C, and a gradually decreasing growth rate of yield was shown with an increase in temperature. As seen in the yield at 70 °C, the ring-opening polymerization occurred mainly between 2 h and 4 h, and a high yield was displayed. However, a low yield and long-time range was illustrated at 30 °C. The Taguchi experimental design could be used from 30 °C to 70 °C.
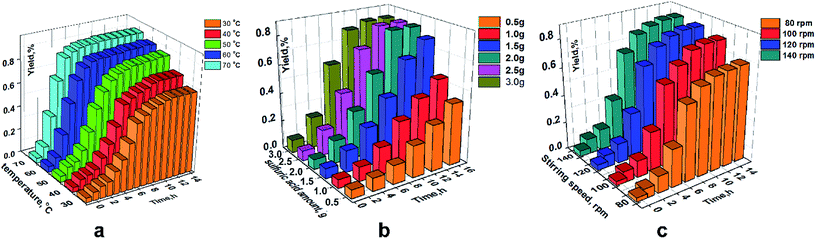 |
| | Fig. 6 The effect factors have individually on the yield (ring-opening polymerization). (a) Amount of sulfuric acid is 2.0 g and a stirring speed is 120 rpm. (b) At a temperature of 70 °C and a stirring speed of 120 rpm. (c) At a temperature of 70 °C and sulfuric acid of 2.0 g. | |
As shown in Fig. 6b, there was no maximum yield when the amount of sulfuric acid was <2 g because sulfuric acid could not cause a sufficient reaction with the other raw materials. By contrast, there was a maximum yield when sulfuric acid was >2 g and was attributed to sufficient catalysis between sulfuric acid and raw materials. However, the yield showed no disparity for each stirring speed shown in Fig. 6c.
3.2 Single-factor investigation for hydrosilylation
A similar trend was shown in the single-factor investigation of hydrosilylation. However, there were obviously different value ranges for these influencing factors between ring-opening polymerization and hydrosilylation. Detailed values of these factors and the effect on the yield are illustrated in Fig. 7.
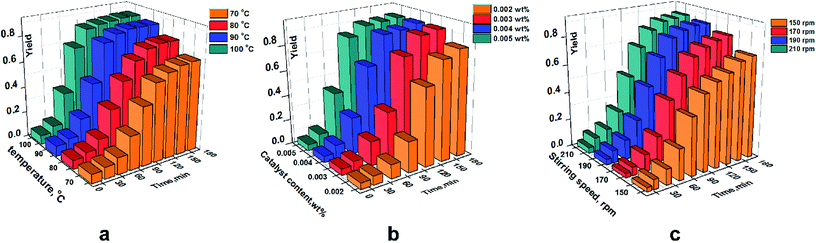 |
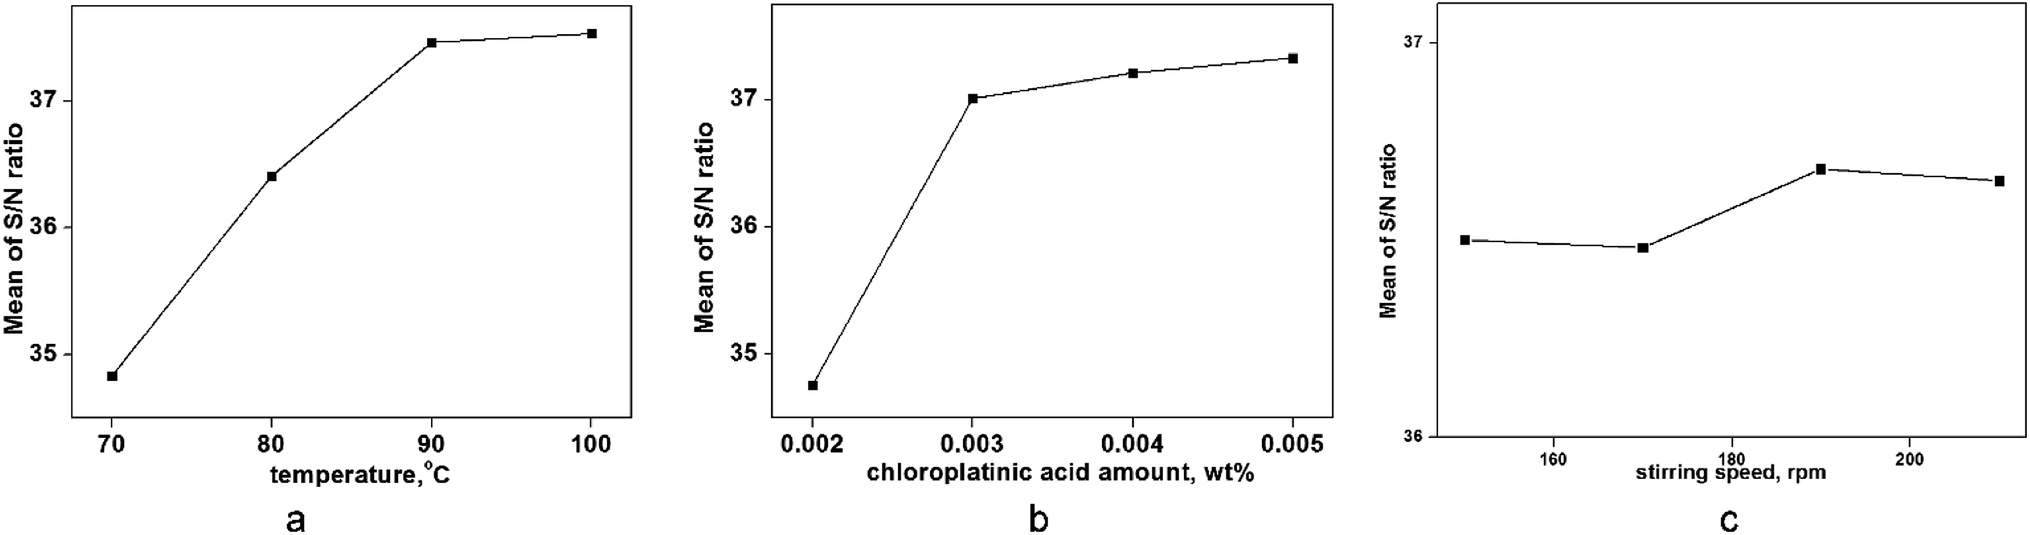
| | Fig. 7 Effect of individual factors on the yield (hydrosilylation). (a) At chloroplatinic acid of 0.004 wt% and stirring speed of 190 rpm. (b) At 90 °C and stirring speed of 190 rpm. (c) at 90 °C and chloroplatinic acid of 0.004 wt%. | |
As shown in Fig. 7a, the maximum yield increased gradually when the temperature increased. However, there was no change in the maximum yield after 90 °C. To note the effect of chloroplatinic acid on the yield, a similar trend was revealed. The yield at chloroplatinic acid of 0.004 wt% was almost equal to the maximum yield at 0.005 wt%. Moreover, the yield at 150 rpm was significantly lower than the yield at other speeds (≥170 rpm) (Fig. 7c).
3.3 Optimization of ring-opening polymerization
Table 1 shows that three factors in four levels were chosen to evaluate the best combination with the maximum yield of the ring-opening polymerization. Analysis of variance (ANOVA) was used to study the effect of these factors on the yield and the best combination (Table 2).
Table 1 Parameters and levels for ring-opening polymerization
| Influencing factor |
Level 1 |
Level 2 |
Level 3 |
Level 4 |
| A: temperature (°C) |
60 |
70 |
80 |
90 |
| B: sulfuric acid amount (g) |
0.5 |
1.0 |
1.5 |
2.0 |
| C: stirring speed (rpm) |
70 |
90 |
110 |
130 |
Table 2 Parameters and levels for hydrosilylation
| Influencing factor |
Level 1 |
Level 2 |
Level 3 |
Level 4 |
| D: temperature (°C) |
70 |
80 |
90 |
100 |
| E: chloroplatinic acid amount (wt%) |
0.002 |
0.003 |
0.004 |
0.005 |
| F: stirring speed (rpm) |
150 |
170 |
190 |
210 |
A plan with 16 experiments, designed based on the orthogonal array, was carried out in a random sequence.23 Table 3 shows the detailed experimental design and results. A discerning analysis and analysis of variance (Table 5) were undertaken to obtain the optimized prepared process with the highest yield.
Table 3 Experimental design of ring-opening polymerization
| Strain |
A, °C |
B, g |
C, rpm |
Yield, % |
S/N |
| 1 |
40 |
0.5 |
70 |
27 |
28.63 |
| 2 |
40 |
1.0 |
90 |
33 |
30.37 |
| 3 |
40 |
1.5 |
110 |
42 |
32.46 |
| 4 |
40 |
2.0 |
130 |
49 |
33.80 |
| 5 |
50 |
0.5 |
90 |
37 |
31.36 |
| 6 |
50 |
1.0 |
70 |
43 |
32.67 |
| 7 |
50 |
1.5 |
130 |
55 |
34.81 |
| 8 |
50 |
2.0 |
110 |
66 |
36.39 |
| 9 |
60 |
0.5 |
110 |
49 |
33.80 |
| 10 |
60 |
1.0 |
130 |
53 |
34.49 |
| 11 |
60 |
1.5 |
70 |
62 |
35.85 |
| 12 |
60 |
2.0 |
90 |
72 |
37.16 |
| 13 |
70 |
0.5 |
130 |
50 |
33.98 |
| 14 |
70 |
1.0 |
110 |
65 |
36.26 |
| 15 |
70 |
1.5 |
90 |
81 |
38.16 |
| 16 |
70 |
2.0 |
70 |
83 |
38.38 |
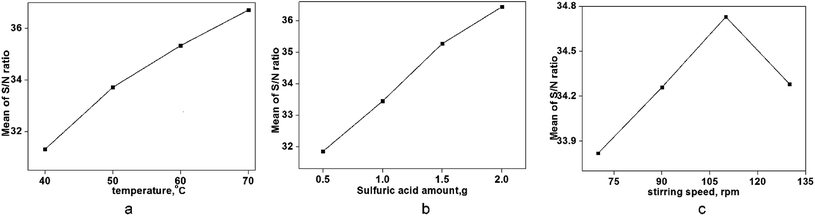
In this design method, the largest S/N ratio denoted the best level. Fig. 8 shows that there was a different dependence between control factors and the S/N ratio with experimental data. Compared with the stirring speed, the yield showed greater dependence on the amount of sulfuric acid and temperature. The stirring speed had little effect on the product yield, and there was a highly similar and large effect on the yield of ring-opening polymerization between temperature and sulfuric acid. However, a very clear comparison for each influencing factor on the yield could not be reflected perfectly. A comparison of the degree of influence of each factor can be reflected by the contribution ratio, and the dependence of each factor on the yield of this ring-opening polymerization could be presented in detail.
 |
| | Fig. 8 Trend of factors on the S/N ratio (ring-opening polymerization). | |
Correlation calculations of ANOVA were done to evaluate the results of the experimental design. As shown in Table 5, the dependence of the above factors had a significant effect on the yield. According to the contribution ratio, an order of A > B > C could be determined. Temperature was the biggest factor that could affect the yield, with contribution ratio of 55.44%. By contrast, the contribution ratio of 0.97% of stirring speed displayed the smallest effect on the yield.
In general, a higher S/N ratio denotes an optimal level of the influencing factor.24,25 According to the contribution ratio and data in Fig. 8, the order of A4B4C3 (i.e., temperature of 70 °C, sulfuric acid of 2.0 g, and a stirring speed of 110 rpm, respectively) was seen as the optimal combination of factors with respect to the yield. A yield of 87.2% was shown in a realistic experiment using this optimal combination. A higher yield was shown by increasing the temperature due to more intermolecular collisions at a higher temperature, and the same reason explained the effect of sulfuric acid on the yield.26 As the catalyst amount increases, more D4 molecules can interact with catalyst molecules.27,28 However, a distinct trend was shown in Fig. 8c; the main reason was that a low stirring speed (<110 rpm) could provide sufficient time to generate interactions between D4 and the catalyst.
3.4 Taguchi design for hydrosilylation
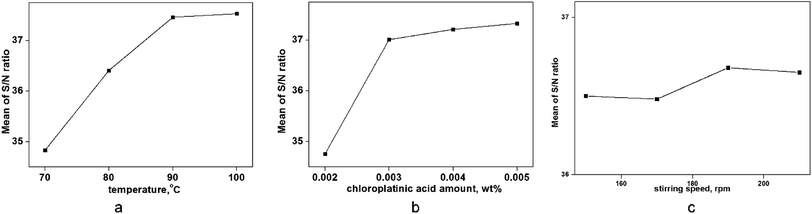
To evaluate the best combination for a maximum yield of hydrosilylation, an experiment using the Taguchi design (shown in Table 4) and the range of each factor was selected according to single-factor analyses. The ANOVA calculation was conducted using the S/N ratios given in Table 6, and the combination of these factors that were significant for the yield obtained. According to the contribution ratios given in Table 6, the experimental factors that had a major impact were (in descending order) were temperature (D), amount of chloroplatinic acid (E) and stirring speed (F). As seen in Fig. 9 and Table 4, the optimum combination for the maximum yield in hydrosilylation was D4E2F3 (temperature of 100 °C, amount of chloroplatinic acid of 0.003 wt%, and a stirring speed of 190 rpm). A yield of 84.7% was observed in an actual experiment at this combination.
Table 4 Experimental design of hydrosilylation
| Strain |
A, °C |
B, wt% |
C, rpm |
Yield, % |
S/N |
| 1 |
70 |
0.002 |
150 |
46 |
33.26 |
| 2 |
70 |
0.003 |
170 |
56 |
34.96 |
| 3 |
70 |
0.004 |
190 |
59 |
35.41 |
| 4 |
70 |
0.005 |
210 |
67 |
36.52 |
| 5 |
80 |
0.002 |
170 |
54 |
34.65 |
| 6 |
80 |
0.003 |
150 |
68 |
36.65 |
| 7 |
80 |
0.004 |
210 |
73 |
37.27 |
| 8 |
80 |
0.005 |
190 |
72 |
37.15 |
| 9 |
90 |
0.002 |
190 |
60 |
35.56 |
| 10 |
90 |
0.003 |
210 |
78 |
37.84 |
| 11 |
90 |
0.004 |
150 |
80 |
38.06 |
| 12 |
90 |
0.005 |
170 |
82 |
38.28 |
| 13 |
100 |
0.002 |
210 |
64 |
36.12 |
| 14 |
100 |
0.003 |
190 |
85 |
38.59 |
| 15 |
100 |
0.004 |
170 |
80 |
38.06 |
| 16 |
100 |
0.005 |
150 |
81 |
38.17 |
Table 5 Analysis of variance of factors on the yield of ring-opening polymerization
| Project |
Sum of square, SS |
Degree of freedom, f |
Mean square, MS |
F value |
Contribution ratio, % |
| A |
64.56 |
3 |
21.52 |
119.55 |
55.44 |
| B |
48.76 |
3 |
16.25 |
90.28 |
41.74 |
| C |
1.64 |
3 |
0.55 |
3.06 |
0.97 |
| Error |
0.53 |
3 |
0.18 |
|
2.26 |
Table 6 Analysis of variance of factors on the yield of hydrosilylation
| Project |
Sum of square, SS |
Degree of freedom, f |
Mean square, MS |
F value |
Contribution ratio, % |
| D |
17.6 |
3 |
5.87 |
83.56 |
49.22 |
| E |
17.07 |
3 |
5.69 |
81.29 |
47.72 |
| F |
0.48 |
3 |
0.16 |
2.29 |
0.8 |
| Error |
0.2 |
3 |
0.07 |
|
2.97 |
 |
| | Fig. 9 Trend of factors on the S/N ratio (hydrosilylation). | |
3.5 Phase behavior of siloxane in organic liquids and phase behavior of toluene, thickener and CO2
Silicone cannot be dissolved separately at high-pressure CO2, which has been shown by a high-pressure dissolution experiment.11,29–31 According to the literature10,31 and a high boiling point (110.6 °C), toluene is an excellent organic liquid to thicken CO2. Compared with hexane, a smaller amount is another important reason to choose toluene.32 Other solvents were excluded due to the large amount needed and poor thickening performance.9,33,34
To evaluate the solubility of the thickener in toluene, a mixed solution containing siloxane was placed in a glass bottle and stirred evenly at 25 °C. Then, the mixed solution was transferred to a cuvette to measure the absorbance by a UV-visible spectrophotometer at an absorption peak of 206 nm (toluene). In general, absorbance was almost constant with increasing polymer amount in toluene if the polymer and toluene could dissolve each other. By contrast, a turbid solution or gel would demonstrate poor solubility.
As seen in Table 7, these solutions containing different amounts of polymer (1 wt% to 3 wt%) were compared with pure toluene, but there was no difference visually between the solutions and pure toluene, and all solutions exhibited a single phase. Moreover, the stable absorbance illustrated excellent solubility of the thickener in toluene. As shown in Table 8, the viscosity of toluene increased with increasing polymer content at room pressure. Thus, this polymer could be used as a thickener of toluene, and the prepared polymer was soluble in toluene.
Table 7 Phase behavior of siloxane in toluene at 25 °C (λmax = 206 nm)
| Solvent |
Content (siloxane), wt% |
25 °C, A |
35 °C, A |
45 °C, A |
55 °C, A |
| Toluene |
0 |
0.312 |
0.306 |
0.310 |
0.314 |
| Toluene |
1 |
0.306 |
0.310 |
0.308 |
0.311 |
| Toluene |
2 |
0.311 |
0.305 |
0.312 |
0.307 |
| Toluene |
3 |
0.312 |
0.307 |
0.310 |
0.313 |
Table 8 Viscosity (mPa s) of toluene solution containing prepared siloxane at room pressure
| Solvent |
Content (siloxane), wt% |
25 °C |
35 °C |
45 °C |
55 °C |
| Toluene |
0 |
0.582 |
0.576 |
0.568 |
0.563 |
| Toluene |
1 |
0.586 |
0.575 |
0.570 |
0.566 |
| Toluene |
2 |
0.583 |
0.579 |
0.575 |
0.568 |
| Toluene |
3 |
0.601 |
0.592 |
0.585 |
0.578 |
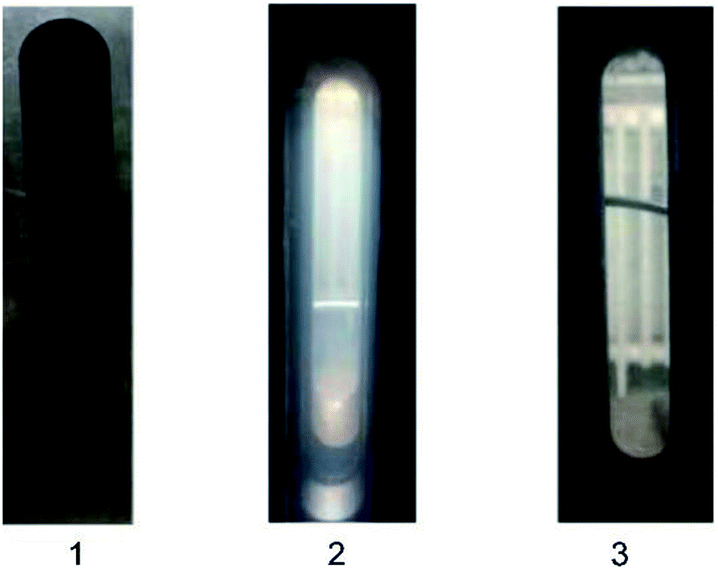
Moreover, the solubility of the prepared polymer in CO2 was measured from 20 °C to 50 °C and pressures of 6 MPa to 14 MPa. A single-phase state was observed visually (this was the only basis for determining dissolution) and phase behavior was observed mainly through the glass window of the dissolution equipment. Fig. 10 illustrates different phase behaviors, and single-phase status (dissolution) is shown in Fig. 10(3). Results showed that all cloud points at different temperatures and concentrations were <8 MPa.
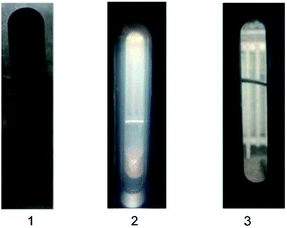 |
| | Fig. 10 Phase behavior of liquid CO2 containing the siloxane and 3-fold toluene (wt%). (1) Deep turbid state. (2) Mild turbid state. (3) Clarified state. | |
3.6 Thickening property of siloxane in CO2
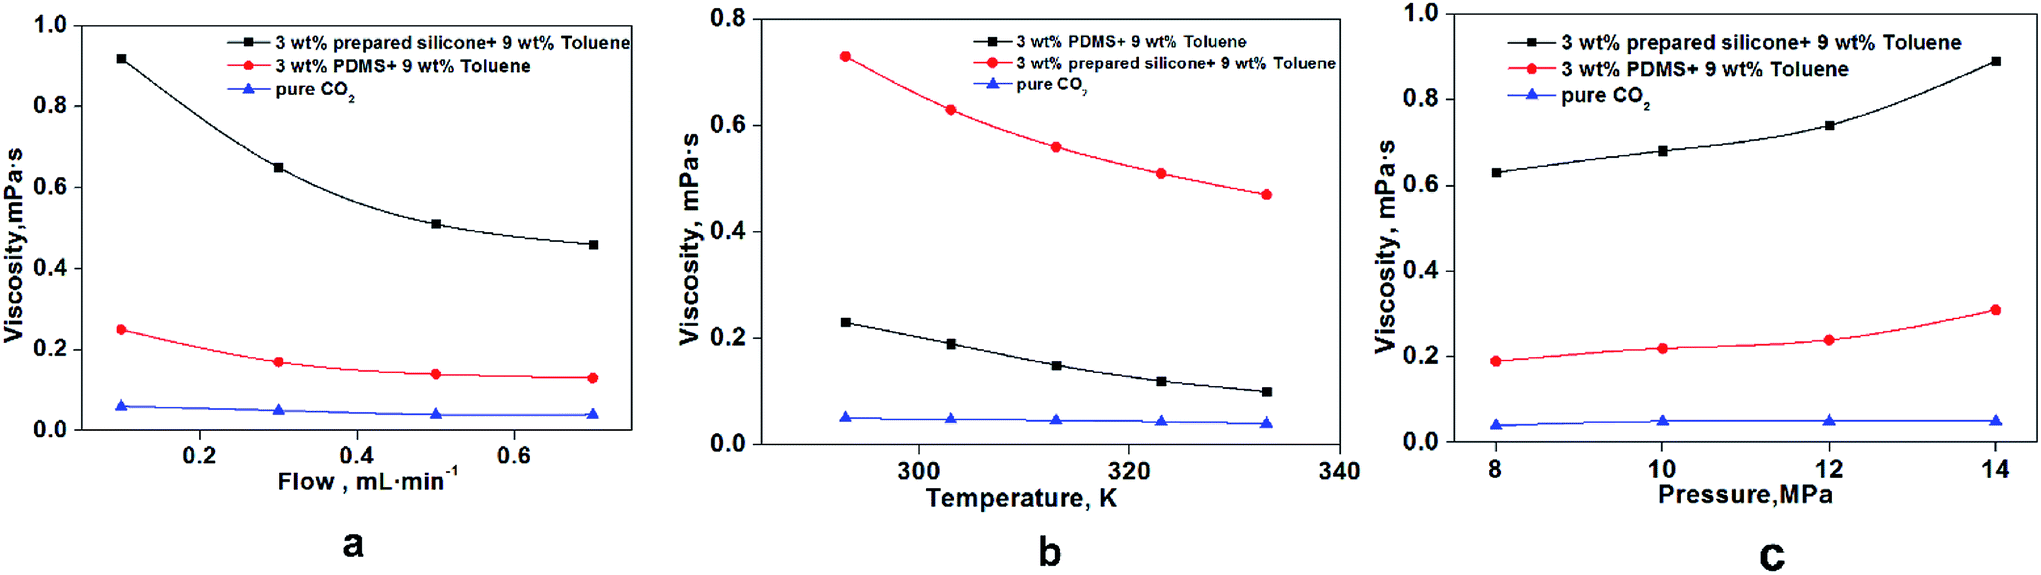
As shown in Fig. 11a, the viscosity of thickened liquid CO2 decreased with increasing flow rate at 0.1–0.7 mL min−1. The thickened liquid CO2 was considered to be a non-Newtonian fluid, which had shear thinning,29,35 and the mesh structures formed among these three chemicals were destroyed by the shearing action with increasing flow rate.36 Fig. 11b shows a clear and significant reduction in CO2 viscosity between 295 K and 335 K that was attributable to the effect of temperature on rheology. The change in CO2 viscosity was based mainly on changes in some of the properties of these mesh structures: spreading area of each mesh structure, density among grid structures, bond strength, and interaction forces among molecules (silicone polymer, toluene and CO2).37,38 The microscopic migration rate and activity of various molecules increased obviously with rising temperature, which resulted in fractures of bonds among molecules and damage to the grid structure formed by molecules. More specifically, the activation energy of molecules decreased from 295 K to 335 K, which resulted in reduced viscosity.29 A rising trend on viscosity was shown from 8 MPa to 14 MPa because the increased pressure could significantly reduce cracking of the mesh structure and molecular spacing.30
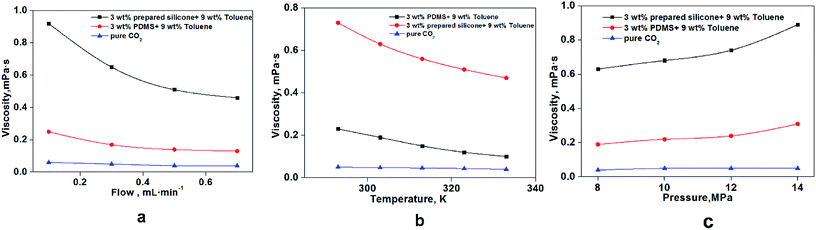 |
| | Fig. 11 Effect of different factors on the viscosity of thickened CO2. (a) Effect of flow rate at 8 MPa and 303 K; (b) temperature effect at 8 MPa and 0.3 mL min−1; (c) pressure effect at 303 K and 0.3 mL min−1. | |
To compare the thickening performance of epoxy-terminated polydimethylsiloxane in CO2, a commercial polydimethylsiloxane with the same Mn (21000) was used to evaluate CO2 viscosity. PDMS displayed a weaker thickening performance than that of the modified siloxane at the same measurement conditions. Studies39,40 have shown that polydimethylsiloxane has a poor thickening property in liquid CO2. Doherty32 prepared a silicone thickener that could increase CO2 viscosity significantly (300-fold), but the poor solubility, high dissolution pressure and co-solvent content hindered application of silicone for thickening CO2.
3.7 Thickening mechanism of prepared silicone in CO2
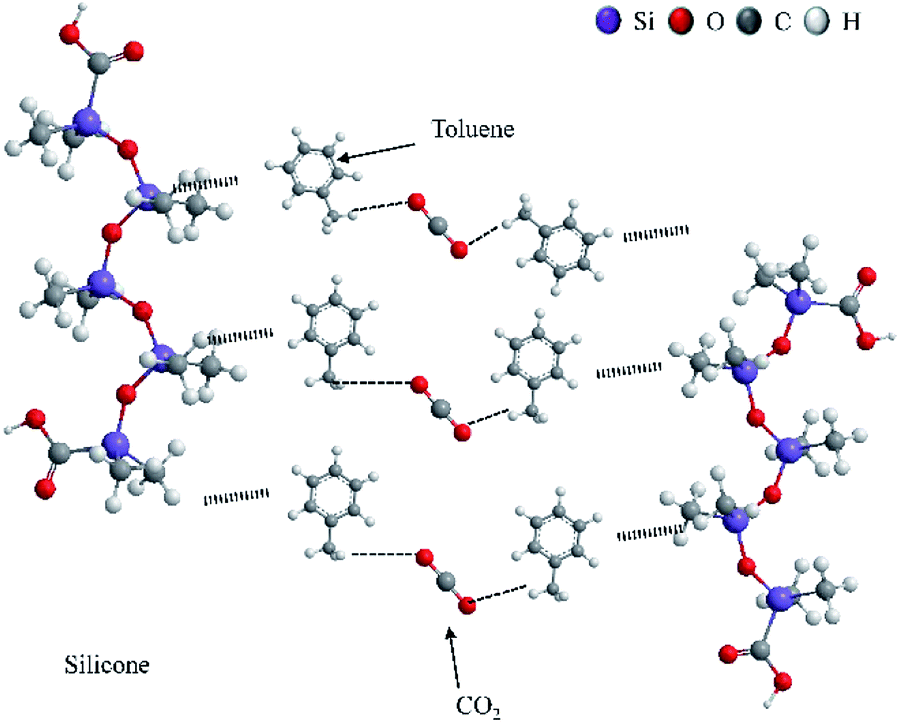
In previous studies, the thickening mechanism focused mainly on fluoropolymers and hydrocarbon polymers.6–8,41 By contrast, the thickening mechanism of siloxane in CO2 has not been proposed before. The thickening mechanism of silicone is similar to that of a surfactant,29 but the addition of a solvent is the biggest difference between two thickeners.29,42
As an electron-donating group, the phenyl group in toluene could interact with CO2 (ref. 43) to generate an induction force. Moreover, the C–H–O bond is the other reason to promote interaction between CO2 and toluene.44–47
The interaction between silicone and toluene was considered to be a non-polar bond according to the similar polarity between silicone and toluene.48,49 Several mesh structures were formed among toluene, CO2 and siloxane using the interactions mentioned above, and Li and colleagues proposed a theory of the thickening mechanism similar to that for silicone.1 Numerous mesh structures showed an increase in liquid viscosity macroscopically.29 The epoxy group and carbonyl group within the ester group could assist this prepared polymer to enhance the interaction between the polymer and CO2, and solubility and miscibility could be improved.6,50,51
4. Conclusions
To obtain an excellent yield, the prepared process of epoxy-terminated polydimethylsiloxane was optimized by a Taguchi method. This method could lead to obtaining optimal prepared parameters with considerably fewer experiments. Compared with polydimethylsiloxane, the thickened CO2 added to the modified siloxane showed a highly thickening performance for CO2 viscosity, and the thickened CO2 showed shear thinning. Increasing pressure was beneficial for improving CO2 viscosity. However, a decreasing trend was shown with increasing temperature. The prepared siloxane presented an excellent thickening performance and high recyclability for CO2 viscosity. Experimental results showed that this modified siloxane could be used to thicken CO2 (Fig. 12).
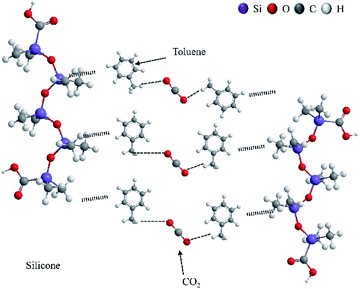 |
| | Fig. 12 Thickening mechanism of silicone polymer in liquid CO2. | |
Conflicts of interest
There are no conflicts to declare.
Acknowledgements
We send special gratitude to the Shandong Province Foam Fluid Efficient Exploitation of Oil and Gas Engineering Research Centre in the China University of Petroleum (East China). We thank Binfei Li for helping in the design of the capillary viscometer.
References
- Q. Li, Y. Wang, Q. Li, G. Foster and C. Lei, RSC Adv., 2018, 8, 8770–8778 RSC
 .
. - S. Ayatollahi, A. Hemmati-Sarapardeh, M. Roham and S. Hajirezaie, J. Taiwan Inst. Chem. Eng., 2016, 63, 107–115 CrossRef CAS .
- F. Zhao, H. Hao, J. Hou, L. Hou and Z. Song, J. Pet. Sci. Eng., 2015, 133, 52–65 CrossRef CAS .
- H. Kang, H. Lv, F. Gao, X. Meng and Y. Feng, Int. J. Coal Geol., 2018, 196, 19–28 CrossRef CAS .
- S. Zhang, Y. She and Y. Gu, J. Chem. Eng. Data, 2011, 56, 1069–1079 CrossRef CAS .
- Y. Wang, L. Hong, D. Tapriyal, I. C. Kim, I. Paik, J. M. Crosthwaite, A. D. Hamilton, M. C. Thies, E. J. Beckenman, R. M Enick and J. K. Johnson, J. Phys. Chem. B, 2009, 113, 14971–14980 CrossRef CAS PubMed .
- A. Dardin, J. M. DeSimone and E. T. Samulski, J. Phys. Chem. B, 1998, 102, 1775–1780 CrossRef CAS .
- C. F. Kirby and M. A. McHugh, Chem. Rev., 1999, 99(2), 565–602 CrossRef CAS PubMed .
- L. L. Williams, J. B. Rubin and H. W. Edwards, Ind. Eng. Chem. Res., 2004, 43, 4967–4972 CrossRef CAS .
- J. H. Bae and C. A. Irani, SPE Advanced Technology Series, 1993, 1, 166–171 CrossRef .
- M. J. O'Brien, R. J. Perry, M. J. Doherty, J. J. Lee, A. Dhuwe, E. J. Beckman and R. M. Enick, Energy Fuels, 2016, 30, 5990–5998 CrossRef .
- Z. B. Gonder, S. Arayici and H. Barlas, Sep. Purif. Technol., 2011, 76, 292–302 CrossRef .
- D. Yu, C. Wang, X. Cheng and F. Zhang, Appl. Surf. Sci., 2008, 255, 1865–1869 CrossRef CAS .
- G. Taguchi and Y. Yokoyama, Taguchi methods: design of experiments, American Supplier Institute (ASI) Press, Tokyo, Japan, 1993 Search PubMed .
- Y. C. Chen, P. J. Tsai and J. L. Mou, Environ. Sci. Technol., 2008, 42, 5298–5303 CrossRef CAS PubMed .
- C. Ramírez, M. Rico, A. Torres, L. Barral, J. López and B. Montero, Eur. Polym. J., 2008, 44, 3035–3045 CrossRef .
- S. S. Hou, Y. P. Chung, C. K. Chan and P. L. Kuo, Polymer, 2000, 41, 3263–3272 CrossRef CAS .
- M. Y. Chang, G. J. Tsai and J. Y. Houng, Enzyme Microb. Technol., 2006, 38, 407–414 CrossRef CAS .
- J. L. Rosa, A. Robin, M. B. Silva, C. A. Baldan and M. P. Peres, J. Mater. Process. Technol., 2009, 209, 1181–1188 CrossRef CAS .
- R. K. Roy, Design of Experiments Using the Taguchi Approach: 16 Steps to Product and Process Improvement, Wiley, New York, 2001 Search PubMed .
- S. Ranganathan, J. Tebbe, L. O. Wiemann and V. Sieber, Process Biochem., 2016, 51, 1479–1485 CrossRef CAS .
- A. C. Aycaguer, M. Lev-On and A. M. Winer, Energy Fuels, 2001, 15, 303–308 CrossRef CAS .
- H. J. C. De. Souza, C. B. Moyses, F. J. Pontes, R. N. Duarte, C. E. S. Silva, F. L. Alberto, U. R. Ferreira and M. B. Silva, Mol. Cell. Probes, 2011, 25, 231–237 CrossRef PubMed .
- R. Chauhan, T. Singh, N. Kumar, A. Patnaik and N. S. Thakur, Appl. Therm. Eng., 2017, 116, 100–109 CrossRef .
- A. Mehta, R. Siddique, B. P. Singh, S. Aggoun, G. Łagód and D. B. Hunek, Constr. Build. Mater., 2017, 150, 817–824 CrossRef CAS .
- F. Bernard, D. K. Papanastasiou, V. C. Papadimitriou and J. B. Burkholder, J. Phys. Chem. A, 2018, 122, 4252–4264 CrossRef CAS PubMed .
- D. W. Scott, J. Am. Chem. Soc., 1946, 68, 356–358 CrossRef CAS .
- T. C. Kendrick, B. Parbhoo and J. W. White, Organic Silicon Compounds, 1989, vol. 1, pp. 1289–1361, DOI:10.1002/0470025107.ch21 .
- X. Luo, S. Wang, Z. Wang, Z. Jing, M. Lv, Z. Zhai and T. Han, J. Pet. Sci. Eng., 2015, 133, 410–420 CrossRef CAS .
- R. M. Enick and J. Ammer, A literature review of attempts to increase the viscosity of dense carbon dioxide, Website of the National Energy Technology Laboratory, 1998, http://citeseerx.ist.psu.edu/viewdoc/download?doi=10.1.1.167.1728%26rep=rep1%26type=pdf Search PubMed .
- J. H. Bae, SPE International Symposium on Oilfield Chemistry, 1995, pp. 47–54, DOI:10.2118/28950-MS .
- M. D. Doherty, J. J. Lee, A. Dhuwe, M. J. O'Brien, R. J. Perry, E. J. Beckman and R. M. Enick, Energy Fuels, 2016, 30, 5601–5610 CrossRef CAS .
- J. P. Heller, D. K. Dandge, R. J. Card and L. G. Donaruma, SPE J., 1985, 25, 679–686 CAS .
- F. M. Llave, F. T. H. Chung and T. E. Burchfield, SPE Reservoir Eng., 1990, 5, 47–51 CrossRef CAS .
- S. Mortazavi, Chin. J. Chem. Eng., 2017, 25, 1360–1368 CrossRef CAS .
- X. Sun, X. Liang, S. Wang and Y. Lu, J. Pet. Sci. Eng., 2014, 119, 104–111 CrossRef CAS .
- P. C. Harris and P. M. Pippin, SPE Prod. Facil., 2000, 15, 27–32 CrossRef CAS .
- H. Bahrami, R. Rezaee, D. Nazhat and J. Ostojic, APPEA J., 2011, 51, 639–652 CrossRef .
- S. Cai, MPhil, Texas A&M University, 2010, https://oaktrust.library.tamu.edu/handle/1969.1/ETD-TAMU-2010-08-8375 .
- Z. Al. Yousef, MPhil, Texas A&M University, 2012, https://oaktrust.library.tamu.edu/handle/1969.1/ETD-TAMU-2012-08-11698 .
- G. G. Yee, J. L. Fulton and R. D. Smith, J. Phys. Chem., 1992, 96, 6172–6181 CrossRef CAS .
- S. Cummings, D. Xing, R. Enick, S. Rogers, R. Heenan, I. Grillo and J. Easto, Soft Matter, 2012, 8, 7044–7055 RSC .
- T. Sarbu, T. J. Styranec and E. J. Beckman, Ind. Eng. Chem. Res., 2000, 39, 4678–4683 CrossRef CAS .
- P. Raveendran and S. L. Wallen, J. Am. Chem. Soc., 2002, 124, 12590–12599 CrossRef PubMed .
- M. A. Blatchford, P. Raveendran and S. L. Wallen, J. Am. Chem. Soc., 2002, 124, 14818–14819 CrossRef CAS PubMed .
- T. Tsukahara, Y. Kayaki, T. Ikariya and Y. Ikeda, Angew. Chem., Int. Ed., 2004, 43, 3719–3722 CrossRef CAS PubMed .
- B. Chandrika, L. K. Schnackenberg and P. S. L. Wallen, Chem.–Eur. J., 2005, 11(21), 6266–6271 CrossRef CAS PubMed .
- I. Montes, C. Lai and D. Sanabria, J. Chem. Educ., 2003, 80, 447 CrossRef CAS .
- J. Wang, J. H. Horton, G. Liu, S. Y. Lee and K. J. Shea, Polymer, 2007, 48, 4123–4129 CrossRef CAS .
- S. Kilic, S. Michalik, Y. Wang, J. K. Johnson, R. M. Enick and E. J. Beckman, Ind. Eng. Chem. Res., 2003, 42, 6415–6424 CrossRef CAS .
- M. A. Blatchford, P. Raveendran and S. L. Wallen, J. Phys. Chem. A, 2003, 107, 10311–10323 CrossRef CAS .
Footnote |
| † Yanling Wang and Qiang Li contributed to the work equally and should be regarded as co-first authors. |
|
| This journal is © The Royal Society of Chemistry 2018 |
Click here to see how this site uses Cookies. View our privacy policy here. 
 Open Access Article
 This Open Access Article is licensed under a Creative Commons Attribution-Non Commercial 3.0 Unported Licence
 *a,
Weihong Dongc,
Qingchao Lia,
Fuling Wang
*a,
Weihong Dongc,
Qingchao Lia,
Fuling Wang